Bitcoin Stock Chart Fibonacci Analysis 062225Trading Idea
1) Find a FIBO slingshot
2) Check FIBO 61.80% level
3) Entry Point > 99,063/61.80%
Chart time frame:B
A) 15 min(1W-3M)
B) 1 hr(3M-6M)
C) 4 hr(6M-1year)
D) 1 day(1-3years)
Stock progress:B
A) Keep rising over 61.80% resistance
B) 61.80% resistance
C) 61.80% support
D) Hit the bottom
E) Hit the top
Stocks rise as they rise from support and fall from resistance. Our goal is to find a low support point and enter. It can be referred to as buying at the pullback point. The pullback point can be found with a Fibonacci extension of 61.80%. This is a step to find entry level. 1) Find a triangle (Fibonacci Speed Fan Line) that connects the high (resistance) and low (support) points of the stock in progress, where it is continuously expressed as a Slingshot, 2) and create a Fibonacci extension level for the first rising wave from the start point of slingshot pattern.
When the current price goes over 61.80% level , that can be a good entry point, especially if the SMA 100 and 200 curves are gathered together at 61.80%, it is a very good entry point.
As a great help, tradingview provides these Fibonacci speed fan lines and extension levels with ease. So if you use the Fibonacci fan line, the extension level, and the SMA 100/200 curve well, you can find an entry point for the stock market. At least you have to enter at this low point to avoid trading failure, and if you are skilled at entering this low point, with fibonacci6180 technique, your reading skill to chart will be greatly improved.
If you want to do day trading, please set the time frame to 5 minutes or 15 minutes, and you will see many of the low point of rising stocks.
If want to prefer long term range trading, you can set the time frame to 1 hr or 1 day.
BITCOIN trade ideas

People say Bitcoin is a safe haven… but these past few days are With everything going on between the U.S. and Iran, I thought BTC would hold up — maybe even rally. But nope.
It's dropping. Hard.
While gold and the dollar are climbing, Bitcoin is acting more like a risk asset than a safe one.
And honestly, that says a lot.
I’m not saying Bitcoin has no value — I actually like it. But when there’s real fear, real war, the big players dump it.
Seems like they still don’t trust it as “digital gold.”
Now... what really catches my attention is that BTC is dropping before other assets.
And maybe that’s a signal.
Maybe Bitcoin isn’t a safe haven yet…
But it might be an early warning that the market is getting ready for something bigger.
Just putting it out there. Watching closely.
Bitcoin Daily Update June 22nd 2025Bitcoin daily chart:
🔻 Bearish Signals
1. Break of Rising Trendline:
The price has broken below the upward (orange) trendline, indicating a shift in momentum.
This trendline had previously acted as support, so the break suggests growing selling pressure.
2. Support Levels:
BTC is now hovering just above $99,634, which appears to be a key short-term support.
The next major support is around $93,363 — a break below that could open the door to mid $80K or even $71K (0.786 Fibonacci level).
3. Market Cipher Indicator (middle panel):
The momentum wave is clearly descending, and VWAP (green) is curving down.
The money flow (red) is negative.
Bearish dots and crosses are appearing.
4. Stochastic RSI (bottom panel):
Both %K and %D lines are dropping sharply below the 20 line, suggesting downside momentum is strong.
No sign of bottoming out yet.
🟡 Neutral/Bullish Watch Points
If BTC holds $99.6K and reclaims $100,115 or $104,616, it could neutralize or reverse this bearish setup.
RSI is not oversold yet, so room remains for further downside before any strong bounce.
📉 Summary:
BTC is currently bearish on the daily chart with:
Breakdown from an uptrend.
Weak momentum.
Declining oscillators.
Support tests underway.
If $99.6K fails, eyes shift to $93.3K, and below that, $86.5K–$71.9K as potential zones.
....
🔻 Primary Trade Setup (Bearish)
⚙️ Type: Short Position
⏰ Timeframe: Daily
📉 Strategy: Trendline break and momentum continuation
Entry:
Below $99,500 (confirmation of trendline breakdown & continuation)
Targets:
1. Target 1: $93,363 — Previous support level
2. Target 2: $86,500 — Next horizontal support
3. Target 3: $71,949 — Major 0.786 Fibonacci level (high confluence)
Stop-Loss:
Above $100,600 (to avoid fakeout wicks)
Or tighter: $100,150 (for smaller R:R)
Risk-to-Reward (R:R):
Entry: ~$99,500
SL: ~$100,600 → ~1.1% risk
TP1: ~$93,300 → ~6.2% reward
R:R ≈ 5.6:1 (to TP1) — solid risk profile
🔄 Alternate Plan (Bullish Reversal Setup)
⚙️ Type: Long Position (Only IF price reclaims broken levels)
If BTC reclaims $100,600 and closes above $104,616, trend could resume up.
Entry:
Break and daily close above $104,616
Targets:
1. $110,616 — recent resistance
2. $112,000 — psychological + historical zone
Stop-Loss:
Below $100,600
Invalidates upward breakout
📊 Indicators to Watch:
VWAP: Still pointing down (bearish bias)
Money Flow Index: Still in red (risk-off)
Stochastic RSI: Resetting near bottom — could support bounce later
Much love and appreciation,
– chevs710

BTC USD ENTRY point 100000 target 101000 Stop Loss 99200 You're sharing a trade setup for BTCUSD:
- *Entry Point*: $100,000
- *Target*: $101,000
- *Stop Loss*: $99,200
Potential profit: $1,000
Potential loss: $800
Risk-reward ratio looks decent. What's driving your bullish outlook on Bitcoin? Technical analysis, market sentiment, or fundamental news?

Weekly review of SPY, QQQ, GC, CL, ETH, BTCWeekly review of SPY, QQQ, GC, CL, ETH, BTC for the week 6/23 - 27


Last time to buy bitcoin under 100K?Things are looking bleak, but isn’t that the time to buy? Institutions and governments are buying. Are you selling you’re to them?

Bitcoin Trend Alert⚠️ Double Top Formation Spotted on #BTC
Bitcoin made an all-time high of 💰 $111,969 on 22nd May 2025
Second peak formed on 9th June at 💸 $110,656
🧠 Classic sign of a double top reversal pattern in play!
🧱 Support Levels Tested Multiple Times:
🔹 12 May — Touched major support: $100,694
🔹 5 June — Retest at same level: $100,694
🔹 21 June — Yet another test, this time lower: $100,322
⚠️ 22 June — Support finally broken! 💥
BTC breached the psychological barrier of $100,000 🚨
😟 Ethereum joins the breakdown — both CRYPTOCAP:BTC and CRYPTOCAP:ETH have now broken their month-long range supports!
⛔️ Time to stay Cautious.
📉 The bulls may be exhausted. Eyes on the next support zones and volume activity.
🧩 Stay alert. Watch for retests and fakeouts. Don’t FOMO. Let price confirm!

BTCUSD: The Market Is Looking Down! Short!
My dear friends,
Today we will analyse BTCUSD together☺️
The recent price action suggests a shift in mid-term momentum. A break below the current local range around 102,641.61 will confirm the new direction downwards with the target being the next key level of 102,364.09.and a reconvened placement of a stop-loss beyond the range.
❤️Sending you lots of Love and Hugs❤️

Sell Setup BTCUSDCurrently, BTC/USD is approaching a key supply zone between $107,800 – $108,600, where price previously faced strong rejection. My expectation is that price will react similarly upon retest.
🧠 Trade Idea:
I'm anticipating a fakeout or liquidity grab above the zone, followed by a lower high formation.
Once this confirmation occurs, I’ll be looking for a short entry, targeting the major demand zone below, around $100,800 – $101,600.
✅ Confluences:
Previous price rejection from this same resistance zone.
Clean bearish imbalance below that still needs filling.
Lower timeframes showing signs of exhaustion as we approach resistance.
🕵️♂️ Entry Trigger:
I’ll wait for bearish price action within or just above the yellow resistance zone (e.g. bearish engulfing, lower high, or break of structure).
📉 Target:
TP Zone: $101,000 area
SL: Just above the fakeout zone to manage risk effectively.

Bullish Hidden Divergence on the DayOn the Day chart at this time, we see BTC making a Higher High compared to it's RSI, if I am not mistaken that is Bullish Hidden Divergence. Will Bulls be able to push prices back to the 107,000 price region? The Bears still have price under the 50 EMA on the daily. We need to see how price reacts to the wedge shape structure in purple.

BTC had break down the 4H trend line Time for long term shortTrend line had been broken down not only once but more than 1 time shows a strong bearish bias momentum with strong volume
Which confirmed by retest the resistance twice and failed to break it out and the pressure still on the downward momentum after several attempts to push higher and successfully pushed down-so set your short positions SL above 105,600 to avoid any wicks attempts
Entry 102,600. / 102,800
SL. 103,600
TP1 @. 101,220
TP2 @ 100,250
TP3 @ 99,550
Runners to hold if you wish 98,500
Wish for all best of luck and well managed Trade setup , enjoy the trend movment

BTC/USD Testing Channel Support – Bullish Rebound in Sight?Bitcoin is currently testing the lower boundary of the descending channel around the 101,844 support level. A strong bounce from this level suggests a potential bullish correction in the short term.
As long as the price holds above this key support, a move towards the next resistance levels at 103,449 and 104,411 remains likely. However, a clear break below 101,844 would invalidate the bullish outlook and resume the downward trend.
This setup offers a tactical opportunity for intraday traders to monitor price behavior around current levels.

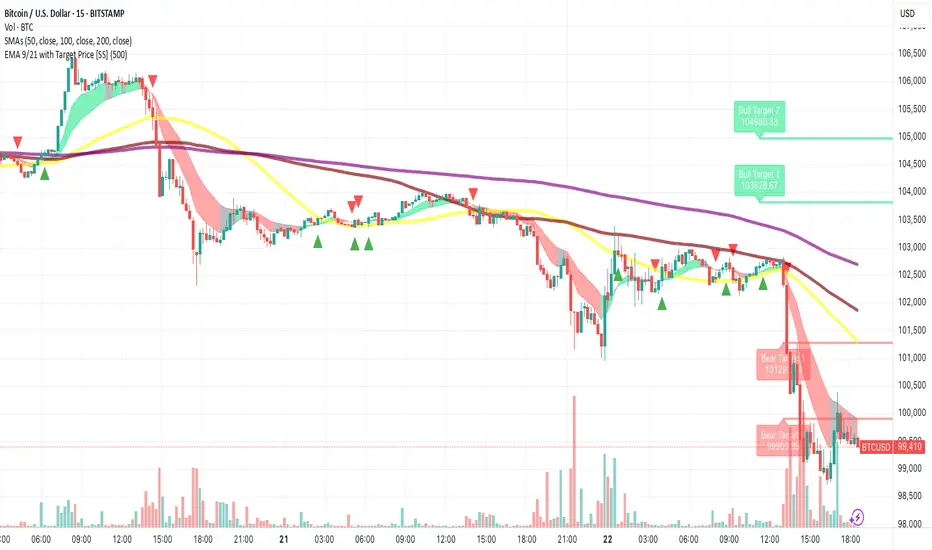
More BTC trades📊 BTCUSD 30m – Top AND Bottom Nailed with ELFIEDT
🔻 First, our system warned of a major top with double DOWN signals — just before the market dumped over 3,000 points.
🔼 Then, as panic set in, multiple UP signals printed near the low — before a clean reversal kicked in.
💡 This is the power of structured, data-backed reversals.
When price disconnects from value, and RSI confirms, our indicator steps in with laser precision.
🚫 No guessing.
🚫 No hype.
✅ Just consistently mapped turning points — visible in real-time.
🧠 If you’re still sitting on the sidelines or relying on lagging tools, it’s time to upgrade.
📲 Message us to get access and learn how to catch the turns, not chase the trends.
⸻
#BTCUSD #Bitcoin #CryptoReversals #ELFIEDT #RSIReversion #BTCSignals #CryptoTrading #BTC #TechnicalTrading #SmartEntries #TopAndBottom #NoLagJustEdge #ReversionStrategy #XReversion #BTC30min #CryptoEdge #TradingViewStrategies
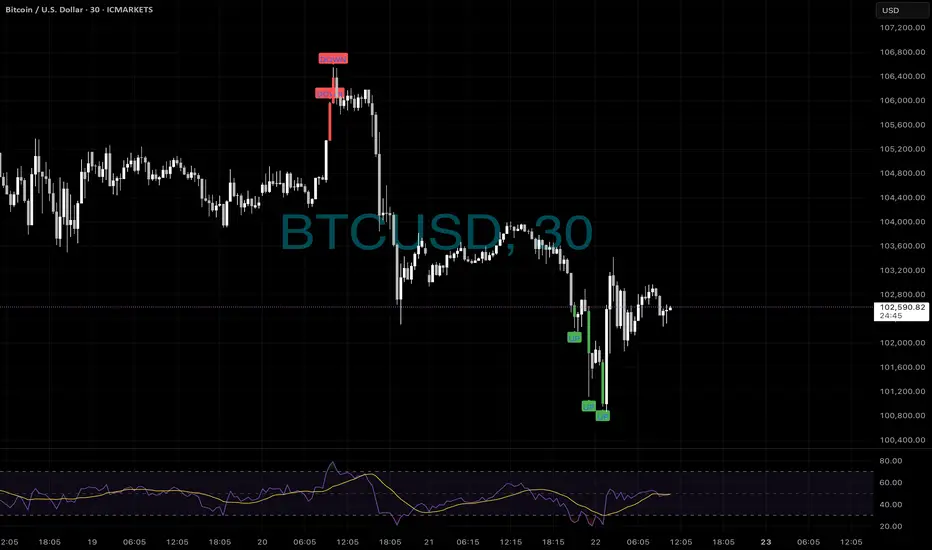
BTC - Also works💥 BITCOIN 15m – Top Sniped by ELFIEDT Reversion
This wasn’t luck. This was precision.
Just before Bitcoin tanked over $2,000…
🔻 Our indicator printed multiple “DOWN” signals right at the top.
🔁 RSI divergence confirmed fading strength — and the reversal was brutal.
📉 If you caught this with us, you already know:
When price is overstretched and RSI signals weakness, we strike.
No hype. No chasing. Just high-probability trades, marked in real time.
🧠 You could still be buying tops and hoping…
Or you could be trading with structure, confluence, and edge.
📲 DM us to get access to the full ELFIEDT system and start dominating crypto and indices alike.
⸻
#BTCUSD #BitcoinTrading #CryptoSignals #RSIDivergence #ReversionTrade #ELFIEDT #SmartTrading #TradingEdge #PriceAction #TopReversal #TradingViewIndicators #PrecisionTrading #BearishMomentum #XReversion #CryptoTraders #BTCShort
BTC Possibility of dropping to 97K Region This is just my own prediction. Please do your own research and due diligence when trading. Trade safe and manage your risk


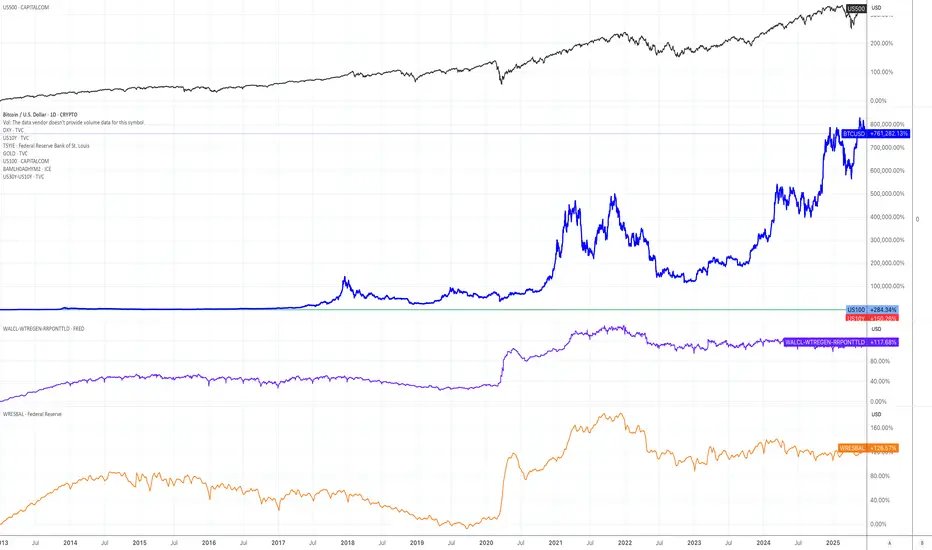
The influence of high-frequency data on price fluctuationsMajor Datasets for Price Trend Analysis: Types, Sources, and Applications
1. Financial and Market Datasets
Stock and Equity Markets:
Source: Bloomberg Terminal, Yahoo Finance, Alpha Vantage (API), Reuters Eikon.
Data Structure: Time-series data (daily/intraday prices, trading volumes, market capitalization) for stocks, indices (e.g., S&P 500, NASDAQ), and commodities (gold, oil).
Use Case: Analyzing stock price trends via technical indicators (MACD, RSI) or fundamental analysis, predicting market volatility using GARCH models.
Cryptocurrency Markets:
Source: CoinGecko, CoinMarketCap, Binance API, Kaiko (professional crypto data).
Data Structure: Real-time or historical price data for cryptocurrencies (BTC, ETH), trading pairs, order book depth, and blockchain transaction metrics.
Use Case: Studying price trends in decentralized markets, evaluating correlations with traditional assets, or developing algorithmic trading strategies.
Bitcoin Under Resistance: Neutral Core, Bearish Pressure.⊢
⟁ BTC/USD – BINANCE – (CHART: 4H) – (Date: June 22, 2025).
⟐ Analysis Price: $103,041.65.
⊢
⨀ I. Temporal Axis – Strategic Interval – (H4):
▦ EMA21 – (Exponential Moving Average 21-Period) – ($103,957.85):
∴ The current price is below the 21EMA, signaling weakness in short-term momentum;
∴ The slope of the moving average is negative, reflecting ongoing downward pressure;
∴ Recent attempts to reclaim the level were rejected, reinforcing its role as dynamic resistance.
✴️ Conclusion: The 21EMA acts as an active intraday resistance, and its breakout is a primary condition for any directional shift.
⊢
▦ EMA50 – (Exponential Moving Average 50-Period) – ($104,101.19):
∴ The 50 EMA remains above the price and the 21EMA, confirming a bearish trend alignment over the mid-term;
∴ The widening gap between EMA's suggests a well-established downward trend;
∴ A reclaim of both EMAs is required to revalidate bullish structure.
✴️ Conclusion: The 50EMA stands as a structural mid-term resistance, whose breakout would mark a tactical trend reversal.
⊢
▦ VPVR – (Volume Profile Visible Range) - (75, Up/Down):
∴ The POC (Point of Control) is concentrated around the $104,000 – $105,000 zone, just above the current price;
∴ This region reflects the highest volume concentration and tends to act as passive resistance or a redistribution zone;
∴ There’s a visible volume gap between $100,000 and $102,000, creating vulnerability to rapid price moves.
✴️ Conclusion: Price remains below institutional interest concentration, limiting upside potential unless volume reclaims the POC zone.
⊢
▦ BB – (Bollinger Bands - 20-Period SMA, 2.0 StdDev):
∴ The previous candle tapped the lower band and triggered a technical buy reaction (mean reversion);
∴ The mid-band aligns precisely with the 50 EMA (~$104,100), reinforcing confluence resistance;
∴ The channel shows slight downward expansion, suggesting volatility may continue to favor bears.
✴️ Conclusion: The recent bounce is technical relief; there is no structural reversal unless the price reclaims the mid-band.
⊢
▦ RSI – (Relative Strength Index) – (41.76):
∴ RSI is recovering from oversold territory but remains below the neutral 50 mark;
∴ The absence of a clear bullish divergence with price weakens the reversal thesis;
∴ RSI resistance lines sit between 45 and 50 – key levels that must be breached to confirm relief.
✴️ Conclusion: RSI signals technical relief, but still operates within a bearish zone — no clear evidence of dominant buying force yet.
⊢
▦ MACD – (Moving Average Convergence Divergence) – (MACD: –135.56 | Signal: –539.84):
∴ MACD line is crossing the signal line from below, generating an early bullish reversal signal;
∴ The histogram is contracting on the negative side, showing seller exhaustion;
∴ Readings remain deep in negative territory, requiring further confirmation.
✴️ Conclusion: MACD hints at momentum reversal, though structural validation requires a return to the positive zone.
⊢
▦ VOL – (Volume Bars):
∴ Volume increased significantly during the recent bounce, indicating reactive buyer demand;
∴ However, follow-through volume was not sustained — warning of potential bull trap;
∴ The absence of consistent volume undermines the durability of the bounce.
✴️ Conclusion: Volume shows reactive presence, but lacks sustained confirmation — recovery may be short-lived.
⊢
🜎 Strategic Insight – Technical Oracle:
∴ Bitcoin on the 4H chart is staging a relief move after recent sell-side pressure, yet remains below all key EMAs, under volume-based resistance, and without confirmation from momentum indicators.
∴ The structure is best defined as technical relief, not a confirmed trend reversal.
⊢
∫ II. On-Chain Intelligence – (Source: CryptoQuant & BGeometrics):
▦ Exchange Inflow Total - (All Exchanges) = (Latest Spike Zone ~103K):
∴ A recent uptick in Bitcoin inflows to exchanges is visible at local price levels, aligning with prior rejection zones;
∴ Increased inflows suggest potential intent to distribute, especially at resistance;
∴ Historically, such inflow patterns precede local price weakness or continuation of retracement.
✴️ Conclusion: Exchange inflow data warns of potential short-term sell pressure, supporting a cautious outlook near current levels.
⊢
▦ Funding Rate – (Binance Perpetual) – (Near Neutral to Slightly Positive):
∴ Current funding rates remain slightly positive but balanced, reflecting lack of directional conviction from leveraged traders;
∴ The absence of aggressive long bias reduces the risk of long squeezes but also suggests weak bullish momentum;
∴ Historically, neutral funding rates precede volatile expansions when followed by imbalances.
✴️ Conclusion: Funding rate indicates a neutral sentiment posture - not bearish, but lacking speculative bullish fuel.
⊢
▦ Open Interest – (All Exchanges) – (~$33.2B):
∴ Open Interest is elevated, marking one of the highest levels since April;
∴ The price is falling while OI remains high - a classic divergence signaling potential liquidation risk;
∴ This setup increases volatility probability and indicates the market is loaded with directional exposure.
✴️ Conclusion: Open Interest suggests a high-risk environment; either a cascade of liquidation or a sharp reversal is imminent.
⊢
▦ Realized Price – (Market: $103K | Realized: ~$47.5K):
∴ The gap between market price and realized price is vast, reflecting that most market participants are sitting on large unrealized gains;
∴ This positioning exposes the market to profit-taking impulses;
∴ The lack of compression between these metrics implies no capitulation is underway.
✴️ Conclusion: Market remains well above realized cost basis, implying latent sell-side risk and no evidence of fear-driven exits.
⊢
▦ UTXO Age Bands – (Realized Price by Age = 6m–3y clusters above $90K):
∴ Long-term holders (6m–3y) maintain positions well in profit, with realized values near or above $90K;
∴ No major movement from these cohorts detected — suggesting continued conviction or strategic dormancy;
∴ Younger UTXO bands are positioned lower, indicating recent accumulation remains underwater.
✴️ Conclusion: No signs of distribution from experienced holders — current structure favors hodler passivity, not capitulation.
⊢
▦ Miner Outflows – (Miner Transfer Volume Stable):
∴ Miner outflows remain stable, with no sharp spikes in transfers to exchanges;
∴ Implies no immediate operational selling pressure from mining entities;
∴ Miner behavior remains conservative, awaiting directional confirmation.
✴️ Conclusion: Miners are currently not a source of sell pressure, reinforcing structural equilibrium in supply flow.
⊢
🜎 Strategic Insight – On-Chain Oracle:
∴ The on-chain structure supports a technically vulnerable, yet fundamentally intact market; ∴ ∴ Exchange inflows and high Open Interest signal short-term caution, while the lack of miner selling, stable long-term holder behavior, and distance from realized price all point to no deep structural breakdown;
∴ Expect heightened volatility with directional resolution dependent on external catalysts or spot-driven pressure.
⊢
⌘ Codicillus Silentii – Strategic Note:
∴ Temporal framework reveals local reactive strength, but lacks structural realignment;
∴ On-chain flow warns of directional tension - neither resolve nor breakdown confirmed;
∴ Macro environment holds liquidity in suspension, awaiting a trigger;
∴ All vectors align under strategic ambiguity - stillness is not stasis, but anticipation.
⊢
𓂀 Stoic-Structural Interpretation:
▦ Structurally Neutral:
∴ The broader structure is intact - no systemic breakdown, yet no resumption of trend authority;
∴ Exchange inflows and high OI generate latent fragility, despite holder and miner resilience;
∴ The system holds - but without forward thrust, the architecture is stable, not ascendant.
⊢
▦ Tactically Cautious:
∴ Technical signals show reaction, not reversal - EMA's remain unbroken, volume is passive, RSI is capped;
∴ On-chain risk (inflows, OI) outpaces confirmation of strength;
∴ Action without structure is speculation - the trader must remain coiled, not extended.
⊢
⧉
⚜️ Magister Arcanvm (𝟙⟠) – Vox Primordialis!
𓂀 Wisdom begins in silence. Precision unfolds in strategy.
⧉
⊢

Bitcoin Trend AnalysisBITSTAMP:BTCUSD BINANCE:BTCUSDT COINBASE:BTCUSD INDEX:BTCUSD
BTCUSD trend shows multiple bearish indications.
- Monthly RSI bearish divergence. This is the 3rd monthly bearish divergence in the entire BTC history. The previous one was the ATH before the 2022 recession. BTC price dropped 70% in 2022.
- Weekly RSI downtrend.
- Weekly MACD downtrend.
- Weekly bearish momentum red candles and downtrend wicks.
If the history repeats itself and BTC drops 70% like in 2022, it will find its final support around 31,500, but we don't know for sure yet. Before that, a few key levels of support needs to be penetrated. 75,000 is a major support we need to watch for.

BTC Inverse H&S Still on TrackWe have tracked this Inverse head and shoulders since first testing the all times highs. We expected another test of ATH to start the next correction leg down. We are not tracking a trip back to $92,000-$89,000 to set up a major H&S pattern that should initiate our next impulse to $150,000-$180,000 to mark the end of the bull market. Lets see how June 2025 monthly candle closes.

Long term parabola setting up on weeklyJust a reminder to zoom out and observe the weekly trend. Even though on a daily basis it may seem we are grinding sideways, if we look at the weekly the trend is getting steeper and steeper, if this holds up we're not far away from starting a huge parabolic move.

Bitcoin Dip Coming Soon1. Historical Example (Left Side of the Chart - around 2021-2022):
"NFT" Label at the Top: The trader has labeled a peak around late 2021 with "NFT." This likely signifies a period of market euphoria or a local top, possibly correlated with a peak in NFT hype.
Failure to Make New Highs / Bearish Structure: After this peak, the price action shows lower highs and lower lows, indicating a downtrend.
Break of Support: The price broke down from a previous support area.
Targeting Previous Demand: The arrow points down towards a shaded maroon box. This box represents a significant area of previous demand/support FVG (roughly $15,000 - $30,000 in this hypothetical chart) where buyers previously stepped in, or where price consolidated before a major move up. The expectation was that price would revisit this significant prior zone.
2. Current/Projected Scenario (Right Side of the Chart - 2025 onwards):
"NFT" Label at the Current Top: Again, an "NFT" label is placed near the recent high (around
105,000 − 105,000− 110,000 in this chart). This suggests the market is again at a euphoric peak or a significant local top.
Potential Double Top / Rejection: The price has made a significant high and seems to be struggling to push further, showing signs of rejection (as indicated by the recent candles with upper wicks and a potential downturn). This could be forming a double top or a lower high relative to the absolute peak.
Two-Stage Short Target:
First Target (Short Arrow): The shorter arrow points down to a horizontal line around the $75,000 - $80,000 level. This is likely a near-term support level, perhaps a previous swing low or an area of recent consolidation. A break below the current highs might lead to a test of this level.
Second, Larger Target (Long Arrow): The longer arrow points down to a much larger shaded maroon box. This box (roughly $30,000 - $40,000 in this chart) represents a significant, longer-term demand/support zone. This zone was a major area of consolidation or previous resistance that turned into support before the most recent leg up to the $100k+ levels.
Rationale for the Deeper Target: If the near-term support (around 75k−75k−80k) fails to hold, the trader expects a more significant correction.
