Btcusd techinical analysis.Btcuad techinical analysis next move posibale at h1 time frame.not finchinical advice.
BITCOIN trade ideas


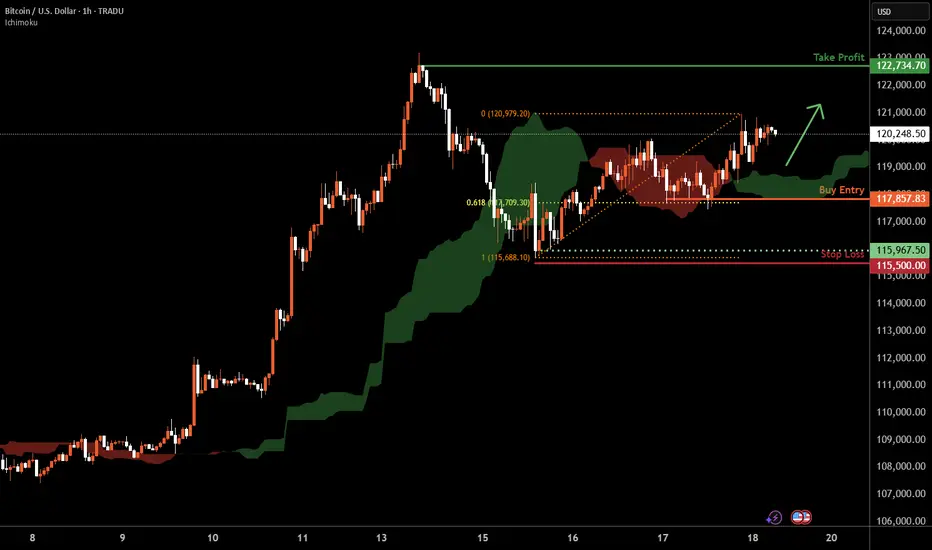
Bitcoin H1 | Falling toward a 61.8% Fibonacci supportBitcoin (BTC/USD) is falling towards a swing-low support and could potentially bounce off this level to climb higher.
Buy entry is at 117,857.83 which is a swing-low support that aligns with the 61.8% Fibonacci retracement.
Stop loss is at 115,500.00 which is a level that lies underneath a swing-low support.
Take profit is at 122,734.70 which is a swing-high resistance.
High Risk Investment Warning
Trading Forex/CFDs on margin carries a high level of risk and may not be suitable for all investors. Leverage can work against you.
Stratos Markets Limited (tradu.com ):
CFDs are complex instruments and come with a high risk of losing money rapidly due to leverage. 66% of retail investor accounts lose money when trading CFDs with this provider. You should consider whether you understand how CFDs work and whether you can afford to take the high risk of losing your money.
Stratos Europe Ltd (tradu.com ):
CFDs are complex instruments and come with a high risk of losing money rapidly due to leverage. 66% of retail investor accounts lose money when trading CFDs with this provider. You should consider whether you understand how CFDs work and whether you can afford to take the high risk of losing your money.
Stratos Global LLC (tradu.com ):
Losses can exceed deposits.
Please be advised that the information presented on TradingView is provided to Tradu (‘Company’, ‘we’) by a third-party provider (‘TFA Global Pte Ltd’). Please be reminded that you are solely responsible for the trading decisions on your account. There is a very high degree of risk involved in trading. Any information and/or content is intended entirely for research, educational and informational purposes only and does not constitute investment or consultation advice or investment strategy. The information is not tailored to the investment needs of any specific person and therefore does not involve a consideration of any of the investment objectives, financial situation or needs of any viewer that may receive it. Kindly also note that past performance is not a reliable indicator of future results. Actual results may differ materially from those anticipated in forward-looking or past performance statements. We assume no liability as to the accuracy or completeness of any of the information and/or content provided herein and the Company cannot be held responsible for any omission, mistake nor for any loss or damage including without limitation to any loss of profit which may arise from reliance on any information supplied by TFA Global Pte Ltd.
The speaker(s) is neither an employee, agent nor representative of Tradu and is therefore acting independently. The opinions given are their own, constitute general market commentary, and do not constitute the opinion or advice of Tradu or any form of personal or investment advice. Tradu neither endorses nor guarantees offerings of third-party speakers, nor is Tradu responsible for the content, veracity or opinions of third-party speakers, presenters or participants.
BTC - HYPERBOLIC FINISH This box here where we right shit in, what it really worth? You will never understand technical analysis if you think reading words in a little box mean something. BTC , next top mid frame with a throw over of center to $164,000. Then consolidation around the core to $138,000, then the hyperbolic finish to $187,500+. Nuf said. Good luck. Volatility will be high, but mainly move in one direction. Murrey Math, ( Which trading view wont let me display because its an unpublished indicator , Elliott Wave, Kumar Wave being used for this forecast.

Bitcoin: Short term tradeHello,
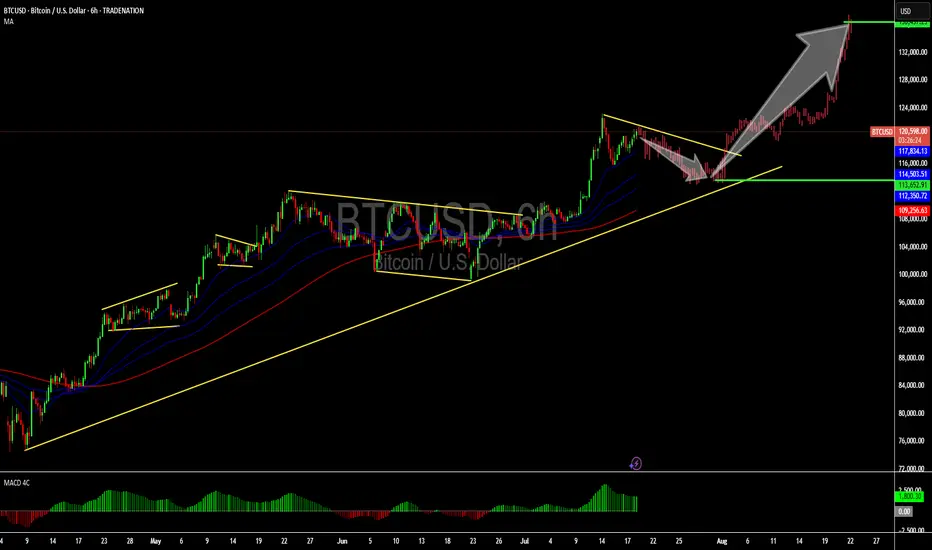
Cryptocurrencies, particularly major coins like Bitcoin, have experienced a volatile yet exhilarating rally in July 2025, reaching unprecedented all-time highs. This surge has attracted significant attention, drawing in new investors driven by fear of missing out (FOMO) and heightened market enthusiasm. While Bitcoin’s long-term potential remains robust, our analysis suggests a near-term correction is likely.
From a technical perspective, Bitcoin is currently undergoing a corrective phase as early investors capitalize on recent gains by taking profits. Chart patterns indicate the formation of a bullish flag, a continuation pattern that often precedes further upside after a consolidation period. We recommend that investors exercise patience and wait for the correction to fully develop. Optimal buying opportunities are anticipated around the $113,000 level, with a short-term price target of $130,000.
A key technical indicator, the Moving Average Convergence Divergence (MACD), is approaching a zero-line crossover, which could serve as a strong catalyst to confirm the resumption of Bitcoin’s upward momentum. We remain bullish on Bitcoin, maintaining an overweight position in our portfolio with a short-term target of $132,000.
Disclosure: I am part of Trade Nation's Influencer program and receive a monthly fee for using their TradingView charts in my analysis.
Bitcoin Extends Rally – Eyeing $121K+📊 Market Overview:
•Bitcoin is trading around $120,013, up +0.0149% on the day, with a daily range of $117,715 – $120,691 — continuing momentum after a historic rally.
•The rally is supported by strong inflows into BTC ETFs, institutional demand, and pro-crypto legislation recently passed in the U.S. House of Representatives.
📉 Technical Analysis:
• Key resistance: $121,000 – $122,000 (next technical target post breakout)
• Nearest support: $118,000 – $119,000 (aligns with 50 MA and previous consolidation zone)
• EMA 09: Price is above the EMA 09, confirming strong short-term bullish momentum
• Candlesticks / Volume / Momentum: RSI and MACD remain bullish; rising volume in ETFs and institutional flows confirm upward momentum.
📌 Outlook:
Bitcoin is likely to extend its gains in the short term if it holds above $119,000–$120,000 and institutional buying continues.
• Holding above $120,000 → potential to test $121,000 – $122,000
• Falling below $119,000 → risk of correction to $118,000
💡 Suggested Trading Strategy:
BUY BTC/USD at: 119,500 – 120,000
🎯 TP: 121,500
❌ SL: 118,500
SELL BTC/USD at: 121,000 – 122,000 (if bearish reversal signals appear)
🎯 TP: 120,000
❌ SL: 122,500

BTC intra?
Hi
Do you know?
www.investopedia.com
If your initial plan is BUY.. whatever reasons: Fundamental/ outlook buy
We'll take this trade; reason
Two Yeses : Outlook BUY Pattern BUY
How will it react?
Answer: I don't know
High probability : Yes
Where do you enter? Your preference
wait retrace or now... just
If you wait.. might not get the ticket
If calculate between entry and stop loss: pips
And divide by what you re risking in $ to pips
All the best

BTC OutlookIn the volatile world of trading, uncertainty is the only constant. Could prices dip to 75k before surging to 115k? Is such a drop a brief pullback or the start of a prolonged downturn? What technical or fundamental signals might indicate a recovery toward 115k?
Disclaimer: This content is for informational purposes only and does not constitute financial advice. Always consult a professional before making any investment decisions.

BTC Longsim looking at crypto longs from here because the market is showing signs of a bullish continuation.
BSTI Triggered Buy SignalThe Bitcoin Swing Trade Indicator triggered a buy signal. None of the individual indicators have triggered a bottom, but the overall "risk" is below the trigger line.
Note: I know it is unfair to publish this idea when the BSTI isn't available to y'all, but what are you gonna do? It isn't quite ready for prime time, but I wanted to make y'all aware of the signal.

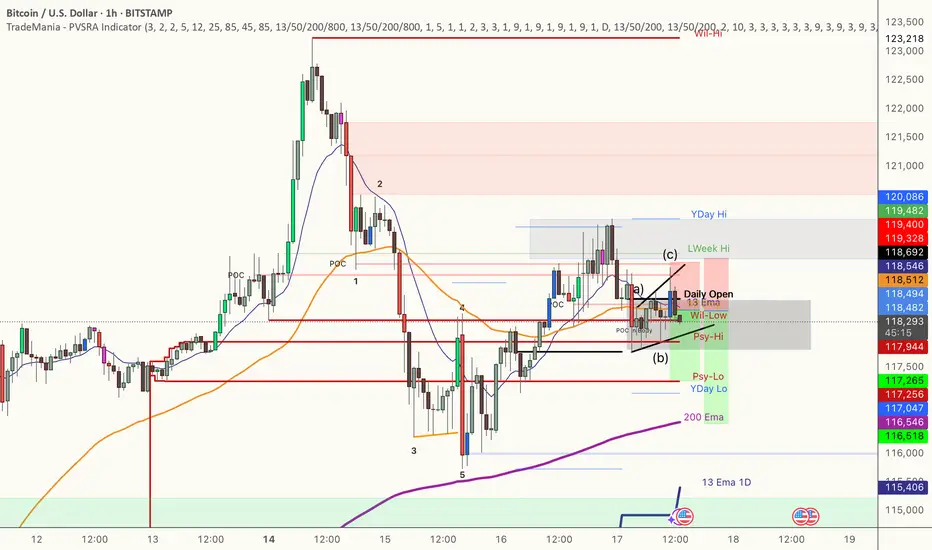
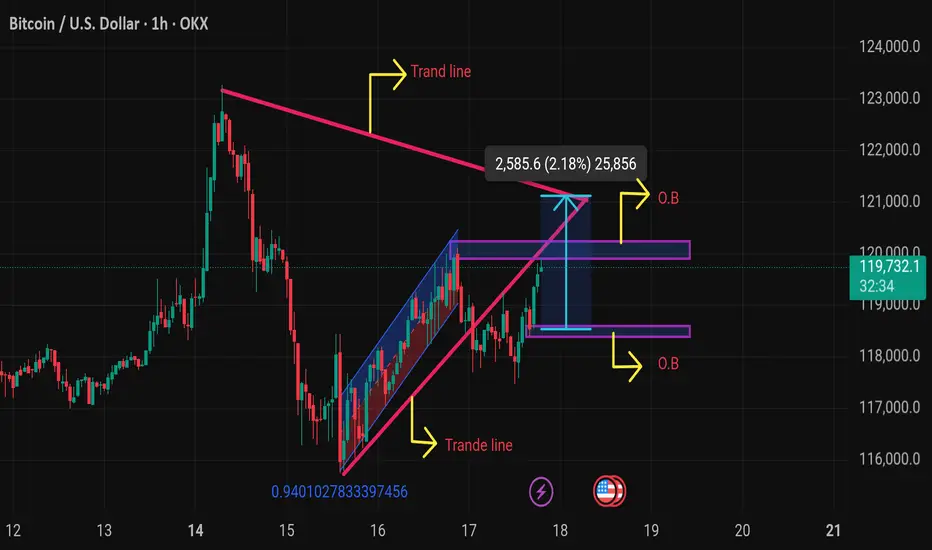
Btcusd techinical analysis.The chart shows a BTC/USD (Bitcoin vs. US Dollar) technical analysis on the 1-hour timeframe. Here's a detailed breakdown:
---
🔍 Chart Elements & Interpretation:
1. Trend Lines:
Upper Pink Trend Line: Acts as a resistance from a previous high.
Lower Pink Trend Line: Represents a support line from the recent upward trend.
Blue Channel: Shows a rising wedge or ascending channel (often a bearish reversal pattern).
2. O.B (Order Blocks):
Upper O.B Zone (~120,000–121,000): Potential supply zone or area of resistance.
Lower O.B Zone (~117,500–118,500): Possible demand zone or support.
3. Price Projection:
A measured move of 2,585.6 points (2.18%) is marked upward from the current breakout attempt.
4. Current Price:
BTC is trading at $119,771.8, with a +0.90% increase at the time of this chart.
---
🧠 Technical Outlook:
Bullish Case:
Breakout above the upper trend line and clearing the upper O.B could lead to a continuation toward 122,000+.
If BTC respects the demand zone and bounces, the uptrend may resume.
Bearish Case:
Failure to break above resistance or rejection at
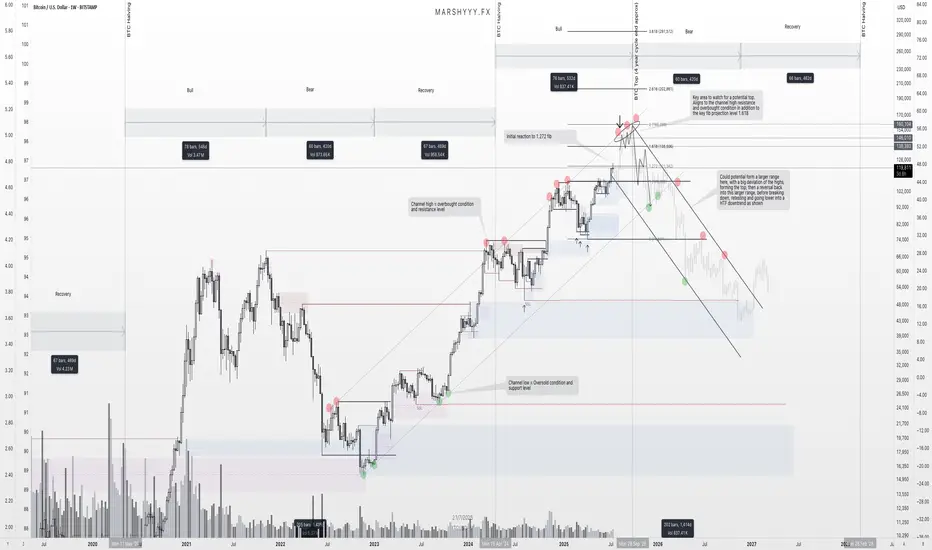
BTC – Final Push Before the Top? Here's What I’m WatchingBeen getting a lot of questions recently about where I think BTC tops this cycle, so I figured it’s time to lay out what I’m seeing on the higher timeframes and what could be coming next.
First off, I want to stress this again — USDT.D will be the key chart for spotting the top. It’s been one of the most accurate indicators across the board for understanding tops and bottoms. But it’s even more powerful when used alongside broader structure and confluence, which is what I’m doing here.
Looking at BTC’s high timeframe structure, I’ve been tracking this ascending trend channel since 2023 — and we’ve remained within its bounds beautifully. Every leg up has been met with a reaction near the channel highs, while each major correction has tapped into the lower channel support or just below midline before continuing the trend.
Right now, price is pushing back up toward that upper channel resistance, and if it behaves like it has previously, I’d expect it to act as a major magnet again. That aligns with a projected range of $140,000 to $160,000, depending how deep the wick runs or how extended this move gets from the channel midline.
On top of that, fib extensions from the previous high to low give us another layer of confidence. We’ve already seen a reaction at the 1.272 level, which paused price temporarily. The next big fib? The 1.618 — which sits right around $138k — adding confluence with the top of this HTF trend channel.
What makes this even more interesting is that this move is aligning near-perfectly with the 4-year cycle structure, which suggests a potential cycle top around September 2025. That’s roughly two months away, and it fits the pattern of previous cycles where BTC tops approximately 18–20 months post-halving.
As we approach this zone, I’ll be watching for the usual signs: slowing momentum, bearish divergence, volume anomalies, and rejection candles into resistance. But I won’t just be relying on the BTC chart alone. I’ll be stacking confluences from other key indicators too — USDT.D, BTC.D, macro risk indicators, and stablecoin flows — to confirm if this is truly the top or if there’s one more leg left in the tank.
Once the top does form, whether it's $138k or $160k or somewhere in between, I think we move into the distribution phase that begins the next macro downtrend. The next few years will be about preservation and accumulation again, and I’m already eyeing zones like $49k and below as potential long-term HTF demand levels when that time comes.
For now, we’re in what I believe is the final bullish leg of this cycle. I’m positioned, prepared, and watching closely for signs of exhaustion as we move into this zone of confluence.
Let the market do its thing — just make sure you’ve got a plan for when the music stops.
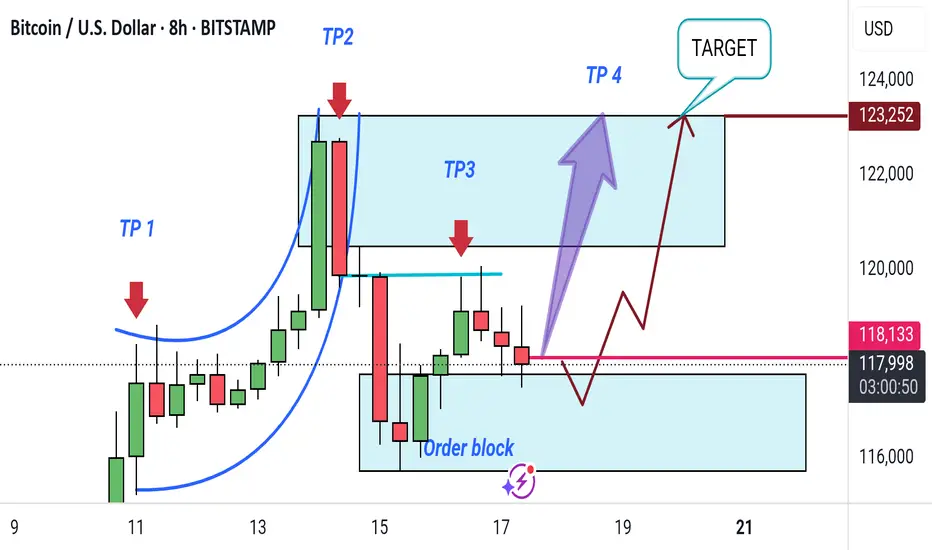
"Bitcoin Bullish Reversal Setup with Target Zones (8H Chart)"This 8-hour Bitcoin/USD chart shows a potential bullish setup. Key takeaways include:
Order Block: Identified support zone for possible reversal.
TP1 to TP4: Target points for profit-taking as price moves upward.
Target Zone: Final target area near $123,252.
Expected move: A short-term dip into the order block, followed by a rally toward the target zone.
BTC Next Move within 11-15 DaysBTC will hit $62,528.74 Within 11-15 Days
The historical trend suggests that once Bitcoin (BTC) surpasses the $50,000 threshold, it typically enters a bullish phase, experiencing significant gains. This observation is based on past market behavior, where crossing this key price point has often led to increased investor confidence and subsequent price surges.

BTCUSD Long📈 Scenario Outlook:
Bias: Bullish
Preferred Play: Long setups are favorable as long as price holds above 116,600 demand.
BTC is expected to push through the intermediate supply zones and potentially attempt a full retracement toward the previous CHOCH high at 123,231.
📌 Key Zones ("Your Borders"):
🟢 Demand Zone (Support)
Zone: 116,600 – 117,600
This is a well-marked reaccumulation zone, aligned with previous demand and the CHOCH origin. Price respected this level multiple times, showing it as a valid base for long entries.
As long as BTC holds above this zone, the bullish thesis remains valid.
🔴 Supply Zones (Resistance Targets)
First Supply: 119,000 – 120,000
Aligned with the 50% retracement level (11964.22) from the previous high to low swing.
Expect short-term reaction here; however, this level may not hold if momentum continues building.
Upper Supply Zone: 121,500 – 123,200
This is the final major resistance before revisiting the previous high at 123,231.
A sweep or rejection from here could form a double top or distribution structure, depending on macro factors and volume.

THAT WHAT YOU NEED TO KNOW ABOUT BTC IN 2025Professional Technical Analysis & Trading Plan for BTC/USD (Hypothetical 2025 Data)
---
1. Technical Structure & Key Observations
A. Price Context:
- **Current Price:** ~84,197 (below SMA 81,998).
- **SMA (Simple Moving Average):** 81,998 (likely 200-day SMA, acting as dynamic resistance).
- **Volume:** 52K (low volume suggests consolidation; watch for spikes to confirm breaks).
C. Key Levels (From Data):
- **Resistance:**
- Immediate: 81,998 (SMA).
- Major: 90,000, 100,000, 130,000 (swing highs).
- **Support:**
- Near-term: 74,000 (psychological),
---
2. Advanced Indicator Analysis
A. Momentum (RSI & MACD):**
- **RSI (14):** Likely near 40–45 (neutral-bearish zone). A break below 30 signals oversold; above 55 confirms bullish momentum.
- **MACD:** Bearish crossover possible (signal line above MACD line). Watch for reversal above SMA.
B. Volume Profile:
- **Low Volume (52K):** Indicates weak participation. A surge above 100K on a breakout/breakdown would validate direction.
- **Volume-Weighted Average Price (VWAP):** If price trades above VWAP, bullish bias strengthens.
---
3. Trading Strategies
Scenario : Bullish Reversal (30% Probability)
- **Trigger:** Daily close above SMA (81,998) with volume >100K.
- **Entry:** Long at 74,500 (confirmation of strength).
- **Targets:**
- TP1: 90,000 (8.5% move).
- TP2: 100,000 (19% move).
- **Stop Loss:** 71,500
---
5. Sentiment & Catalyst Watch
- **Bullish Catalysts:** Institutional ETF inflows, Fed rate cuts, Bitcoin halving momentum.
- **Bearish Risks:** Regulatory crackdowns, exchange hacks, macro recession.
-Conclusion
BTC/USD is at a critical juncture. *Trade the SMA break/breakdown with volume confirmation*, and prioritize risk-reward ratios. Always cross-verify with real-time data and news.
Disclaimer: Hypothetical analysis for educational purposes. Not financial advice.* 🚀

BTCUSD - Exhausted? Second time rejected, now down.BTCUSD got rejected at the Centerline the second time. This is super bearish. If it's closing below yesterdays low, that's a clear short signal to me.
Taking 50% gains off the table is never bad. Because then you still have 50% if it's going up further. Otherwise, you got 50% booked.
Don't let gree eat your brain §8-)

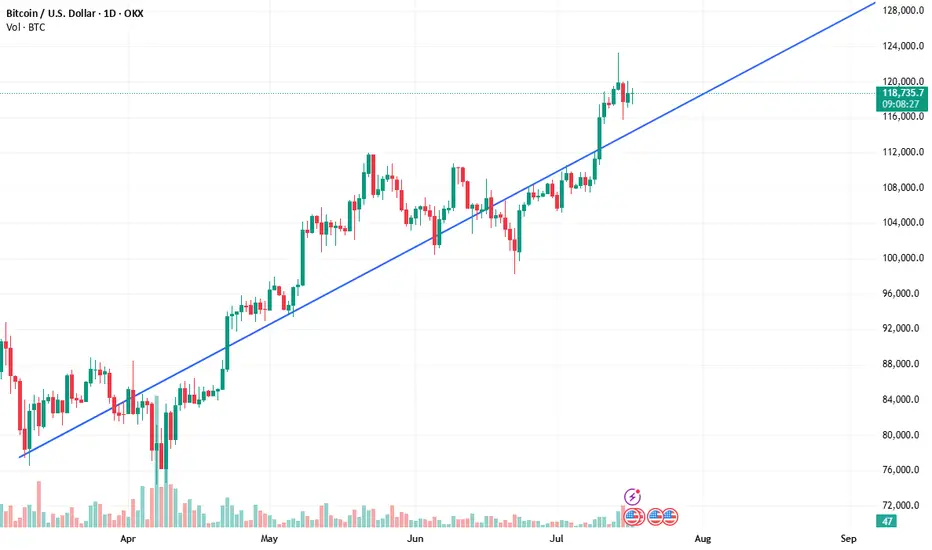
BTC seems to be following this trendline at the momentThe market seems to be buying and selling above and below this trendline
BITCOIN I am short 121,600The chart posted is my work in Bitcoin I am short using the Blackrock Etf in PUTS 70strike

BTCUSD Bullish Continuation Patterns on LTFThe trend is still bullish and the daily bull flag I posted is still at play. This is just a lower TF perspective within the bigger overacharching view.
Inverse head and shoulders and a bullish flag all indicate continuation to the upside. You can use market structure to confirm your entries and your target profit zones if you do not plan on holding until $150k
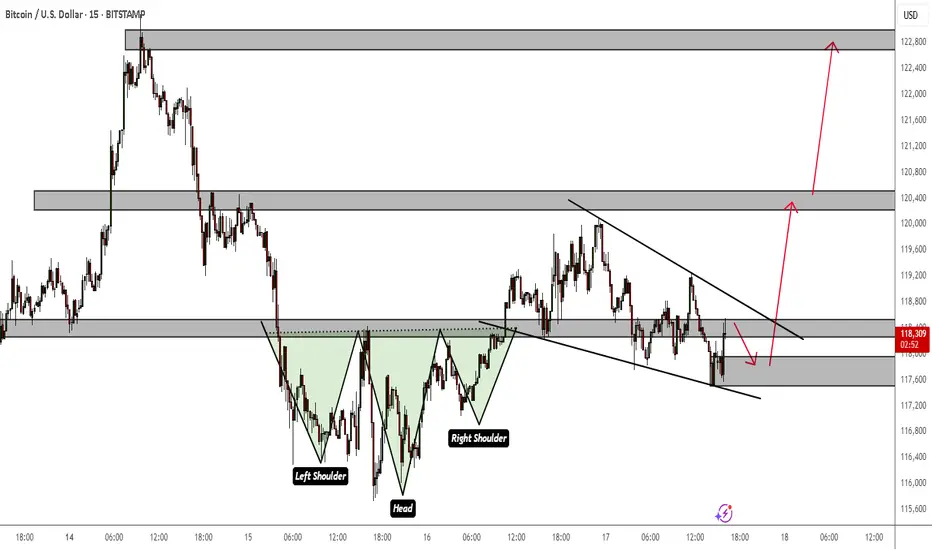
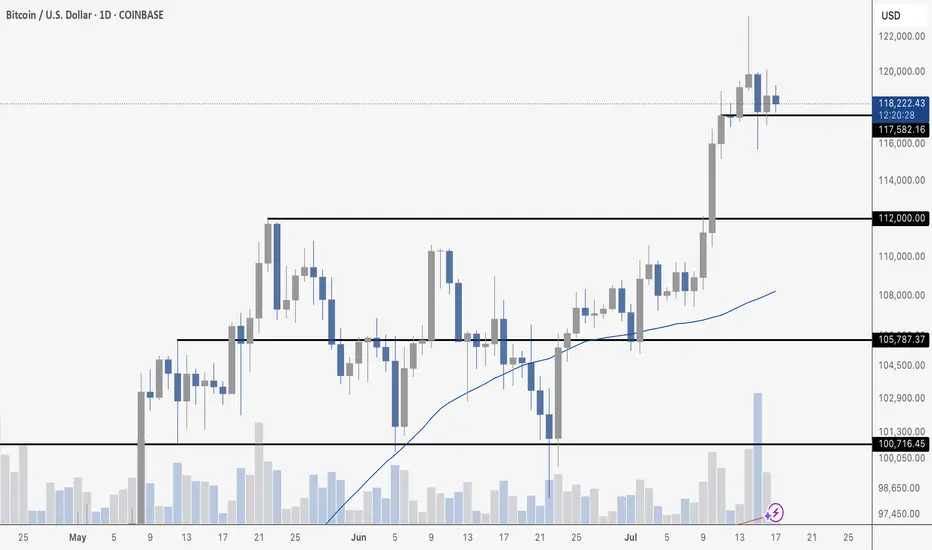
BTC CONSOLIDATESBitcoin is consolidating just below \$120,000 after Tuesday’s sharp pullback – which came on the highest daily volume since the \$74,000 bottom in March – mostly driven by selling. Despite the pressure, price held support cleanly at \$117,582 and continues to range tightly, suggesting healthy consolidation after a strong breakout above \$112,000. As long as \$117,582 holds, the structure remains bullish. A close above \$120,000 could ignite the next leg higher.
Bitcoin Bitcoin
Did a High of 1,22,000 could not Sustain
Moved below 1,20,000
Moved below 1.18.000
Shorts can be intiated once below 118000 for level of 117000 - 116000 -114000
shall become negative once below 110,000
BTCUSD shortFor the rest of the week I think we will se more bearish action in BTCUSD. After a 5 wave drop we´ve just created a corection for another 5 wave move. On lower timeframe we´re in a ABC correction and fall bewow the 200EMA.