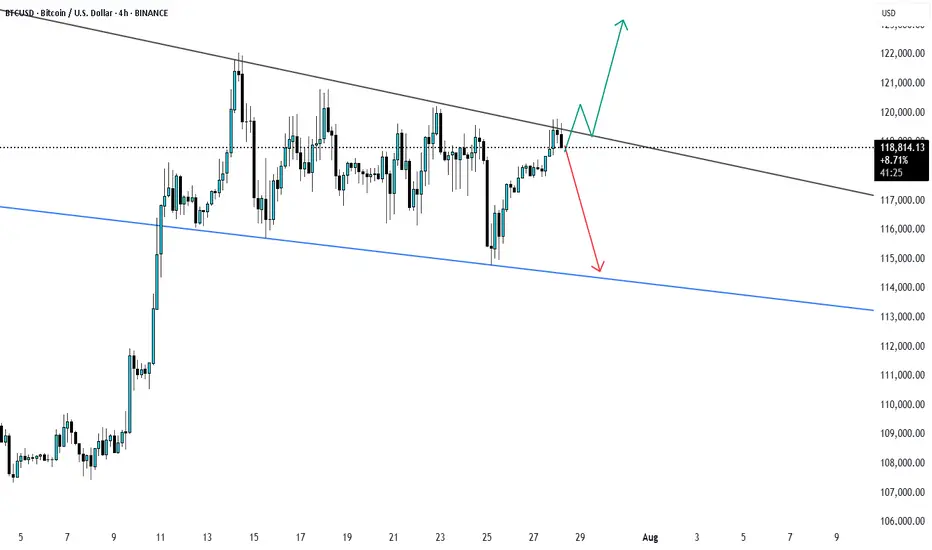
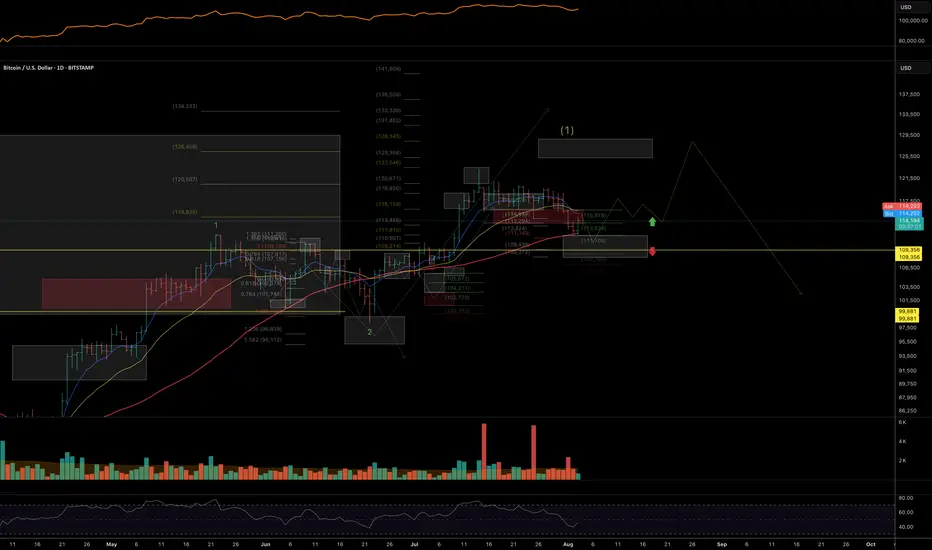
Bitcoin long again from 114k.Got stopped from the previous long , seems like btc wanted to sweep these 4h lows and continue higher .
Lets wait and enjoy the show in the upcoming months.
BITCOIN trade ideas

BTCUSD Technical Analysis (Smart Money Concepts) BTCUSD Technical Analysis (Smart Money Concepts)
Market Structure Overview:
Break of Structure (BOS) observed multiple times confirms a strong bearish trend.
Change of Character (CHoCH) around 30th July indicated initial shift from bullish to bearish intent.
Price has been forming lower highs and lower lows, respecting the bearish structure.
Key Zones:
🔴 Previous Resistance Zone (119,000 - 120,500)
Strong supply area from where price sharply reversed.
Also aligned with a Strong High marked at ~$120,000 – key for any future bullish invalidation.
🟫 Current Target Zone – 116,000
Acts as an immediate imbalance fill/FVG retracement zone.
Target highlighted as potential retracement point before continuing lower.
🟦 Liquidity / Fair Value Gap (FVG) Zone
Located between ~115,800 and 114,500.
Price may aim to revisit this zone on pullback, filling inefficiencies.
🟩 Support Zone (~113,000)
Price currently reacting near this zone.
This area has acted as a demand zone in the past and is expected to provide short-term support.
Volume Profile & Order Flow:
Visible Range Volume Profile shows heavy activity near the resistance cluster, indicating strong distribution by institutional players.
Low volume in the FVG area further confirms inefficiency and potential for a retracement move.
Smart Money Perspective:
The current structure reflects distribution at highs, followed by markdown phase.
Price swept liquidity below local lows and may now seek to mitigate previous supply or FVG around 116,000 before resuming bearish trend.
📌 Conclusion:
Bias: Bearish until 116K is tested and rejected.
Next Move Expectation: Possible liquidity sweep → bounce to 116K → short continuation.
Invalidation Level: Break and close above 117K would signal strength returning.
✅ Educational Note:
This is a classic Smart Money trap setup — liquidity grab near lows, fakeout pump to FVG, and potential short continuation. Traders should be cautious of fake rallies into known supply zones.

BTC-M2 / Cycle End?Do you see what I am seeing? It appears that M2 is significantly dipping at the end of September. I'd bet my BTC that will be the cycle ending. Remain vigilant!
Bitcoin to $116K in a Week? Here's the Case Everyone's IgnoringI know it sounds wild — but hear me out.
BTC is primed for something massive, and the ingredients are all on the table:
✅ ETF inflows are quietly stacking
✅ Supply shock post-halving is still underestimated
✅ DXY weakening = flight to hard assets
✅ Global uncertainty = Bitcoin safety bid
✅ Technicals pointing to a breakout above ATH with no resistance until $100K+
We're seeing the early signs of parabolic structure forming — and if volume confirms, this could move fast. Everyone thinks a 2x in a week is impossible... until it isn't.
Not saying it’s guaranteed — but if you've been around long enough, you know BTC doesn’t move linearly.
👀 Watch the $72K breakout zone closely. If it flips with conviction and volume, $116K is not out of the question.
Drop your charts. Agree or disagree?
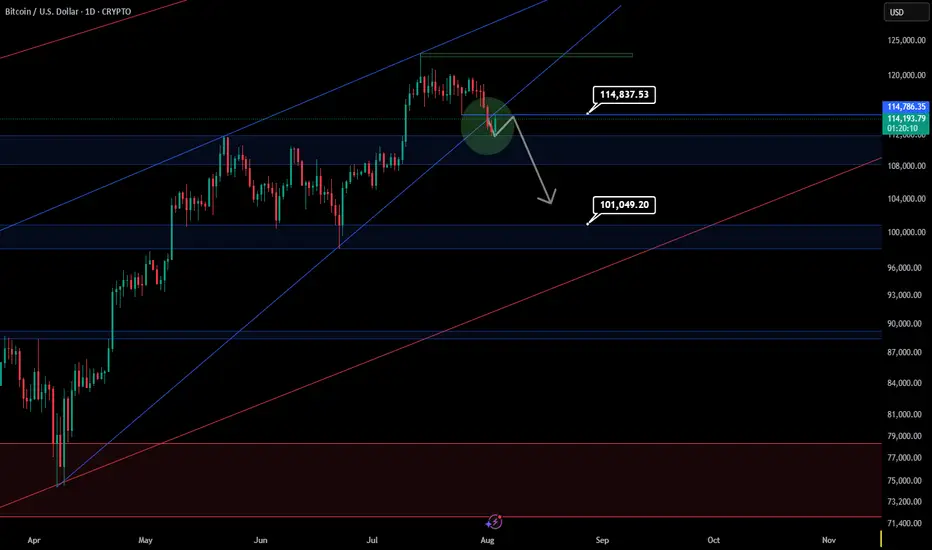
BTCUSD – Heading Towards Lower Support?Hello everyone, what are your thoughts on BTCUSD?
BTCUSD is currently trading around 113,92, moving within a clear downward price channel. It seems like the price could continue to decline as the coin moves toward the lower boundary of the channel.
If conditions remain favorable, I expect 110,000 to be tested in the short term.
What do you think? Do you expect BTCUSD to keep heading lower, or will it bounce back? Let me know your thoughts below!

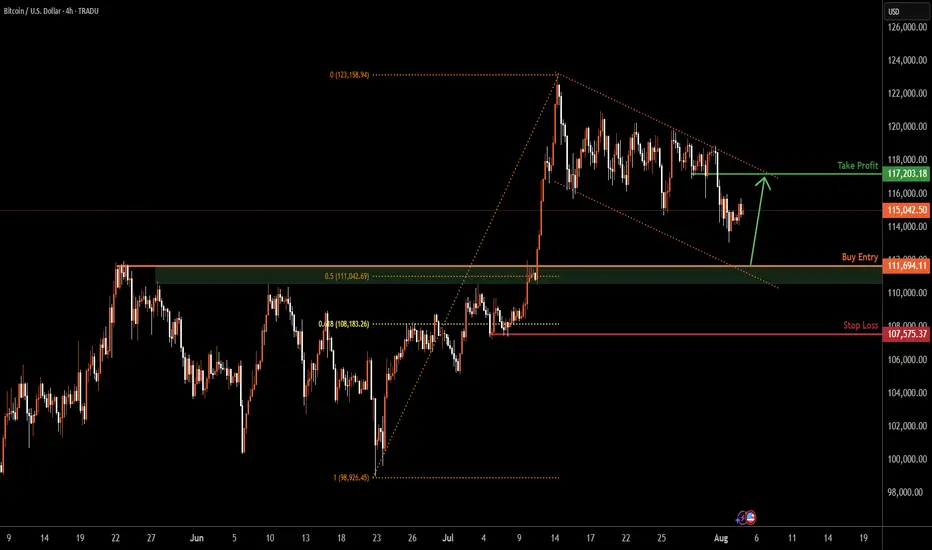
BITCOIN H4 | Bullish bounce offBTC/USD is falling towards the buy entry, which is a pullback support that is slightly above the 50% Fibonacci retracement and could bounce from this level to our take profit.
Buy entry is at 111,694.11, which is a pullback support that is slightly above the 50% Fibonacci retracement.
Stop loss is at 107,575.37, which is a pullback support that is slightly below the 61.8% Fibonacci retracement.
Take profit is at 117,203.18, which is a pullback resistance.
High Risk Investment Warning
Trading Forex/CFDs on margin carries a high level of risk and may not be suitable for all investors. Leverage can work against you.
Stratos Markets Limited (tradu.com ):
CFDs are complex instruments and come with a high risk of losing money rapidly due to leverage. 65% of retail investor accounts lose money when trading CFDs with this provider. You should consider whether you understand how CFDs work and whether you can afford to take the high risk of losing your money.
Stratos Europe Ltd (tradu.com ):
CFDs are complex instruments and come with a high risk of losing money rapidly due to leverage. 66% of retail investor accounts lose money when trading CFDs with this provider. You should consider whether you understand how CFDs work and whether you can afford to take the high risk of losing your money.
Stratos Global LLC (tradu.com ):
Losses can exceed deposits.
Please be advised that the information presented on TradingView is provided to Tradu (‘Company’, ‘we’) by a third-party provider (‘TFA Global Pte Ltd’). Please be reminded that you are solely responsible for the trading decisions on your account. There is a very high degree of risk involved in trading. Any information and/or content is intended entirely for research, educational and informational purposes only and does not constitute investment or consultation advice or investment strategy. The information is not tailored to the investment needs of any specific person and therefore does not involve a consideration of any of the investment objectives, financial situation or needs of any viewer that may receive it. Kindly also note that past performance is not a reliable indicator of future results. Actual results may differ materially from those anticipated in forward-looking or past performance statements. We assume no liability as to the accuracy or completeness of any of the information and/or content provided herein and the Company cannot be held responsible for any omission, mistake nor for any loss or damage including without limitation to any loss of profit which may arise from reliance on any information supplied by TFA Global Pte Ltd.
The speaker(s) is neither an employee, agent nor representative of Tradu and is therefore acting independently. The opinions given are their own, constitute general market commentary, and do not constitute the opinion or advice of Tradu or any form of personal or investment advice. Tradu neither endorses nor guarantees offerings of third-party speakers, nor is Tradu responsible for the content, veracity or opinions of third-party speakers, presenters or participants.
BTC - THIS IS THE END !?I didn’t want to jump to conclusions, so I waited for the NY open to see how the market would react — and so far, things don’t look bad at all. 🤔
Yeah, that previous-week correction wasn’t fun, but honestly, it’s perfectly healthy price action.
Thanks to that sharp drop, #Bitcoin managed to:
✅ Fully close the CME gap ;
✅ Fill a pretty large FVG ;
✅ Cleanly retest the previous high ;
✅ Perfectly touch the 50-day MA — which has historically sparked solid moves.
Sure, it was unpleasant. Sure, things didn’t go exactly as planned. 🤷♂️
But is this the end? Absolutely not. We haven’t even reached any of the typical panic points yet.
I think on the LTF we’ll dip once more to shake out early longers — then we’ll continue upward. 🐋

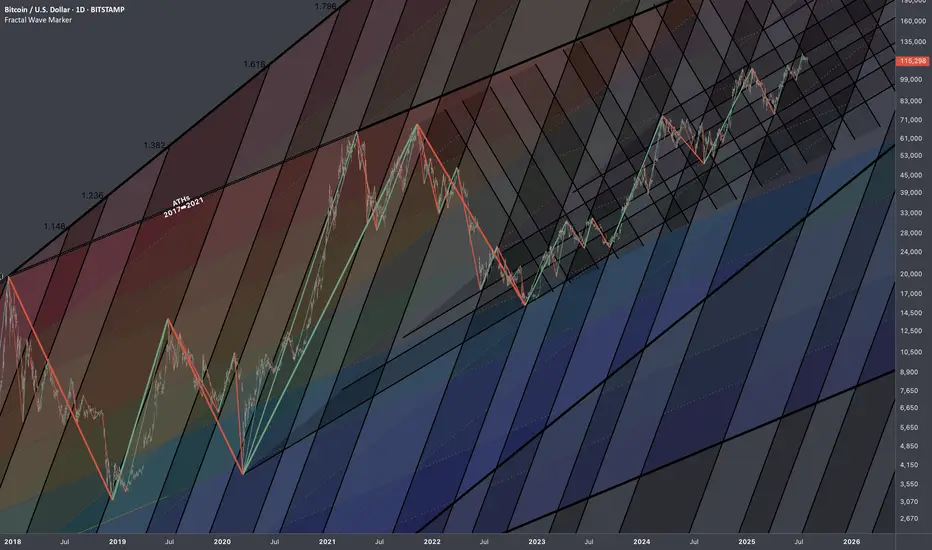
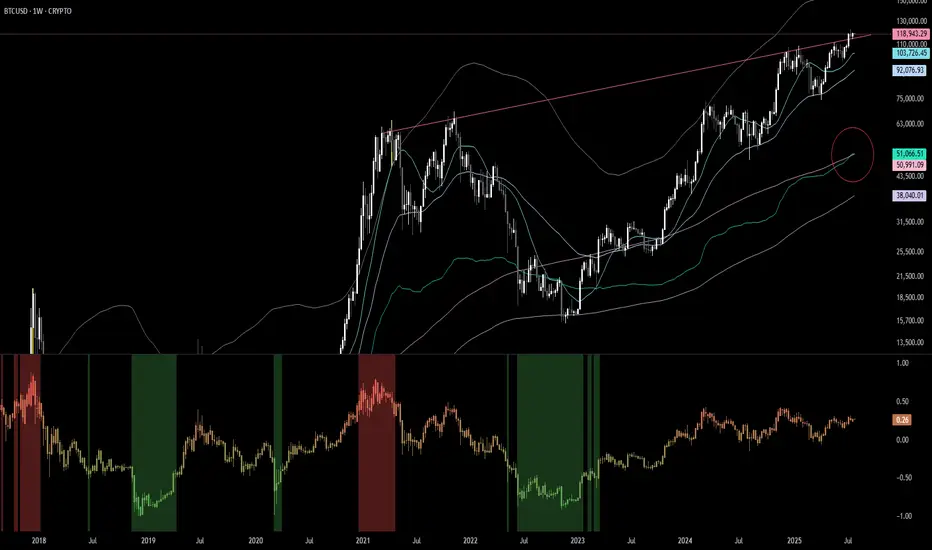
Bitcoin: Interconnections Rewired🏛️ Research Notes
Keeping fib channel of the rising trend angles as they've number of times covered well that aspect of cycle texture.
The other frame of reference would be with fib channel that covers drop from 2021 ATH to late 2022 bottom.
Last bit would be integrating fib channel discovered while ago that connects covid & late 2022 bottoms
Together they create a framework that addresses the complexity and makes even the most chaotic price movements seem to be a part of structural narrative.
BTCUSD Possible scenario BTCUSD is trading in range bound way and soon may breakout of again go down. Enter buy only on breakout and retest til then bearish will continue.
Bitcoin Short SetupHi everyone.
In Bitcoin 1H TF we have a CHoCH followed by a BOS and a pullback, I think it is possible the price meet this area and then continue to go down...
Let's see what happens...
Good luck

BTCUSD – Retest of Key Support at 111,900After setting a new all-time high at 123,229.00, BTCUSD has pulled back and is currently reacting to the 111,900.00 support area. This level aligns with prior structure and may provide a short-term floor if bullish momentum returns.
Support at: 111,900.00 🔽 | 100,622.00 | 87,589.00
Resistance at: 116,190.00 🔼 | 120,011.00 | 123,229.00
🔎 Bias:
🔼 Bullish: Price must hold above 111,900.00 and reclaim 116,190.00 to set up for a potential retest of the all-time high.
🔽 Bearish: A breakdown below 111,900.00 opens the door for deeper correction toward 100,622.00 and 87,589.00.
📛 Disclaimer: This is not financial advice. Trade at your own risk.

BTC/USD has formed a symmetrical triangle pattern on the 1-hour Price has broken downwards from the consolidation zone, signaling potential bearish momentum. If selling pressure continues, the projected target aligns with the measured move from the pattern’s height, indicating a possible decline toward the next major support zone. Traders should monitor volume for confirmation and manage risk accordingly.


BITCOIN Swing Long! Buy!
Hello,Traders!
BITCOIN went down from
The highs but a strong support
Level is below around 112k$
So after the retest we will be
Expecting a local bullish rebound
Buy!
Comment and subscribe to help us grow!
Check out other forecasts below too!
Disclosure: I am part of Trade Nation's Influencer program and receive a monthly fee for using their TradingView charts in my analysis.

BTC/USD 1D Chart 🔼 Resistance:
• USD 123,263 - local peak, strong resistance (green line)
• USD 119,120 - level tested several times, recent reflection
• 116,224 USD - zone of previous consolidations
🔽 support:
• 110,945 USD - SMA #2 (movable average), tested in the past
• 107,804 USD - local hole
• USD 103,542 - strong support from the past (historical retention of declines)
⸻
📊 Technical indicators
📉 Trend:
• The yellow upward trend line has been broken - a potential bull weakness signal.
• The candle pierces the trend line from the bottom - it is possible to change the direction to a side or downward trend.
📈 Medium walking (SMA):
• The red SMA #1 line acted as dynamic resistance.
• The price is currently testing SMA #2 as support.
• SMA #5 (blue, approx. 98,600 USD) is very strong long -term support.
📉 Macd:
• The MacD line is below the signal line → Bear signal (Bearish).
• Red histogram - inheritance impetus is growing.
📉 RSI:
• RSI has fallen below the level of 50 → the advantage of supply.
• Currently, it is approaching the supply of supply overload (<30), which can herald the technical reflection.
⸻
🔮 Scenarios
✅ Scenario Bycza (Bullish):
• Maintenance of a price above 110.945 USD (SMA #2).
• Return above the trend line or testing USD 116,224 and piercing up.
❌ Bear scenario (Bearish):
• Loss of support to 110.945 USD → decrease to USD 107,800.
• If this does not keep the course, the next strong level is USD 103,500.
⸻
🧠 Applications:
• Short -term: the market looks weak, the candle breaks the upward trend.
• Medium -term: still in the game, but if it does not reflect from the current levels, a greater correction is possible.
• Commercial decisions: It is worth waiting for confirmation of the direction (reflection from support or continuation of declines).

BTC at Make-or-Break: Rejection or Liftoff to $130K?
Bias/Summary
BTC is at a critical zone between 109K–112K. Price is currently showing hesitation after initial rejection at the Yearly L3 (112K), and I’m leaning short unless we see a strong breakout and hold above that level. However, if bulls reclaim it, we could see a fast move to 130K before many can react.
Technical Context:
Yearly L3 sits around the $112K zone – a historically significant level.
Price faced rejection at $112K and is now hovering near $109K.
Lower timeframe showing indecision, possible bearish bias.
Watching for:
Rejection + lower high below $112K = short setup.
Clean breakout + retest of $112K = shift to long bias.
Trade Idea / Setup:
🟥 Scenario A – Short Bias (Current Leaning):
Entry: 110K–111.5K (if rejection confirms)
Stop Loss: Above 112.5K
Targets:
TP1: 104K
TP2: 99K
TP3: 94K
R:R: Up to 3.5:1 depending on entry and target
🟩 Scenario B – Breakout Long (Contingent Setup):
Entry: 113K+ (after breakout and solid retest)
Stop Loss: Below 111K
Targets:
TP1: 120K
TP2: 130K
R:R: ~3:1 or more if momentum confirms
Risk & Patience Reminder:
⚠️Let price lead. No breakout = no long. No clear rejection = no short. Wait for confirmation, and don’t force entries in the chop.
Patience > Prediction.
NFA. DYOR. Manage your risk.

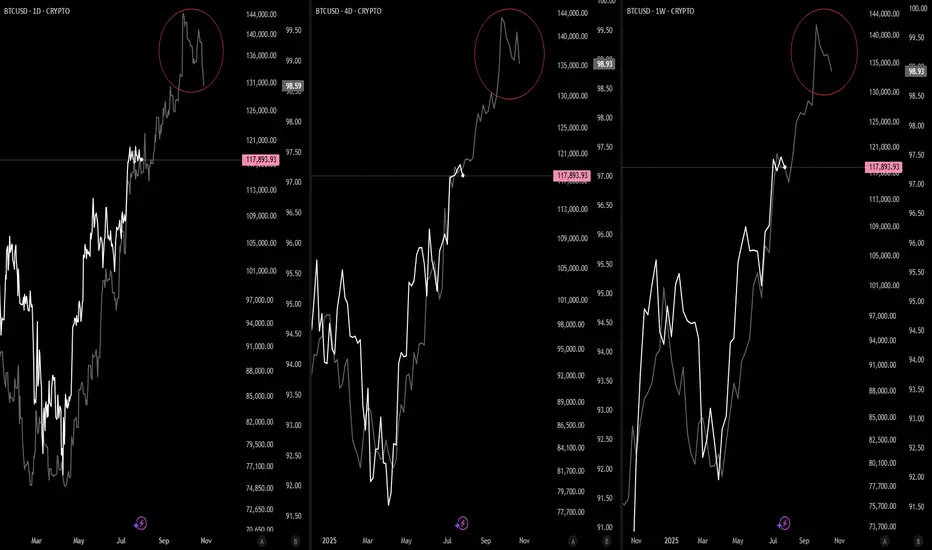
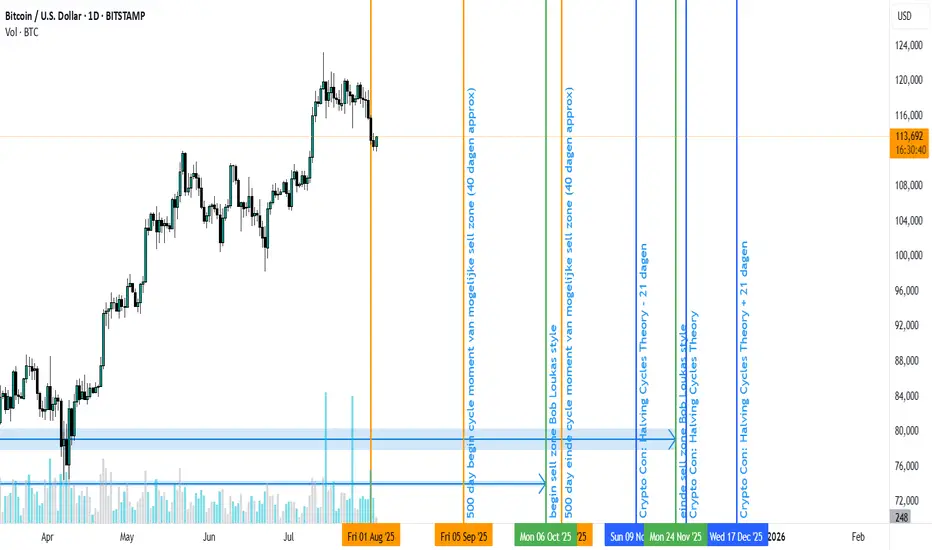
Next crypto/btc top timeframe according to different sourcesAccording to different sources the timing of the next crypto/btc top, could be as early as september 5th. See this chart for the different timeframes.
My current guess, if we get a rally towards $150k+ would be september/oktober.

Realized Price / 200 SMAThe realized price has crossed above the 200 SMA. The last time that this happened was November 2020. BTC then went on a tear in the following 90 days gaining 212%. Even if BTC gains only 50% of that 212% this time we will see the BTC price hit 250k.
We aren't bullish enough.
BTC Hits Premium Zone – Bearish Reversal Loading? BTC Hits Premium Zone – Bearish Reversal Loading?
🧠 Technical Breakdown:
🔹 1. Previous Market Structure & CHoCH
The chart shows a clear shift in structure (CHoCH) on the left, which marked the start of the bearish leg.
Break of Structure (BOS) confirms continuation of lower highs and lower lows until recent liquidity grab near the $112,551 zone.
Equal highs and liquidity above were taken out, making the move into the Premium Order Block zone highly significant.
🔹 2. Liquidity and Fair Value Gap (FVG) Zones
A major Liquidity + FVG zone was left unmitigated between $113,000–$112,000, and price is likely to revisit it.
This aligns with the target zone at $112,890, which is highlighted as a magnet for price to rebalance the inefficiency.
🔹 3. Order Block & Premium Supply Zone
A well-defined Order Block is marked just below the resistance zone near $115,166–$116,021.
Price is currently retracing into this zone, suggesting a potential reaction point for smart money to re-enter shorts.
Volume is expected to pick up here, and a reversal could initiate if price fails to break above this supply.
🔹 4. Volume Profile and Market Imbalance
Volume clusters are heaviest near the $114,000–$114,300 range, indicating high activity and previous accumulation/distribution.
Thin volume near the $112,551 zone further confirms price may drop quickly if rejection happens.
🔹 5. Support & Liquidity Sweep
Support zone around $112,551 is a previous liquidity pool and weak low that has not been fully cleared.
Price is likely to revisit this zone in the short term to clear liquidity and complete market rebalancing.
🔐 Institutional Narrative:
Smart money engineered a liquidity sweep to the downside, then caused a retracement into premium.
Now, BTC/USD is positioned in a high-risk zone where sell-side institutions may enter to push price lower.
If this order block holds, expect a rejection toward $112,890, followed by possible deeper continuation into the liquidity void below.
📌 Key Levels:
Level Price (USD)
Strong Resistance Zone 115,166 – 116,021
Order Block (Sell Area) 114,800 – 116,000 (approx.)
Immediate Support 113,000 – 112,551
Target (Liquidity Zone) 112,890
Weak Low (Final Sweep) 112,000
📉 Trade Outlook & Strategy:
🔺 If price reacts bearishly at Order Block:
Look for lower timeframe BOS/CHoCH confirmation.
Entry: Short on rejection at or near $115,000–$115,500
Target 1: $112,890
Target 2: $112,000 (extended liquidity sweep)
Stop-loss: Above $116,200 (invalidates bearish OB)
🔻 If price breaks and closes above $116,021 with momentum:
Structure flips bullish, and the OB is invalidated.
Look for long setups on retracement to $114,000 zone.
🧭 Conclusion:
BTC/USD is currently trading within a Premium Zone, testing a strong Order Block below key resistance. Price may face a bearish reaction, targeting the liquidity zone at $112,890. Smart money footprints suggest a potential trap for breakout buyers, and if momentum fades, we can expect a downside reversal to sweep remaining liquidity.

Altcoins and BTC: Macro Structures, Key Levels, and What’s NextIn this Sunday's market crypto-market analysis, I'm sharing trend structures and key support zones for the total altcoin market cap (excluding BTC and ETH), as well as for ETH, XRP, BNB, SOL, HYPE, and BTC. I also outline my main scenarios for market movement through the end of August and the rest of the year.
Key takeaways:
- Impulsive structures are shifting to diagonal structures — less stable and growth cycle is likly approaching the final phase of this market cycle.
- As long as prices hold above key macro support zones, the uptrend structure remains intact.
- I don’t rule out another sell-off early this week, deeper into support zones, followed by a potential rebound through late August, then a phase of consolidation (ideally staying above the current correction lows from the July top), and one final rally to new highs starting mid-autumn and continuing toward year-end.
-I expect ETH, XRP, and BNB to be the primary beneficiaries of the next wave of growth.
Total Altcoin Market Cap (Excluding BTC & ETH)
Support zone: 955-913B
Target resistance zone: 1.19-1.26T
BITSTAMP:ETHUSD
Support zone: 3400–3200 (possible extension to 3000)
Target resistance zone: 4300–5100+
BINANCE:XRPUSDT
Support zone: 2.7–2.5
Target resistance zone: 5.2+
BINANCE:SOLUSDT
Support zone: 170–150
Target resistance zone: 250–300
CRYPTO:HYPEHUSD
Support zone: 33–30
Target resistance zone: 60–72
BINANCE:BNBUSD
Support zone: 510–530
Target resistance zone: 960–1000
BTC Dominance
BITSTAMP:BTCUSD
Support zone: 111–109K
Target resistance zone: 125–130/135K
If you’d like me to cover a specific coin, leave a comment — I’ll include it in future updates or prepare a short video breakdown.
Thanks for your attention, and I wish everyone a strong start to the week and well-grounded investment decisions!
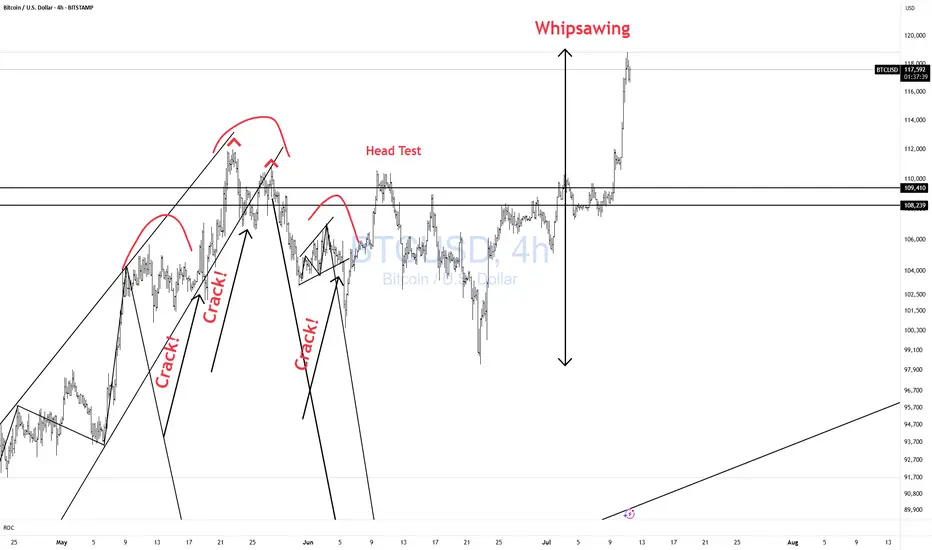
BTCUSD Whipsawing! CAUTION!Bulls CAUTION! Price is whipsawing all over the place.
Better to be out of the market wishing you were in than in wishing you were out!! Don't chase!!