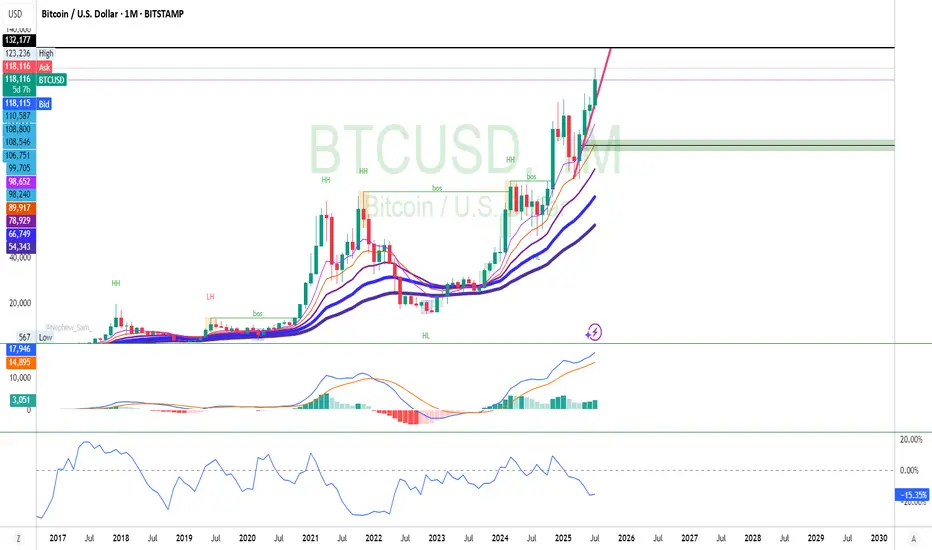
Bitcoin going up because of Cup and Handle!Bitcoin will continue to go up to finish it's measured move from the cup and handle chart pattern playing out. Looks like the text book image of a cup and handle. Lol. Perfection!
BITCOIN trade ideas
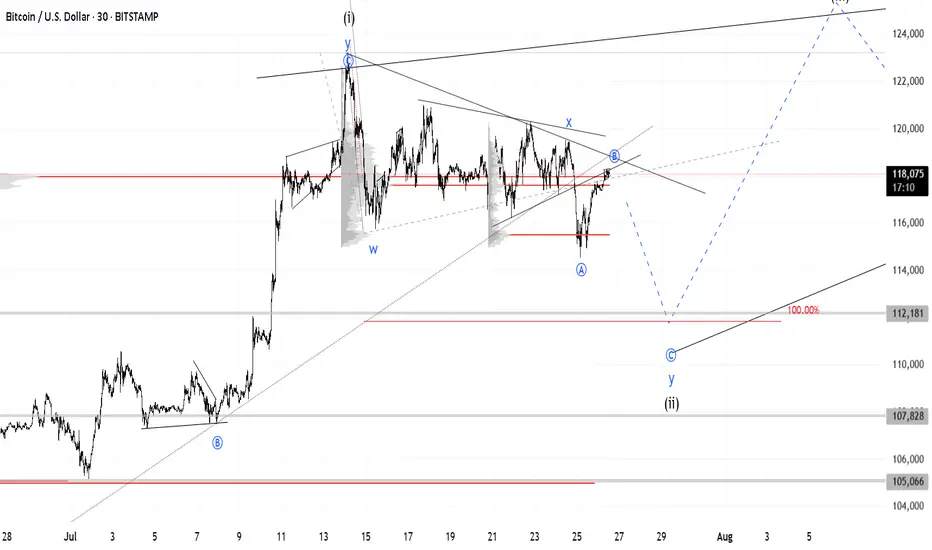
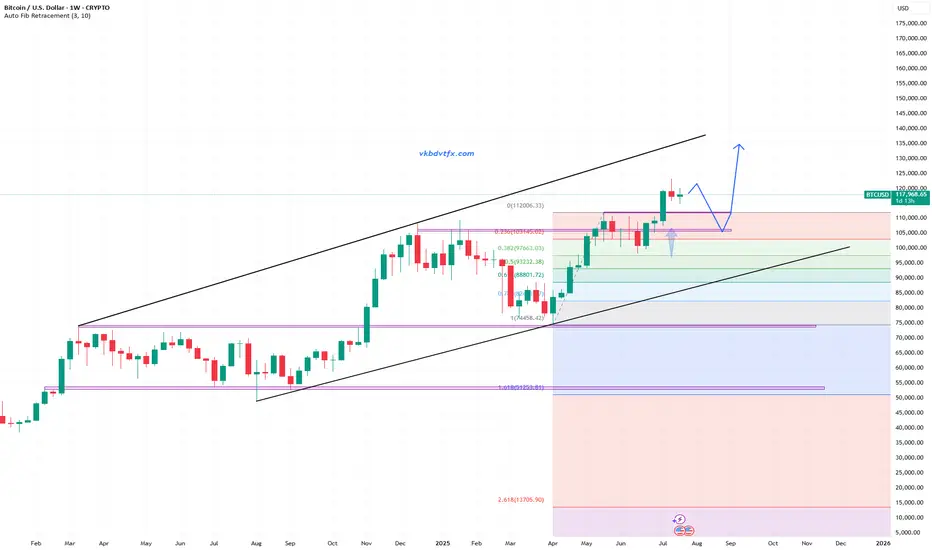
BTC at Multi-Factor Resistance: Wave Count Hints at Downside BTC is looking increasingly bearish as the price has risen to a resistance zone formed by multiple factors: trendlines, the POC (Point of Control), and moving averages.
The wave count also supports this bearish outlook / the bearish case.
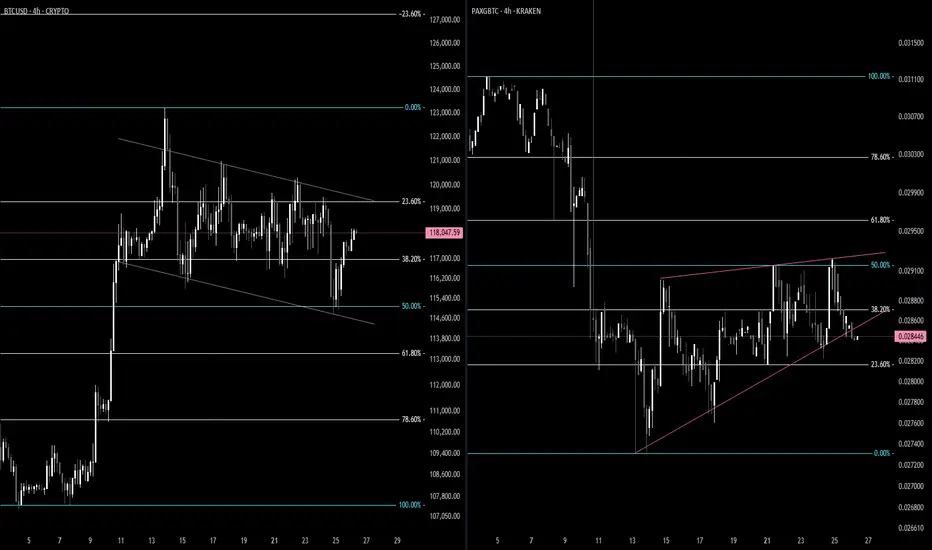
BTC / GOLDIt appears as though the 4H BTC chart has formed a bull flag vs Gold/BTC chart having formed a bear flag. This is VERY encouraging to see. Short term price target is 134-140. Strap in, BTC is a bout to do BTC things again.
BITCOIN Wait For Breakout!
HI,Traders !
#BITCOIN has formed a Bullish Wedge pattern
While trading in an uptrend As
we mentioned in a previous analysis
So we are bullish biased and
IF we see a bullish breakout
We will be expecting a
Further bullish move up !
Comment and subscribe to help us grow !

"Something’s cooking with BTC…"btc i think it's going up... not just 'cause the technicals look good, but 'cause big funds are already expecting crazy prices. blackrock, fidelity and others have mentioned btc at 150k or even 250k in a few years. and if they’re saying that, it’s not just talk... it’s 'cause they’ve got info most of us don’t.
plus, there’s less btc after the halving, and ETFs are scooping it up like crazy… you already know what that could mean.

Bitcoin Long: Completion of Sub-wave 4, riding wave 5I updated the Elliott Wave counts for Bitcoin and we should have completed sub-wave 4 and is currently onto sub-wave 5. Based on my counts, sub-wave 3 has extended and is slightly more than 1.618x of wave 1, thus I expect sub-wave 5 to NOT extend. Based on Fibonacci extensions, the price target is around $124,600.
The stop loss for this idea is around $114,600.
Towards to end of the video, I zoomed out for Bitcoin and observed that Cycle level wave 1 and 3 are HUGE (red font) and the current Cycle Wave 5 looks too small. Thus, the entire 5-wave structure of what we are going through now may be just a Sub-Wave 1 of Cycle Wave 5. And that means that longer-term, Bitcoin may really go to $200,000 and beyond. But for traders, keep our foot on the ground and trade what is in front of us.
Good luck!

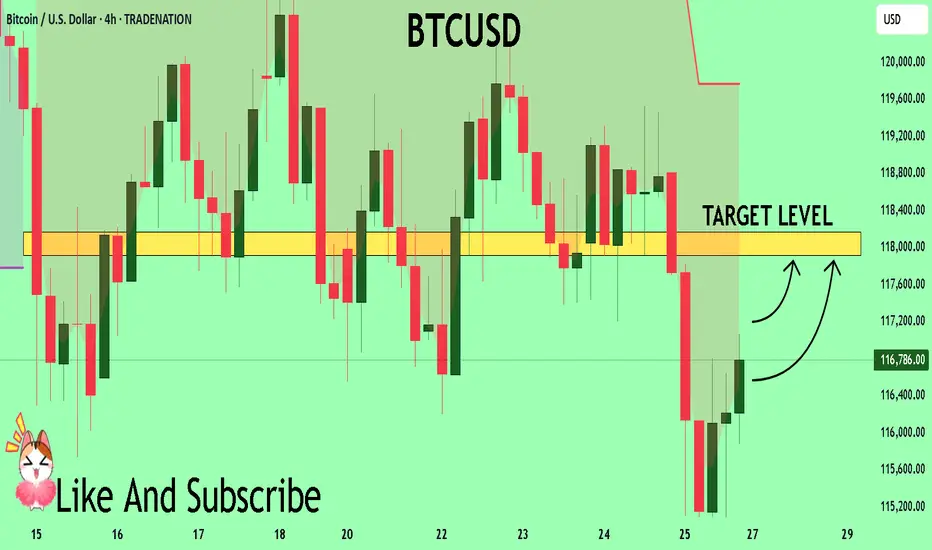
BTCUSD What Next? BUY!
My dear friends,
Please, find my technical outlook for BTCUSD below:
The price is coiling around a solid key level - 11678
Bias - Bullish
Technical Indicators: Pivot Points High anticipates a potential price reversal.
Super trend shows a clear buy, giving a perfect indicators' convergence.
Goal - 11791
About Used Indicators:
The pivot point itself is simply the average of the high, low and closing prices from the previous trading day.
Disclosure: I am part of Trade Nation's Influencer program and receive a monthly fee for using their TradingView charts in my analysis.
———————————
WISH YOU ALL LUCK
4:1 R:R for BTCBulls are likely to send it higher before the 120K breakout. This early setup is worth a try.
Entry: 118,200
Stop-loss: 115,000
Target: 135,000
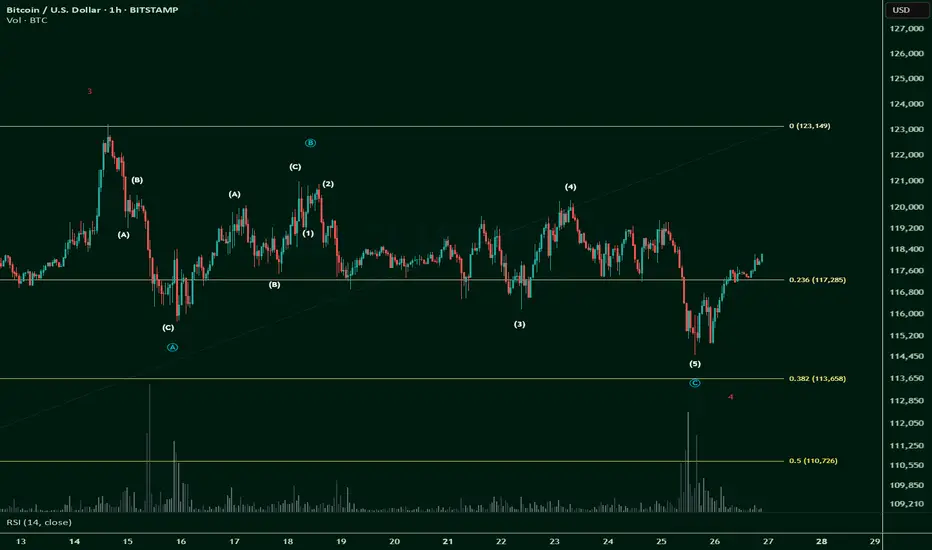
$BTC Wave 4 correction completed -- alternate count.This is not financial advice.
In my previous post, I suggested that Minor Wave 4 could go all the way down to 0.618 fib:
However, after doing a deeper dive into the long squeeze in the last day and looking at its recovery, I think CRYPTOCAP:BTC has completed its corrective Minor Wave 4.
This means that we're looking up towards an impulsive Minor Wave 5.
If Minor Wave 5 completes, in my bullish main Elliot Wave count, we would get a full picture for Intermediate Wave 1.
We would then be able to expect an Intermediate Wave 2 correction.
However, while Wave 2 usually corrects 0.618 fib, this time round, CRYPTOCAP:BTC has shown inclination and strength to correct between 0.236 and 0.328 levels.
And then we will be making that Impulsive Wave 3 up.
That will be bonkers.
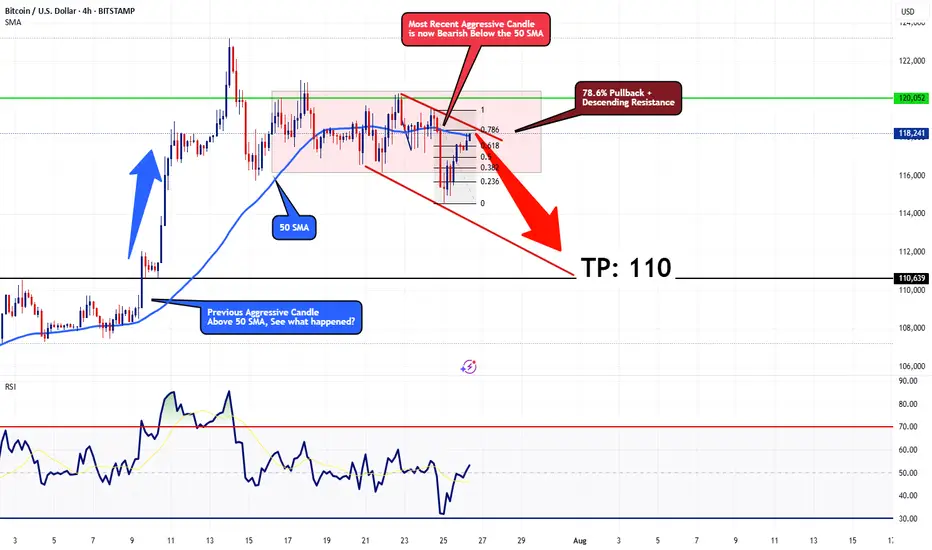
Bearish Outlook for BTCUSDOn the 4-hour timeframe, Bitcoin seems to be starting a corrective phase, likely moving toward the $110 mark. Current price action is facing resistance at a descending trendline, aligned with the 78.6% Fibonacci retracement level, which should limit any short-term upward moves. The price is also trading below the 50-period SMA, with a strong bearish candle from a few sessions back supporting the downward trend.
For a bullish outlook to take hold, Bitcoin would need to decisively break above the 78.6% Fibonacci level with a robust bullish candle closing above the 50 SMA. Until that happens, I remain bearish, with a target of $110.
This technical perspective aligns with the scenario where the Federal Reserve opts to maintain interest rates at 4.50% at this Wednesday's FOMC meeting
Stay cautious and trade wisely!
ETH Soars $2.6B: Inside BBDelta and Cathie Wood’s Strategic BetIn July 2025, the Ethereum network witnessed an unexpected wave of withdrawals totaling over $2.6 billion in unstaked ETH — one of the largest single-month movements since Ethereum’s transition to proof-of-stake. While headlines suggested panic, BBDelta’s analysts and Ark Invest CEO Cathie Wood see a different narrative unfolding: one rooted in strategic portfolio rebalancing and maturing market behavior.
Beyond the Headlines: What the Data Really Shows
According to BBDelta’s internal chain analysis, over 842,000 ETH were unstaked across major validator pools including Lido, Rocket Pool, and Coinbase. However, contrary to expectations, there was no mass sell-off. In fact, more than 65% of unstaked ETH remained idle or were redirected to DeFi platforms such as Aave and Curve.
This distinction is crucial. “Unstaking doesn’t necessarily equal selling,” explains Anna Keller, Senior Market Strategist at BBDelta. “It reflects evolving investor preferences, where capital seeks higher yield or greater liquidity in anticipation of macroeconomic shifts.”
Cathie Wood concurs, stating in a Bloomberg interview, “Ethereum’s staking environment is beginning to resemble fixed-income markets. Institutional holders are unstaking not out of fear, but in search of more dynamic return models.”
Institutional Movements Driving the Shift
One of the primary drivers behind the recent wave appears to be institutional rebalancing. As yields on real-world assets (RWAs) and tokenized Treasury instruments improve, large crypto holders — including family offices and asset managers — are rotating exposure from static ETH staking to diversified yield strategies.
BBDelta’s research notes a spike in ETH deployment into liquid staking derivatives (LSDs) and restaking protocols like EigenLayer, signaling a pivot toward composable and flexible income mechanisms.
Moreover, geopolitical uncertainty and rate policy ambiguity continue to drive caution. “The macro backdrop — especially ongoing tensions around U.S. debt restructuring and eurozone contraction — is pushing capital toward adaptable on-chain positions,” Keller adds.
Cathie Wood’s Perspective: Strategy, Not Stress
Cathie Wood, whose firm Ark Invest holds significant ETH positions, argues the current trend mirrors broader crypto-market maturity. “Volatility remains, but the investor base is smarter,” she says. “What we’re seeing with this $2.6 billion movement is the normalization of active asset allocation in crypto.”
She draws parallels to traditional finance, where fixed-income investors routinely rotate holdings between instruments based on risk and duration. “Ethereum has reached a point where it can sustain a yield curve of its own — that's a sign of strength, not weakness.”
BBDelta’s Market Outlook
BBDelta expects a continued reshaping of Ethereum’s staking landscape, with less concentration in passive lockups and more emphasis on modular strategies. The firm predicts ETH will increasingly serve as a base asset in complex, multi-layered DeFi ecosystems — from restaking protocols to derivatives and real-world asset bridges.
In the near term, BBDelta projects moderate price consolidation around the $3,400–$3,800 range, driven by macro correlations with tech stocks and bond yields. However, the firm remains long-term bullish, citing Ethereum’s dominant position in smart contract execution, enterprise adoption, and regulatory clarity across the EU and Asia-Pacific.
Final Thoughts
The $2.6 billion Ethereum unstaking should not be misinterpreted as a crisis. Rather, as BBDelta and Cathie Wood both emphasize, it represents a milestone in Ethereum’s financial evolution. Sophisticated capital is optimizing exposure, not fleeing risk — and in that, the Ethereum ecosystem proves its readiness for the next institutional wave.

SharpLink Eyes 1M ETH Goal After $145M Deal as ETH Targets $4KIn a move that’s set to reshape the intersection of digital assets and sports betting, SharpLink Gaming Ltd. has announced a landmark $145 million acquisition of a global data and analytics firm, with the explicit goal of accumulating 1 million ETH over the next 24 months. The deal underscores growing institutional interest in Ethereum as a digital commodity, and may catalyze upward momentum as ETH inches toward the $4,000 psychological resistance level.
SharpLink, a technology company specializing in real-time conversion tools for online betting platforms, sees Ethereum not only as an asset but as a strategic reserve and infrastructure layer for future blockchain-native products in sports engagement.
ETH as a Strategic Reserve Asset
According to sources close to the deal, the target firm will integrate its decentralized transaction engine directly onto Ethereum Layer 2, allowing near-instant settlement for in-app microtransactions and loyalty systems. SharpLink executives confirmed that part of the transaction includes an ETH-based performance clause, further tying company equity to the appreciation of Ethereum itself.
“Ethereum is not just a vehicle for holding value—it’s a programmable platform that enables the gamification of loyalty, rewards, and even prediction markets,” said Robert Wheeler, CFO at SharpLink. “Our 1 million ETH target is a long-term bet on infrastructure, not speculation.”
Institutional Flows Signal Confidence
The acquisition comes amid surging Ethereum ETF inflows, with U.S.-based funds seeing over $453 million in net capital in July alone. As institutional allocations deepen, Ethereum’s price has responded, currently trading at around $3,730, up nearly 18% month-over-month.
Analysts believe that a clean break above $4,000 could lead to an accelerated rally toward new cycle highs, especially with the anticipated rollout of EIP-7623, a scaling-focused upgrade designed to enhance Layer 2 throughput.
Industry Implications
SharpLink’s strategy mirrors a broader trend where companies are building Ethereum exposure directly into corporate structure, treating ETH as both capital and infrastructure. This hybrid approach reflects a shift from speculative crypto adoption to utility-based asset management.
“It’s a new model of treasury allocation,” noted Mia Langston, digital finance strategist at Veridian Global. “They’re not just holding ETH as a hedge—they’re deploying it across services.”
Conclusion
With Ethereum’s fundamentals strengthening, growing ETF demand, and now a $145M acquisition tied directly to ETH accumulation, SharpLink’s move may serve as a case study in the next phase of corporate crypto strategy.
If ETH breaches $4,000 in the coming weeks, the company’s early positioning could prove prescient—and possibly spark similar strategic moves across sectors beyond crypto.

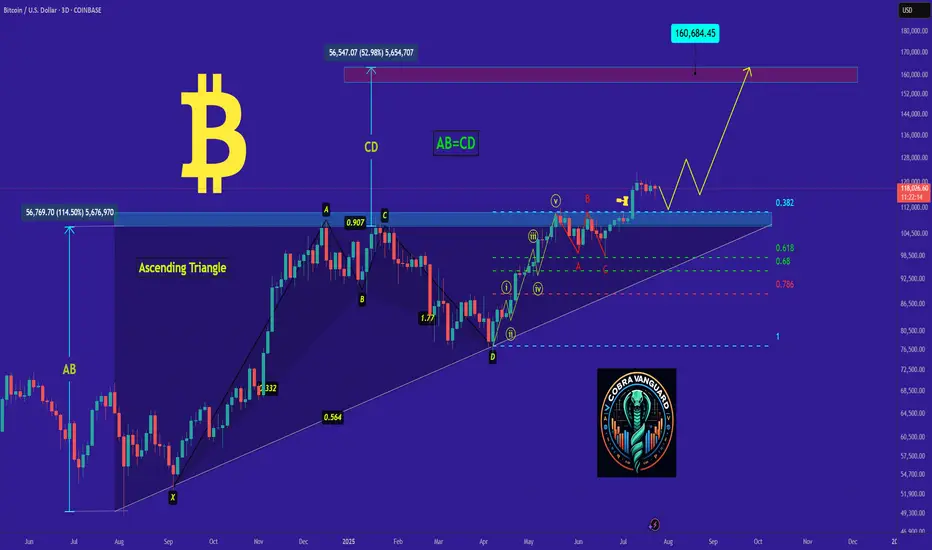
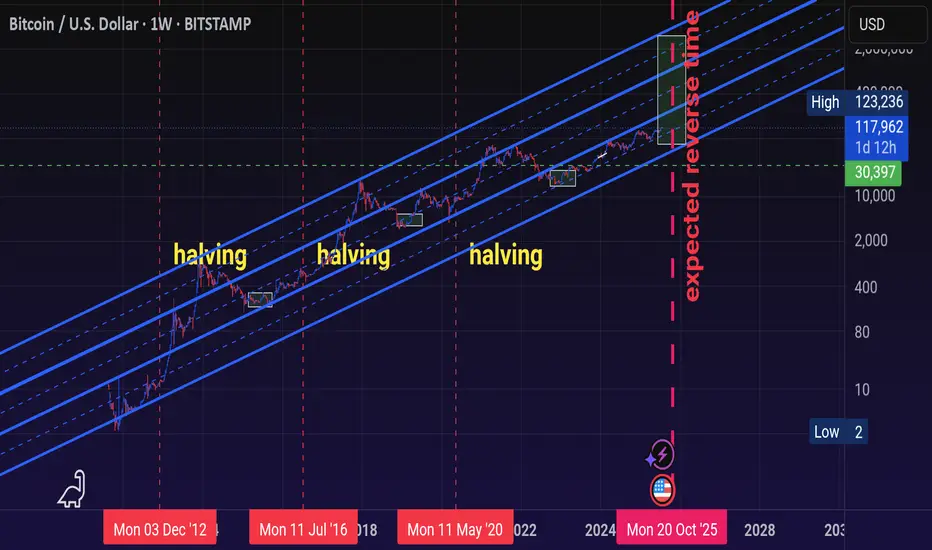
bitcoin- Time to buy again! (Update)As I said, Bitcoin broke the triangle, and now with a slight price correction, it could surge to $160,000, and you still think I'm joking!!
Previous analysis
Titanwhale: Interest in BTC reaches record high amid $115,000Bitcoin’s market volatility once again made headlines this week as its price dipped sharply to $115,000, marking the most significant single-week correction in nearly a year. Yet behind the price action lies a more telling development: open interest in Bitcoin futures reached an all-time high, crossing the $41 billion mark.
Analysts at Titanwhale emphasize that this dynamic reflects not panic but rather the growing institutionalization of crypto markets, where derivatives are used for strategic hedging and structured exposure.
Rising Open Interest Reflects Institutional Strategy
Despite the 12% price correction from recent highs of $131,000, institutional interest remains robust. Open interest on regulated platforms like the Chicago Mercantile Exchange (CME) surged 38% in Q3, accounting for over $9 billion of total volume.
“We’re seeing a clear shift from speculation to risk management,” said Ethan Ryu, Head of Macro Strategy at Titanwhale. “Derivatives are no longer just trading tools—they’re core components of institutional crypto portfolios.”
Leverage Risks and Market Maturity
The sharp price dip triggered over $1.2 billion in liquidations, particularly among retail traders using high leverage. Still, the overall market structure remains stable: funding rates are neutral, and the options market shows a moderate bullish bias for Q4.
“This is a textbook pullback in a bullish trend. Market structure suggests cooling—not capitulation,” Ryu noted.
Macro Forces and Bitcoin’s Outlook
The correction coincides with renewed inflation concerns and central bank uncertainty. Yet on-chain data from Titanwhale shows that long-term holders are not moving their coins, and exchange outflows suggest continued accumulation.
With the next Bitcoin halving in early 2026 and steady inflows into spot ETFs, analysts at Titanwhale maintain a base-case price recovery to $140,000–$150,000 by Q4 2025, assuming macroeconomic conditions stabilize.
Titanwhale’s Conclusion
The record-high open interest amid a price drop is not a contradiction—it is a sign of market maturity. Bitcoin is no longer just a speculative asset but a structural part of institutional risk strategies.
At Titanwhale, we view the current dip as a potential entry point for sophisticated investors—offering not just upside, but insight into how far the crypto market has evolved.

Is This the Ultimate Bullish Signal for BTC and XRP?In a market often driven by hype and volatility, identifying true bullish signals for digital assets like Bitcoin (BTC) and XRP can be elusive. Yet, a growing convergence of macro, regulatory, and structural market factors may now point to one of the strongest combined bullish setups for these two digital assets in recent memory.
While BTC and XRP differ significantly in purpose and infrastructure—Bitcoin as a decentralized store of value, and XRP as a bridge asset for institutional cross-border payments—they may be aligning in a way that reflects maturing investor confidence and long-term viability.
Institutional Flows Accelerate
Perhaps the clearest bullish indicator lies in the surge of institutional capital into regulated crypto products. Bitcoin ETFs have seen a resurgence in net inflows, surpassing $2.5 billion over the past 30 days, with increased allocations from pension funds and sovereign wealth managers.
At the same time, XRP’s recent regulatory clarity—following the 2023 U.S. court decision stating that XRP is not a security when traded on public exchanges—has prompted renewed interest from financial institutions exploring cross-border payment solutions.
“Regulatory clarity is acting like a springboard for XRP,” said Claire Donovan, Senior Markets Strategist at Atlantic Ridge Digital. “Meanwhile, Bitcoin’s macro narrative—scarcity in an inflationary world—continues to resonate.”
On-Chain Signals Strengthen
On-chain metrics reinforce the optimism. Bitcoin’s hash rate has reached an all-time high, a sign of miner confidence and long-term network security. Simultaneously, the percentage of BTC supply held by long-term holders (LTH) is now above 70%, suggesting strong conviction.
For XRP, active wallet growth and ODL (On-Demand Liquidity) transaction volumes have jumped significantly over the past quarter. According to data from Ripple, ODL volumes grew by 61% quarter-over-quarter—primarily driven by demand from Asia-Pacific and Latin American corridors.
“ODL is no longer experimental—it’s mission-critical infrastructure,” said Donovan. “The market is beginning to reflect that.”
Cross-Market Momentum and Retail Resurgence
Another potentially bullish alignment is emerging from the return of retail sentiment, driven by social media engagement, higher search volumes, and renewed interest in altcoins. XRP has reclaimed a top-5 position by market cap, while Bitcoin dominance remains stable despite an expanding altcoin market.
The macro backdrop also matters. With inflation stabilizing and rate cuts on the horizon in key economies, risk assets are enjoying renewed favor. Bitcoin and XRP, once viewed as speculative, are increasingly seen as part of a diversified portfolio strategy.
Final Thoughts
BTC and XRP may finally be entering a synchronized bullish phase—one rooted not in speculation, but in structural adoption and maturing market dynamics. While both assets face different headwinds, the combination of institutional inflows, regulatory clarity, and strong on-chain metrics may represent the ultimate bullish signal for the rest of 2025.
Investors would do well to watch not just price action, but the convergence of adoption, utility, and trust—elements that now increasingly support both Bitcoin and XRP.

Crypto Might Protect You from a Global Debt Crisis | OpinionAs sovereign debt levels surge and central banks struggle with inflationary aftershocks, investors worldwide are seeking new forms of financial protection. While gold and U.S. Treasuries have historically served as safe-haven assets, the current global debt structure presents unprecedented risks. In this context, cryptocurrencies — particularly decentralized, deflationary assets — may offer a unique hedge against systemic instability.
A Mounting Crisis
According to the IMF, global debt reached $315 trillion in Q2 2025, led by the U.S., China, and EU member states. Rising interest rates have pushed sovereign debt servicing costs to record highs. At the same time, inflation remains sticky, and fiscal deficits continue to expand — creating a scenario where traditional instruments may no longer preserve purchasing power.
Credit downgrades of major economies — including a recent warning from Moody’s on the UK and France — further highlight the fragility of fiat-based systems.
Why Crypto Provides an Alternative
Fixed Supply:
Bitcoin’s 21 million cap remains untouched. In an era of unlimited fiat printing, scarcity is a value proposition in itself.
Decentralization:
Cryptocurrencies operate outside centralized banking systems. In case of capital controls or currency devaluation, digital assets remain globally transferable and resistant to censorship.
Accessibility and Liquidity:
From stablecoins to DeFi protocols, crypto provides 24/7 access to financial tools — often with greater transparency than traditional banks.
Not Without Risk
Crypto remains volatile and vulnerable to regulatory shifts. The recent ETF delays by the SEC and tax crackdowns in G20 countries underscore the uncertain terrain. However, compared to the looming debt traps of fiat economies, some volatility may be an acceptable tradeoff for autonomy and deflationary exposure.
Growing Institutional Interest
Firms like Fidelity, BlackRock, and BBDelta have significantly increased their crypto allocations, particularly in ETH and BTC. Even central banks are researching CBDCs and holding digital reserves as a contingency plan.
Conclusion
While crypto isn’t a panacea, it represents a credible hedge in a world where fiat debt continues to spiral. For risk-aware investors, a balanced portfolio in 2025 likely includes a thoughtful allocation to digital assets — not for speculation, but for protection.
The debt crisis is not a distant threat. It’s unfolding now — and cryptocurrency may be one of the few tools with the potential to navigate what comes next.

BTCUSD BUBBLE ABOUT TO BURST LOL ??? SELL SELL SELLLong term BTCUSD looks like BIG PLAYERS ARE TAKING PROFIT (about to dump this to retailers lol)
I see 15m signal sell with very good risk reward
BTCUSD its ready for correction i dont beleave we will see any NEW HIGHS from here
Let see how will pay out, only time will tell
Thanks

BTC – Bulls still in controlBTC is trading around 117,800 USD, well above both the EMA 50 (111,800) and the pivot level (105,300), confirming bullish dominance. Price remains below the upper Bollinger Band (123,400), leaving potential room for continuation.
Momentum stays constructive, with RSI at 60 and MACD in a strong positive zone, reflecting sustained upward pressure. As long as price holds above EMA 50 and pivot, the next upside targets lie at 123,400 and R1 at 110,000 has already been surpassed.
Volume has dropped significantly (-31%), suggesting the latest move could lack conviction or represent a pause rather than a breakout.
As long as BTC holds above 111,800, the bullish scenario remains intact.
Watch for any rejection near 123,400 or a close back below the EMA as potential invalidation signals.

bitcoin technical chart movingwe are provide bitcoin next falling expected after big chance to buying level
Btcusd techinical analysis.Btcusd techinical analysis next move posibale at h1 time.not finchinal advice.

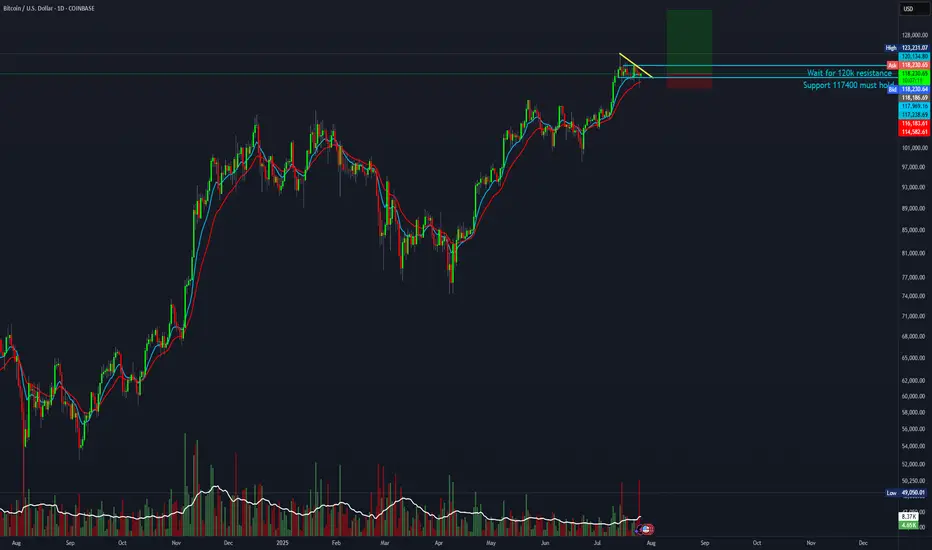
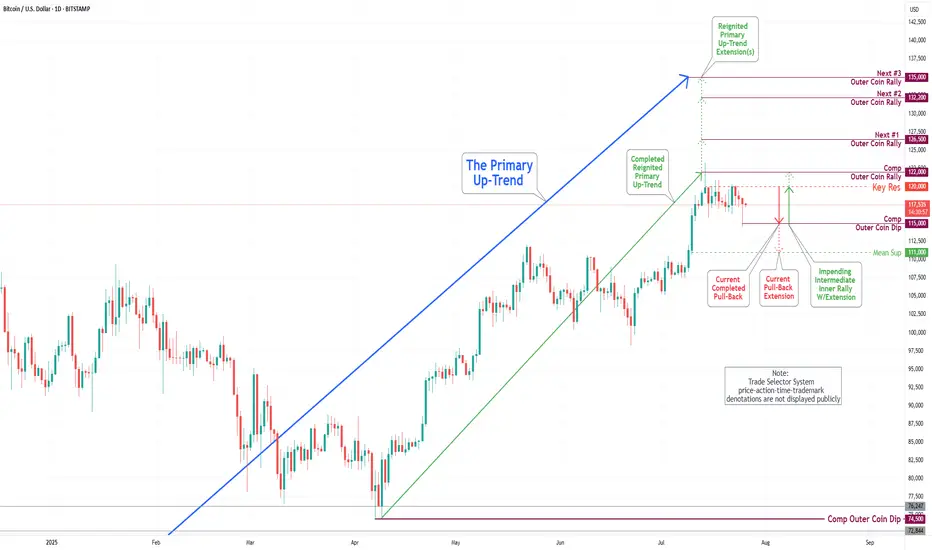
Bitcoin(BTC/USD) Daily Chart Analysis For Week of July 25, 2025Technical Analysis and Outlook:
In the trading session of the previous week, the Bitcoin market exhibited considerable volatility as it retested the Key Resistance level at 120000. On the lower end of the spectrum, the market engaged with the Mean Support levels at 117500 and 115900, culminating in the completion of the Outer Coin Dip at 115000. Currently, the coin is poised to retest the Key Resistance at 120000 once again. This anticipated rebound will necessitate a retest of the completed Outer Coin Rally at 122000. The additional target levels for the renewed Primary Up-Trend are 126500, 132200, and 135000.
BTC setup looks good for 5R.Looks like BTC is about to make another leg up toward 135K. Playing a 5:1 R:R on this setup
Entry: 119,000
Stop Loss: 116,000
Target: 135,000
