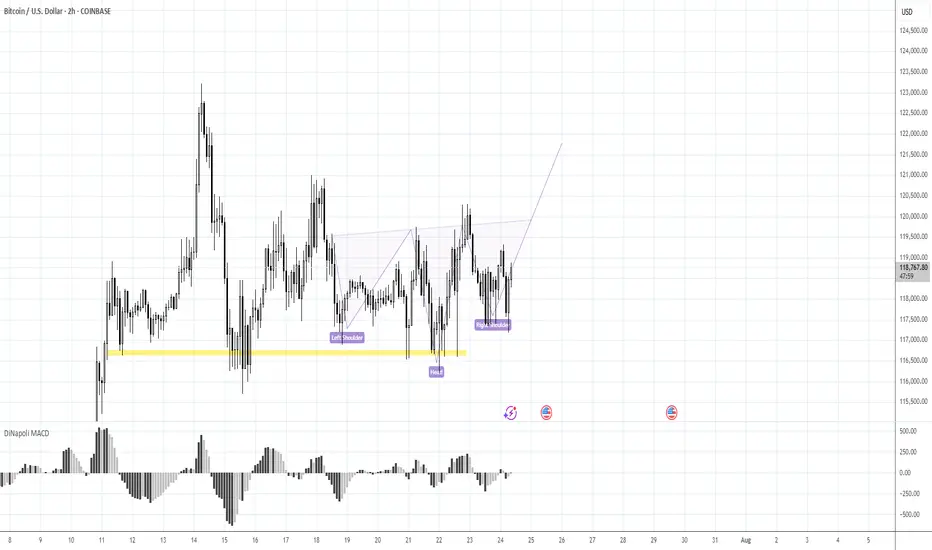
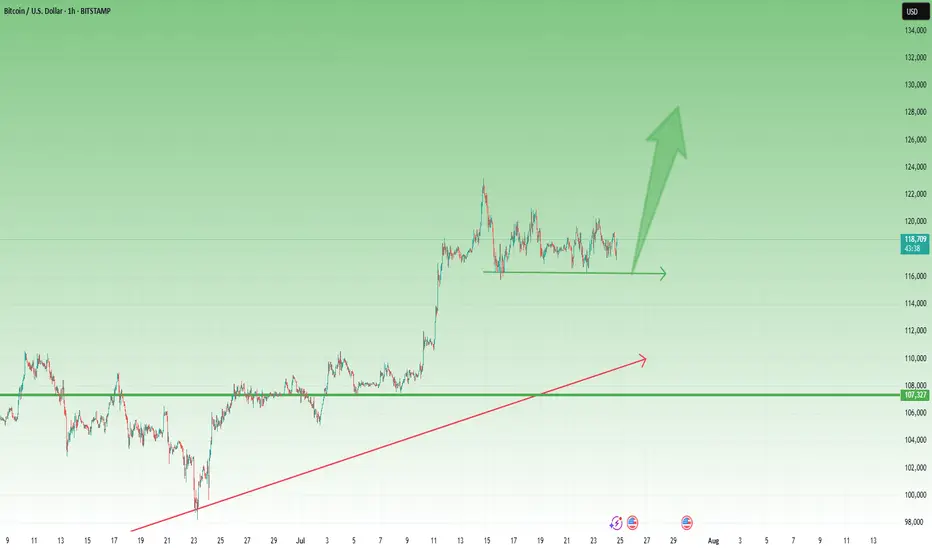
BITCOIN BULLISH WEDGE|LONG|
✅BITCOIN is trading in a
Strong uptrend and the coin
Has formed a massive bullish
Wedge pattern so we are
Bullish biased and IF we see
A bullish breakout we will
Be expecting a further
Bullish move up
LONG🚀
✅Like and subscribe to never miss a new idea!✅
Disclosure: I am part of Trade Nation's Influencer program and receive a monthly fee for using their TradingView charts in my analysis.
BITCOIN trade ideas

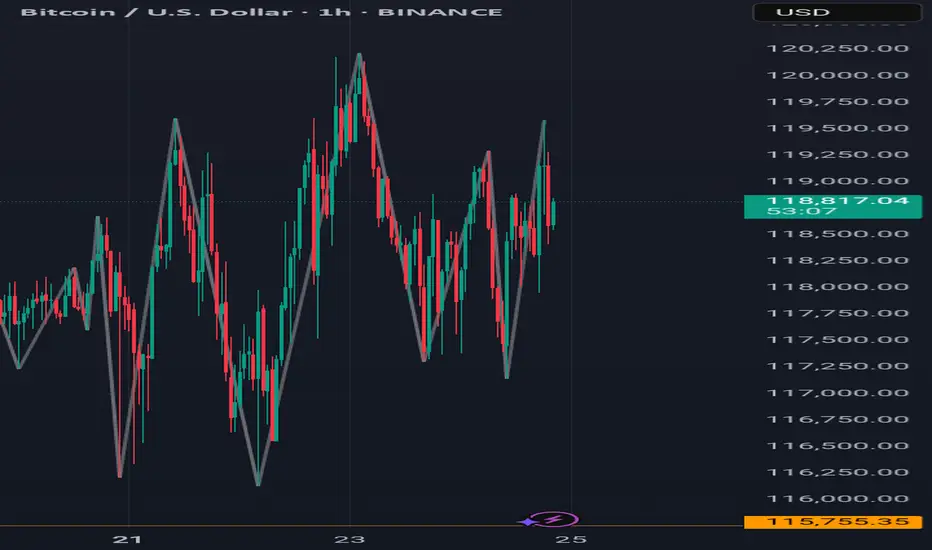
BTC #The chart depicts a 15-minute Bitcoin (BTC/USD)The chart depicts a 15-minute Bitcoin (BTC/USD) price action forming a cup and handle pattern, which is generally considered a bullish continuation pattern. The rounded base signifies consolidation, followed by a potential breakout above the $120,250 resistance zone (blue line). A breakout with volume could confirm upside momentum. The shaded grey area below (~$117,000) represents a support zone, crucial for invalidation of the pattern if breached.
thanking you

Continuation flag ?Looks like a continuation flag, thoughts?
ETH is in a pullback, BTC didnt have one,
looks like a strong bullish flag

BTCUSD Bullish engulfing
Buy from current price or wait for retest
Bullshlish momentum observed
Mangae risk book partially as metioned or as per your capital

BTCUSD 7/24/2025Come Tap into the mind of SnipeGoat as he gives you a Full Top-Down Analysis of Bitcoins Price Action from the Monthly down to the 30min. To keep you align & aware of what's REALLY going on in the market. Don't believe the hype, we read Candles over here!
_SnipeGoat_
_TheeCandleReadingGURU_
#PriceAction #MarketStructure #TechnicalAnalysis #Bearish #Bullish #Bitcoin #Crypto #BTCUSD #Forex #NakedChartReader #ZEROindicators #PreciseLevels #ProperTiming #PerfectDirection #ScalpingTrader #IntradayTrader #DayTrader #SwingTrader #PositionalTrader #HighLevelTrader #MambaMentality #GodMode #UltraInstinct #TheeBibleStrategy

Wealtris: Ethereum Demand Surges 32x — Price Set to Explode?According to a recent market analysis by Bitwise, Ethereum’s demand now exceeds supply by 32 times—a rare market condition that could lead to a major price breakout. Institutional interest, combined with Ethereum’s deflationary structure, is creating a perfect storm for growth.
At Wealtris, we treat this not just as market news, but as a strategic window to help our investors profit from a fundamentally bullish setup.
The imbalance is driven by several forces: over 27 million ETH are locked in staking, taking supply out of circulation; the upcoming wave of Ethereum spot ETFs is attracting pre-approval accumulation; and Ethereum’s fee-burning mechanism continues to deflate the token’s total supply. Simultaneously, its role as the backbone of DeFi, NFT infrastructure, and Layer 2 chains keeps demand elevated.
While traders speculate, institutions prepare. Whales and funds are quietly accumulating ETH in anticipation of regulatory clarity and ETF launches. Bitwise compares this setup to Bitcoin’s trajectory before its 2020 bull run, when a similar supply crunch triggered explosive gains.
Wealtris is already positioned for this moment. Our investment strategies offer smart exposure to Ethereum via staking platforms, ETH-indexed instruments, and Layer 2 ecosystem tokens. We provide our clients with risk-managed access to the Ethereum upside—without the need to self-manage wallets or guess market timing.
In addition, we monitor on-chain data and ETF progress in real time, adjusting exposure as signals shift. Our hybrid strategy—balancing yield generation and price exposure—helps clients benefit from both sides of the Ethereum equation.
For forward-looking investors, the 32:1 demand ratio isn’t just an interesting metric—it’s a signal. Wealtris uses that signal to generate structured growth through precise capital allocation and macro-responsive rebalancing.
With regulatory developments, staking innovation, and ETF momentum building, Ethereum appears poised for an institutional era. At Wealtris, we ensure our clients are prepared—early, efficiently, and profitably.
Best Meme Coins Live News Today: Latest Opportunities & UpdatesIn the fast-paced world of meme coins, today’s market presents fresh opportunities for both new and seasoned investors. With community-driven narratives dominating, identifying the best meme coins means staying updated on project fundamentals, social sentiment, and tokenomics. Here’s a detailed overview of the live scene and emerging opportunities shaping the meme coin landscape in 2025.
1. ShibaX (SHIBX): Riding the Dog-Themed Wave
Why it’s trending:
ShibaX combines the beloved Shiba Inu dog theme with practical features—NFT integration, staking, and cross-chain bridges. These elements have reignited investor interest.
Latest updates:
New staking platform launched on Ethereum and BNB Chain, offering up to 20% APY.
Roadmap reveal includes “ShibaX Arcade,” a gaming platform with meme lore-based mini-games.
DeFi integrations allowing SHIBX to be used as collateral in lending protocols.
Investor take: Strong branding with concrete utility upgrades could offer both hype-driven spikes and sustained growth.
2. BabyDoge Gold (BABYG): Rising from Origins
Why it’s trending:
A spin-off from the original Baby Doge Coin, BabyDoge Gold aims to redefine tokenomics with enhanced burn mechanisms and community engagement.
Latest updates:
Fix for liquidity token bug was addressed within 24 hours—boosting retail confidence.
Marketing campaign “Golden Paw” launched, expanding reach via YouTube and local crypto meetups.
25% token burn event announced to reduce supply and strengthen price over time.
Investor take: While still early-stage, BABYG’s quick fixes and supply-control measures are positive indicators—though caution remains necessary.
3. Floki EDU (FLOKIEDU): Meme Coin with Purpose
Why it’s trending:
Floki EDU differentiates with a strong emphasis on educational initiatives, publishing free courses about token fundamentals, security, and blockchain literacy.
Latest updates:
Partnership with a blockchain academy in India, enabling FLOKIEDU use in classrooms.
Interactive Telegram quiz bots reward users with tokens.
Pending centralized exchange listings, subject to community votes.
Investor take: Combining mission-driven goals with token utility adds long-term resilience beyond hype.
4. ElonDoge (ELDOGE): Fan-Focused Franchise
Why it’s trending:
Capitalizing on Elon Musk’s Dogecoin fandom, ElonDoge remains a cult favorite with its viral campaigns and high-yield staking pools.
Latest updates:
Limited-time pools with 150% APY to attract quick inflows.
Merchandise integration includes NFTs and apparel tied to Elon-themed meme culture.
"Space Chatter" Telegram community holds frequent AMAs, enhancing engagement.
Investor take: High-risk, high-reward dynamics—suitable for short-term momentum traders rather than long-term holders.
Final Thoughts
Despite the chaotic nature of meme coins, coherence between community strength and utility can spell significant returns. Coins like ShibaX and Floki EDU have moved beyond mere novelty, offering real functionality. Meanwhile, BabyDoge Gold and ElonDoge are high-volatility assets rooted in meme culture.
For traders, blending these project types can hedge risks. Stay vigilant, track updates, and always manage positions with discipline—this approach ensures readiness for the next meme market surge.

BTC predictionSome of you may feel dissatisfaction, emptiness, or longing. This longing is the loss of freedom, and it is freedom that you truly yearn for.

Long -Market Moving in an uptrend
-Market consolidating at a support level
-Market has broken and tested counter down trend trendline.

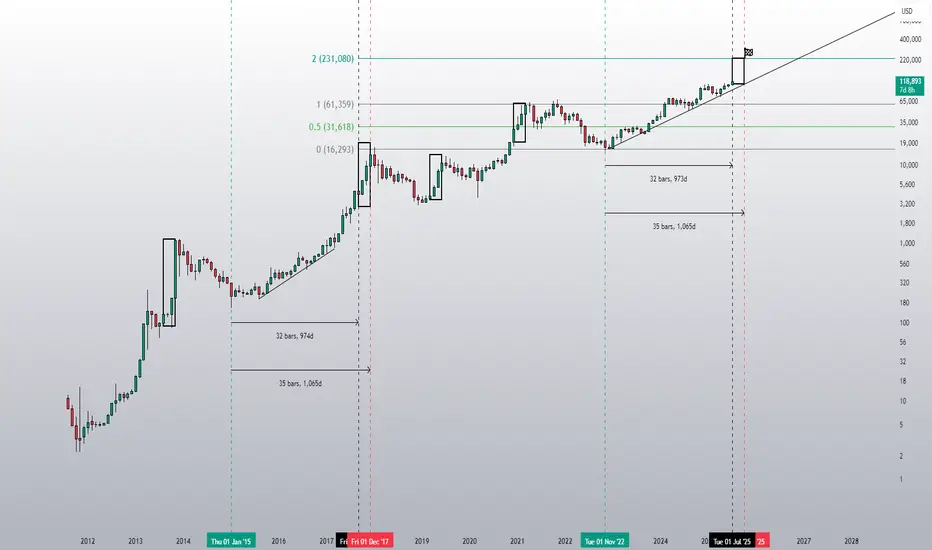
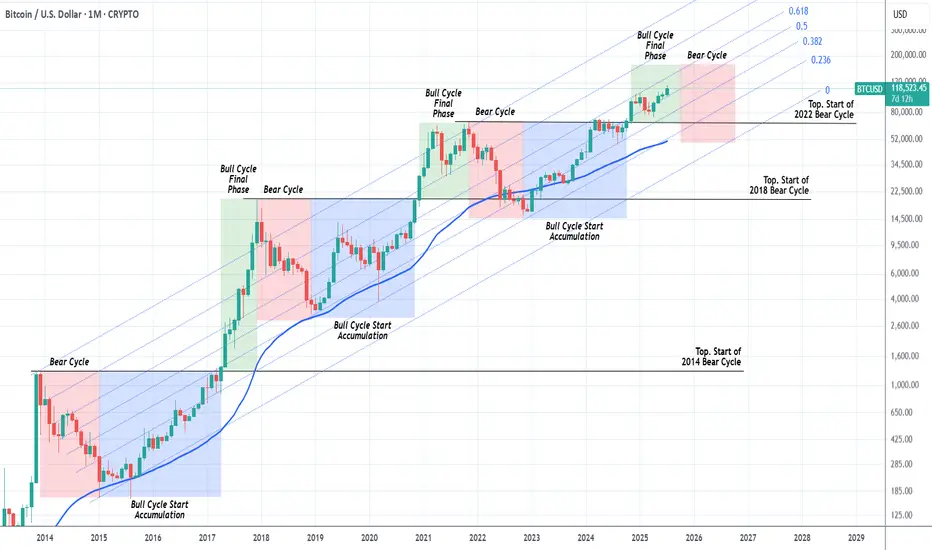
BITCOIN Should we start thinking about the next Bear Cycle yet?Bitcoin (BTCUSD) has had extremely symmetric (time-wise) Cycles in the past +10 years and this is a subject we've analyzed extensively many times. We've spent the last months projecting potential Targets for each stage of the bull run and only the last few are left.
This is exactly why we thought today's chart would be very fitting. The current Bull Cycle isn't over yet but also, based on the 4-year Cycle Theory, isn't far of either. By October 2025, that model suggests that all profit should have been taken.
As you can see, we are in the green zone, the Bull Cycle's Final Phase and since this Cycle has been trading entirely within the 0.236 - 0.618 Fibonacci Channel range, by October the price shouldn't be much higher than $160k.
In any event, this is a good guide, presented to you in a good time, to keep your mindset inside a long-term perspective and prepare you for not only the upcoming Top but also the next (1 year) Bear Cycle, which could again push the price below the 1M MA50 (blue trend-line), which would be a solid level for long-term buy positions again.
So do you think the Top is closer than it looks? Feel free to let us know in the comments section below!
-------------------------------------------------------------------------------
** Please LIKE 👍, FOLLOW ✅, SHARE 🙌 and COMMENT ✍ if you enjoy this idea! Also share your ideas and charts in the comments section below! This is best way to keep it relevant, support us, keep the content here free and allow the idea to reach as many people as possible. **
-------------------------------------------------------------------------------
💸💸💸💸💸💸
👇 👇 👇 👇 👇 👇
BREAKING – US to Unveil Key Crypto Report: Crucial Moment for BiIn what could be a watershed moment for the digital asset industry, the U.S. government is expected to release a major crypto policy report in the coming days. Sources suggest the report will outline a framework for regulating digital assets, including Bitcoin, stablecoins, and DeFi—potentially defining how crypto will be governed in the world's largest economy.
Why This Report Matters Now
Amid rising political and economic pressure, the U.S. is being forced to take a firmer stance on crypto. With the 2024 elections behind and growing institutional participation, Washington is no longer able to delay key decisions.
Expected highlights of the report include:
Clarification on whether certain crypto assets are securities
Guidelines for stablecoin regulation
A potential roadmap for central bank digital currency (CBDC) development
Recommendations on DeFi and wallet service compliance
The report comes at a time when market volatility and fragmented oversight have led to investor uncertainty and inconsistent enforcement across states and agencies.
Possible Scenarios: Boom or Bust
Pro-Bitcoin Outlook
If the report favors clear rules, supports innovation, and endorses Bitcoin as a commodity (as the CFTC suggests), it could trigger a strong market rally. Institutional players sitting on the sidelines may finally enter.
Harsh Regulation
On the other hand, if the report leans toward heavy-handed enforcement—especially targeting self-custody, privacy, or DeFi—it could stifle innovation and lead to capital flight to offshore markets.
Neutral-but-Positive
A middle-ground report offering regulatory clarity without immediate enforcement could calm markets and lay the foundation for measured growth.
What’s at Stake for Bitcoin?
Bitcoin’s status in U.S. law remains technically undefined, though it’s generally viewed as a commodity. A clear statement reaffirming this status could fuel renewed institutional demand, ETF expansions, and deeper integration with traditional finance.
Conversely, if Bitcoin is lumped into broader regulatory restrictions, especially around AML or taxation, it could face new compliance burdens—dampening short-term momentum.
How the Market Is Reacting
Ahead of the report, Bitcoin has shown elevated volatility. Whales appear to be repositioning, with increased activity across derivatives markets and stablecoin inflows—indicating expectation of major movement.
Traders are watching key support at $56,000 and resistance near $60,000. A clear policy win could break this ceiling fast.
Conclusion
The upcoming U.S. crypto report could mark a historic regulatory pivot. For Bitcoin and the broader industry, the stakes are high: legitimacy, liquidity, and long-term growth—or repression and stagnation. One thing is certain—the days of regulatory limbo in the U.S. are numbered.

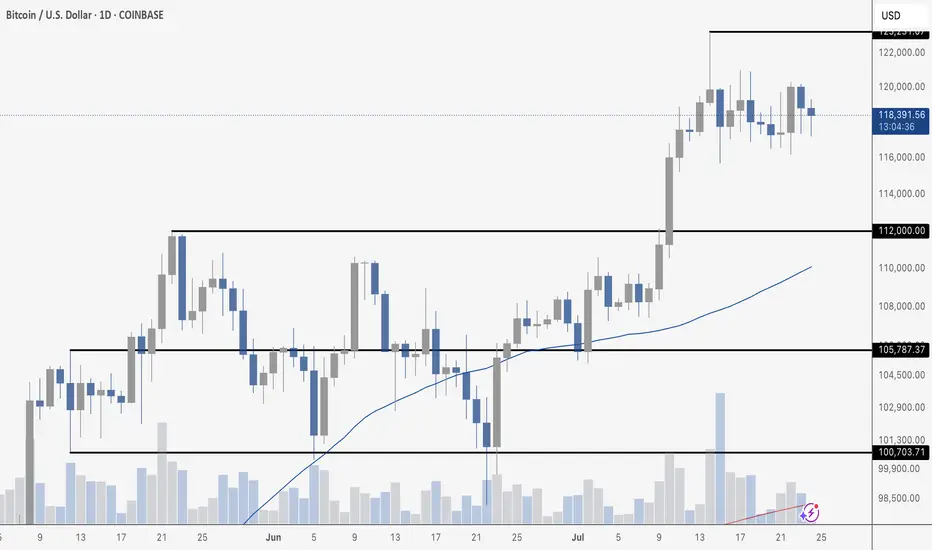
BTC CONSOLIDATESBitcoin is clearly consolidating after its recent breakout above $112K. Price is chopping between roughly $116K and $121K, taking a breather after last week’s rally. Tuesday marked the highest daily close in BTC history, but follow-through has been muted so far.
Volume is trending lower during this range-bound action, which is typical during consolidation. The 50-day moving average continues to rise and now sits around $110K, providing a strong cushion if price pulls back.
The structure remains bullish above $112K, but traders are watching for a breakout above $125K to confirm the next leg higher. Until then, expect more chop as the market digests gains.
BTC my notes for generalas long as it stays above 102k i see no problem for new aths
but there are too much liq pos at 95-97k
resistances are 122 - 137 - 145 - 161k
not financial advices, notes for myself

BTC Ready to Start to 125KMorning folks,
Better if you combine this update with previous idea. Now it seems that BTC stands in swamp action, flirting around 116K, which might be looking a bit bearish.
But by our view, this is not quite so. First is, triangle patterns as on daily chart as on 4H chart are look great and quite bullish. Pay attention that on 4H chart all sell-offs were bought out.
Our 1.16 lows that we set as vital ones for this scenario area still intact. So, it means that butterfly with 125K target that we discussed last time is also intact. I would say more. If you take a careful look at 1H chart - you could recognize reverse H&S pattern that could trigger all this stuff. It means that we're not in swamp, but at the point where the decision on long entry has to be made...
Take care
S.
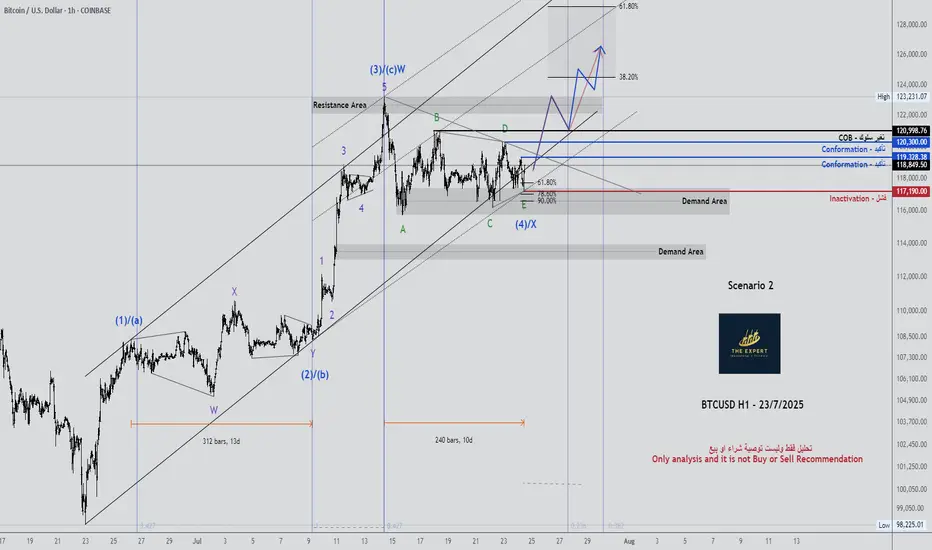
BTCUSD H1 - Updated 23/7/2025BTCUSD H1 - Updated 23/7/2025
chart has language
Only analysis and it is not Buy or Sell Recommendation.
Good-luck.
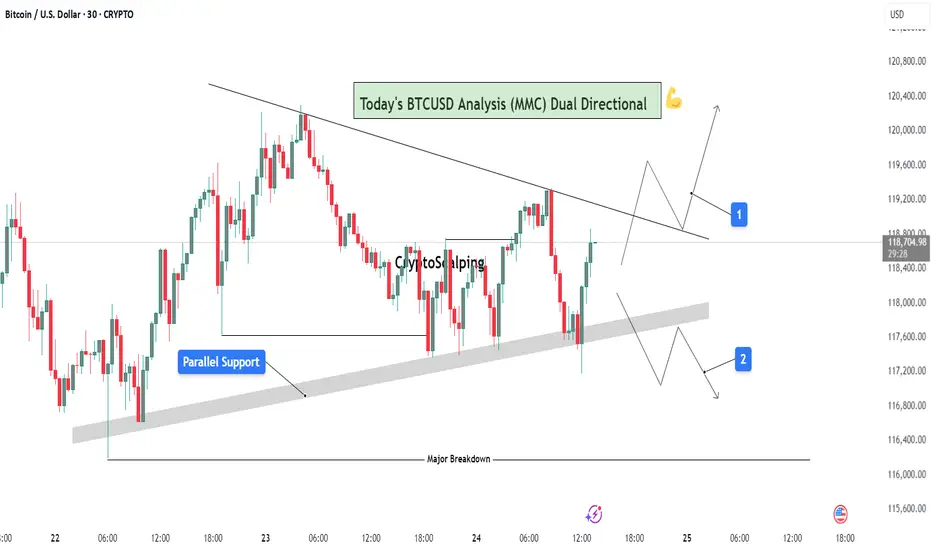
BTCUSD Analysis (MMC) : Dual Directional Outlook let's See🔍 1. Overview of Structure & Context:
On the 30-minute timeframe, BTCUSD is consolidating between two strong technical zones:
A descending trendline acting as resistance
A parallel rising support forming a compression zone
This wedge-like formation signals a potential high-impact move in either direction — a dual-directional outlook. Price is currently testing the midpoint between resistance and support, offering two reactive trade scenarios.
🟦 2. Key Zones Highlighted on Chart:
🔹 A. Parallel Support Zone (Dynamic Support):
A grey-shaded rising support has been tested multiple times.
Each bounce suggests buying strength near this diagonal zone.
This zone represents smart money accumulation potential under MMC concepts.
As price approaches this zone again, bulls are expected to step in if momentum aligns.
🔹 B. Descending Resistance Line (Supply Line):
The market is facing lower highs, a sign of bearish control at higher levels.
Each retest of this line has led to a rejection.
This line also acts as a liquidity magnet — price may spike above it to trap buyers before dropping (false breakout potential).
🧭 3. Scenarios and Trade Possibilities (Dual Directional Path):
✅ Scenario 1: Bullish Breakout – (Marked as Path 1)
If BTC breaks above the descending trendline with strong bullish volume, this confirms a structural breakout.
This setup targets:
First level: $119,600
Second level: $120,200
Once broken, the trendline can flip into support.
Ideal confirmation:
Bullish engulfing candle on breakout
Retest of broken resistance turning into support
Volume surge or momentum indicators turning bullish
⚠️ Scenario 2: Bearish Rejection & Breakdown – (Marked as Path 2)
If BTC fails to break resistance and breaks below the parallel support zone, it opens a bearish scenario.
Price may fall back to:
First level: $117,200
Final key support: $116,400 (Major Breakdown Zone)
This is a typical MMC-style mirror move: a structure break leading to liquidity run toward a previous demand zone.
Bearish confirmation:
Close below grey zone
Lower high formation near resistance
Increasing bearish volume / weak bounce
📐 4. Strategy & Trading Tips (MMC Application):
Under the Mirror Market Concepts (MMC), these zones are not just technical levels — they represent emotional price memory of both institutional and retail players.
Wait for the reaction, not prediction.
Use confluence tools (RSI divergence, volume, candle patterns).
Avoid trading inside the wedge — it's a trap zone.
Ideal entries are at breakout with retest confirmation or rejection from major zones.
📊 Risk Management Plan:
Entry Type Trigger Level SL Suggestion TP Range
Long Trade Break & retest above $118.8K Below $118.2K $119.6K → $120.2K
Short Trade Breakdown below $117.8K Above $118.2K $117.2K → $116.4K
🧠 Conclusion:
BTC is in a decision-making zone between a downward pressure line and strong support. A breakout could lead to a clean trend continuation, while a breakdown would trigger bearish momentum. The chart reflects precision MMC logic, offering a tactical map for day traders and scalpers to follow the smart money — not the noise.
Let the market decide direction. We just need to be prepared, not predictive.
Ethereum is Trending HigherSince April trough, Ethereum has risen by 179%, delivering a higher rate of return than Bitcoin at 66%. But most of our attention is on Bitcoin, breaking above the 120,000 level.
Why is Ethereum quietly gaining ground —and what does the future hold for Ethereum?
Mirco Bitcoin Futures and Options
Ticker: MET
Minimum fluctuation:
$0.50 per ether = $0.05 per contract
Disclaimer:
• What presented here is not a recommendation, please consult your licensed broker.
• Our mission is to create lateral thinking skills for every investor and trader, knowing when to take a calculated risk with market uncertainty and a bolder risk when opportunity arises.
CME Real-time Market Data help identify trading set-ups in real-time and express my market views. If you have futures in your trading portfolio, you can check out on CME Group data plans available that suit your trading needs www.tradingview.com

BTCUSD – Bulls Still in Control After New ATH 🔸 After the new All-Time High printed 10 days ago, Bitcoin entered a consolidation phase. So far, the market looks healthy and seems to be waiting for a trigger to continue the uptrend.
🔸 A clear support zone has formed around 116k, and as long as this level holds, bulls remain in full control of the market.
📉 For short-term traders and speculators:
Buying dips near 117.5k could offer solid risk/reward setups, with a target around 125k in case of a breakout.
Let’s see if the market gives us the trigger we’re waiting for. 🚀
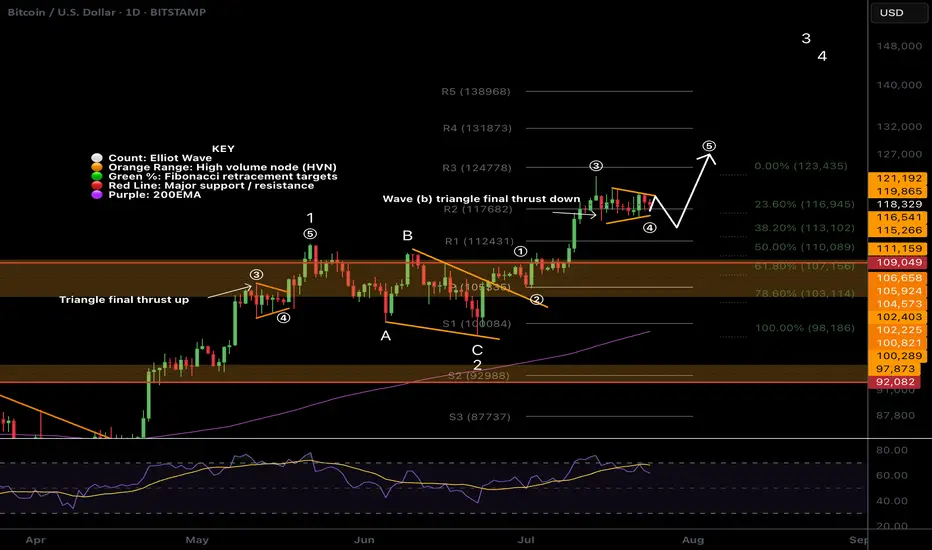
$BTC Wave (b) triangle?CRYPTOCAP:BTC Bitcoin appears to have competed wave 3 up, wave (a) down and now finishing a triangle in wave (b) which would result in a thrust down to around $113k before continuing to the upside in wave (5).
There is slight bullish divergence on daily RSI and wave (4) meets the Fibonacci retracement rules of between 0.236 - 0.382 adding confluence.
Previous all time high is expected to be tested as support on a larger correction, perhaps when the ascending daily 200EMA creeps up to the same level after we blow off.
Safe trading
BTCUSD LOST SHORT-TERM BULLISH POTENTIALBTCUSD LOST SHORT-TERM BULLISH POTENTIAL
Bitcoin has been trading sideways since July 15th within a range of 116,000.00-120,000.00. Indicators show no signs of a new bullish/bearish trend.
How to trade sideways movements or range?
It is better to wait for a price to come close to one of the levels (support or resistance), then open buy/sell order. Or just pace a limit order and wait. Take-profit may be above/below the support/resistance levels with a stop-loss behind these levels (below for the support and above for the resistance).
So, the price decline towards 116,000.00 is expected, where potentially the price may rebound once again.

BTC #15-minute Bitcoin (BTC/USD) chartThis 15-minute Bitcoin (BTC/USD) chart shows a recent bullish reversal from a strong demand zone (highlighted in grey near $117,400). Price broke above a minor resistance (grey zone around $118,000) and is currently following an upward trendline. The next key resistance is around $118,600 (blue horizontal line), which may act as a target or reversal point. Bulls are currently in control as long as price respects the trendline and holds above the broken resistance.
thanking you
