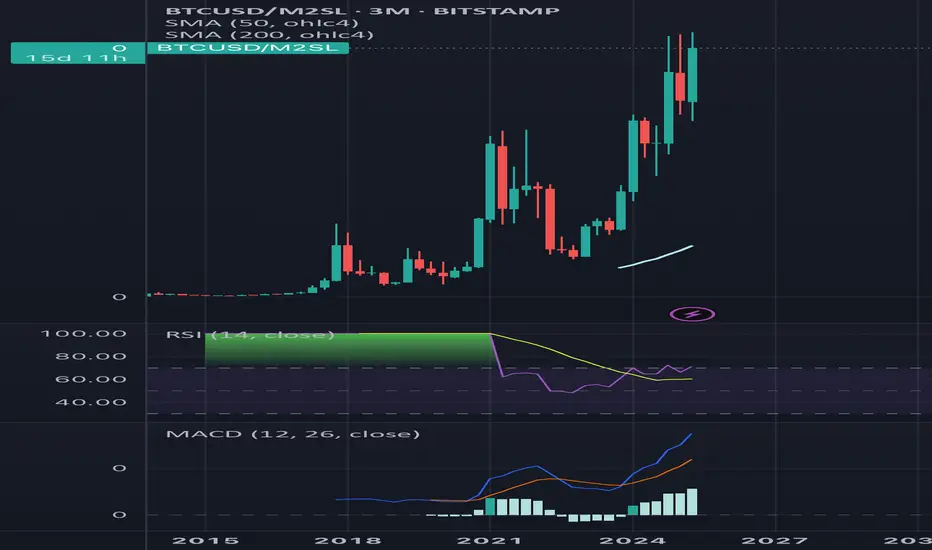
Relative Wealth H/T Tad Smith @tadtweetsAs per, Tad Smith, Relative Wealth is where the rate of return exceeds the average OECD 8% to 10% monetary debasement of fiat currencies. This is easily seen in Bitcoin / M2.
BITCOIN trade ideas
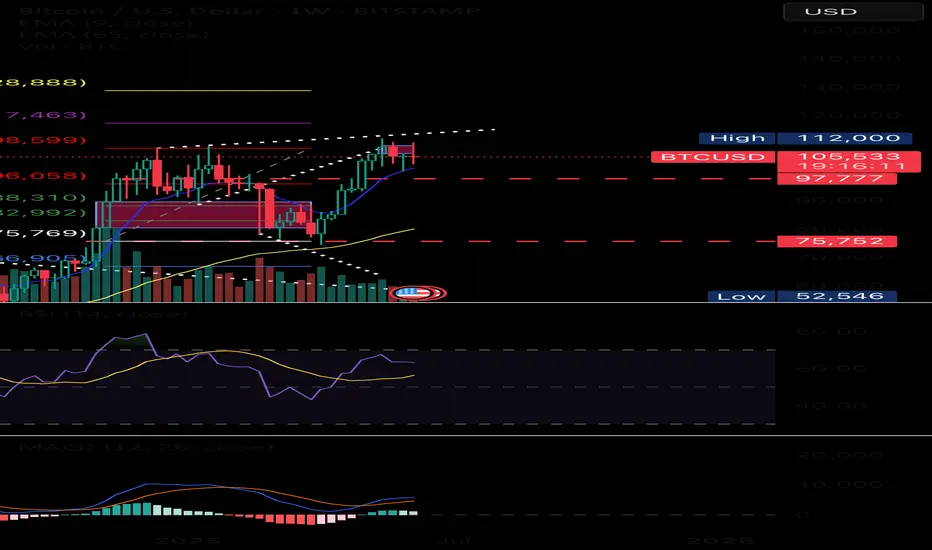
Bitcoin Weekly Analysis – Rising Risks Amid Geopolitical TensionBitcoin (BTC/USD) is currently navigating a critical zone. The market shows signs of weakening structure, with price failing to make higher highs and now hovering near a key support area within an ascending channel.
My projection indicates a potential retest of the mid-range support around $85,000. However, if this level fails to hold—especially under the weight of macroeconomic and geopolitical uncertainty—we may see a deeper correction toward the $70,000 zone and possibly even the long-term trendline support near $60,000.
One of the most concerning external factors influencing the market sentiment right now is the escalating conflict between Israel and Iran. With Israel reportedly conducting airstrikes over the weekend and Iran threatening retaliation, the situation is rapidly intensifying. Such geopolitical instability tends to spark fear in global markets, often pushing risk-on assets like Bitcoin into sharp selloffs as liquidity shifts into safer instruments like gold or the U.S. dollar.
Even though institutional players such as BlackRock continue to accumulate Bitcoin, likely due to long-term conviction and ETF exposure, retail sentiment is highly sensitive. In scenarios where war escalates or expands to involve other nations, panic selling by retail traders could trigger cascade liquidations, potentially fulfilling this bearish projection.
In summary, while Bitcoin remains technically within a bullish channel, the structure is fragile. A clean break below the highlighted support zone could usher in a mid-cycle correction, especially if geopolitical tensions worsen. Risk management is paramount in the current environment.

Current BTC Trend Analysis and Trading RecommendationsToday's overall BTC market rebounded after hitting a low of 102,614 in the early trading session, with Bitcoin's price maintaining a slow upward trend throughout the day. The intraday high reached 105,912 but encountered resistance. As the weekend approaches, historical market data shows limited volatility during weekends, so range-bound fluctuations are expected for the weekend.
From the current overall market rhythm, the price has rebounded slightly today after the previous decline. The hourly chart shows consecutive upward candles, though the price movement remains relatively slow. As time progresses, the price is expected to sustain an upward trend after pullbacks, and breaking through the short-term resistance level is only a matter of time. In terms of short-term structure and pattern, despite slight resistance and minor pullbacks, the downward momentum has weakened. We can still focus on long positions at lower levels, paying attention to the 106,000 resistance level.
BTCUSD
buy@104000-104500
tp:106000-107000
Investment itself is not the source of risk; it is only when investment behavior escapes rational control that risks lie in wait. In the trading process, always bear in mind that restraining impulsiveness is the primary criterion for success. I share trading signals daily, and all signals have been accurate without error for a full month. Regardless of your past profits or losses, with my assistance, you have the hope to achieve a breakthrough in your investment.

Support (Demand Zone): Around $90,000 — the projected downside .✅ Current Market Structure:
We’re seeing lower highs and lower lows, which typically signals a downtrend.
The price recently fell from a resistance zone (marked in green) near $110,000.
Currently, we’re bouncing upward (forming a small correction) before a potential further drop.
✅ Key Levels:
Resistance (Supply Zone): Around $108,000–$111,000 — strong selling pressure here.
Support (Demand Zone): Around $90,000 — the projected downside target.
The price might break down toward that $90,000 range after a small upward correction.
✅ Expected Scenario:
The price may rebound toward $106,000 or even up toward $108,000 (forming a lower high), then reverse and continue its descent toward $100,000, and ultimately toward $90,000.
This forms a zig-zag down — a classical downtrend structure with lower tops and lower bottoms.
✨ If you’d like, I can:
Provide entry, stop-loss, and take-profit for a short trade.
Perform a more granular technical analysis with indicators (RSI, MACD, or Fibonacci).

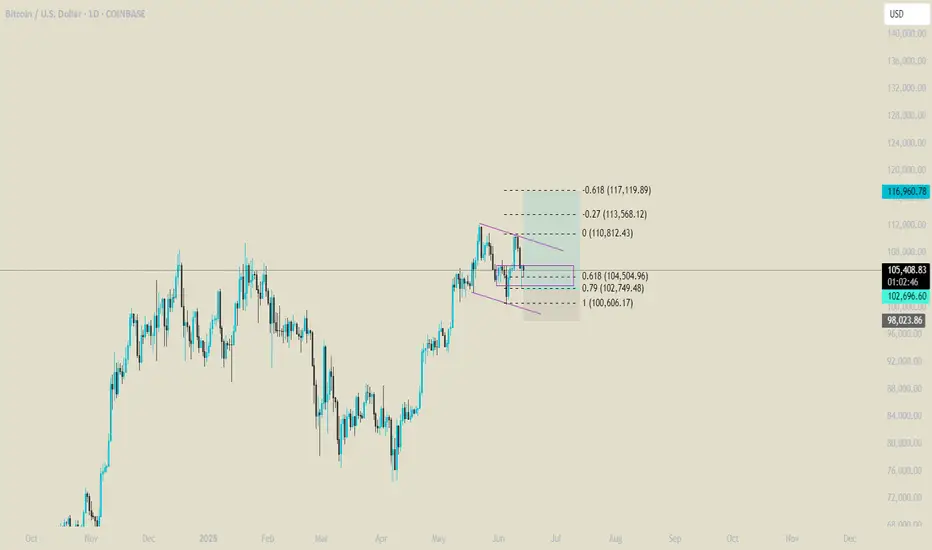
#BTC Double Top Breakdown? Key Levels to Watch: 100K, 92K, 74Bitcoin has recently formed a double top pattern near its all-time high at $112K–$110K, signaling potential exhaustion in the bullish momentum. After a strong rejection from the $106K resistance — a critical zone that has historically failed to close above on the daily timeframe — BTC is showing increasing bearish pressure.
All major indicators — RSI, MACD, and Stochastic RSI — are aligning to confirm this potential downtrend.
Here’s the projected bearish scenario if key supports break:
A break below $100K could trigger a fall to $97K, followed by a bounce and retest.
Rejection from $100K again may lead to a drop toward $92K.
Failure to reclaim $95K–$90K could send BTC directly down to $88K.
Another failed attempt near $90K might push Bitcoin to crash toward $74K, echoing the 2024 summer correction pattern.
This setup mirrors past seasonal moves and could mark a significant shift in market structure if confirmed.
📉 Watch these key zones:
$106K – Major resistance
$100K – Psychological and structural support
$92K / $88K / $74K – Potential targets if bearish continuation plays out
⚠️ Stay alert for retests and confirmations before entries.

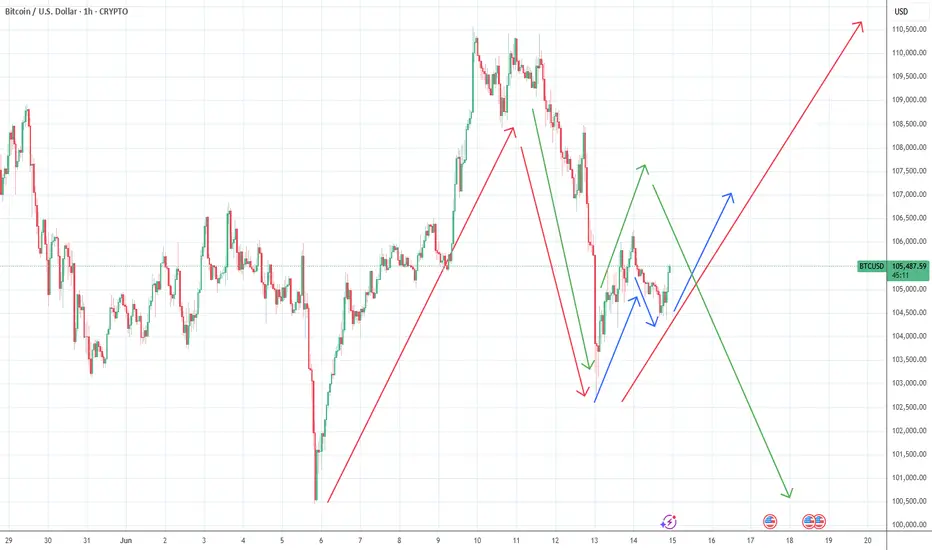
Bitcoin/US Dollar 1-Hour Price Chart (June 15, 2025)a 1-hour candlestick chart for Bitcoin (BTC) priced in US Dollars (USD), showing a recent price of $105,154.79 with a slight decline of -0.30% (-$311.19). The chart highlights a price range between $103,501.84 and $106,000.00, with a notable support level around $105,154.79 and a resistance zone shaded in pink between $105,217.91 and $105,767.97. The time frame spans from 10:00 to 20:00, with the current time at approximately 15:00.

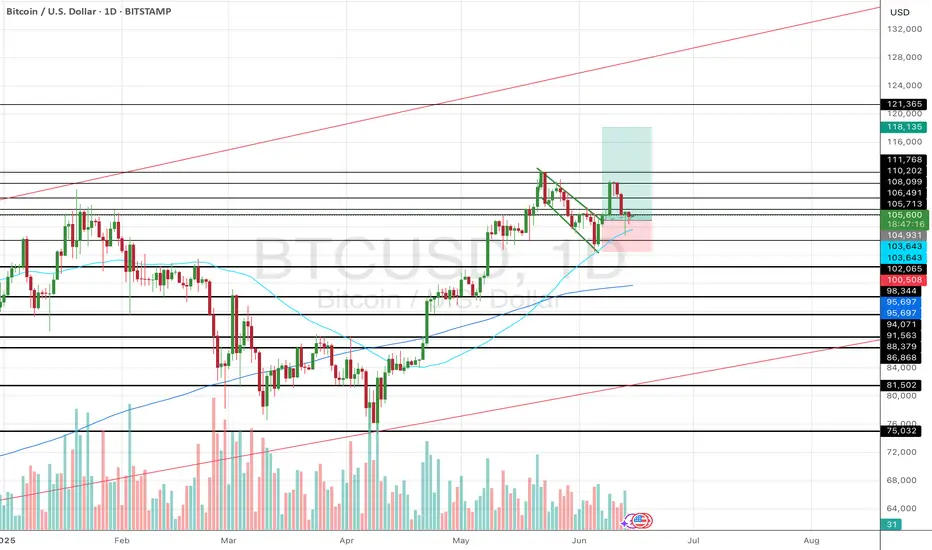
Bitcoin: weekly gains and dipsThere has been a sort of roller coaster with BTCs weekly price movements during the previous week. The week started with a strong move toward $110K. Although it seemed like a fresh new momentum toward the higher grounds, or eventually new all time highest level, the price soon began to tumble down, ending the week above the $104K level. On charts, it looks more like a “pump and dump” strategy, imposing a potential for a further correction. However, the reaction of BTC market on the negative news regarding the new unrest in the Middle East was exposed shortly on Friday trading session, when the price shortly reached the $102,9K level.
The RSI modestly dropped below the 50 level, ending the week at the 47. The MA 50 currently stands as a supporting level for BTCs price, while the indicator continues to diverge from its MA200 counterparty.
As per current charts, there is a high probability that weekly gains and dips will continue. The line connecting the lowest level from the beginning of April this year and lows from the beginning of June and from the previous week shows that there is a high probability for $104K to be tested. It also perfectly combines with MA50 as a currently supporting line. In case that the $104K is breached toward the downside, then it might bring some short bearish movements with BTC. In this scenario, the $100K might be again the target. However, if the $104K sustains the selling pressure, then the BTC will return toward the $108K.

Greed as LiquidityBitcoin isn’t rising — it’s baiting. Retail believes it’s a breakout. Smart money sees exhaustion. Momentum is draining, liquidity is drying. Prepare for a drop. Not with fear, but with positioning.
Clear pinbar rejection on Daily and 1hrBroke out of a clear consolidation and retested with a beautiful textbook pinbar rejection not only on daily but on 1hr charts. I personally expect an impulse to $118,000.
As always anything can happen
104k is the key level of BTC to continue go up with target 122kOn chart, BTC will be supported by MA50 at 104.000 price level and the target is 122k.

Bitcoin Bitcoin is showing strong momentum to keep moving up.
📊 But for it to truly explode, we need to see inflation spike past 3%.
🔥 Why? Because Bitcoin thrives in high-inflation environments it’s the hedge, the leverage, and the escape route.
#Bitcoin #Crypto #InflationHedge #BTC #Macroeconomics #TradingSignals
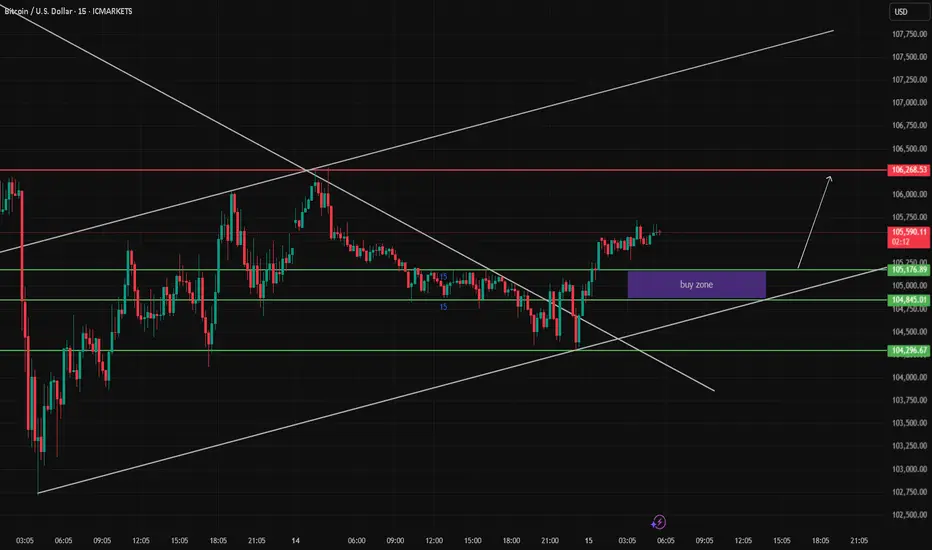
BTC/USD Approaching Key Buy Zone – Watching 104,845 for Reaction
Bitcoin has broken out of a descending channel and is now approaching a potential buy zone between 105,176.89 and 104,845.01. This zone aligns with previous support and trendline confluence, making it a critical area to monitor for bullish reactions.
If price finds support within this zone and confirms with a bounce or bullish pattern, a move toward the 106,268.53 resistance is a possible scenario.
However, a confirmed break below 104,296.67 could signal a shift in momentum and potentially invalidate the bullish setup.
🔹 Buy Zone: 105,176.89 – 104,845.01
🔹 Bearish Invalidator Level: 104,296.67
🔹 Target Area: 106,268.53
🔹 Timeframe: 1H chart
🔹 Trend Context: Price broke previous bearish structure and entered a short-term bullish phase.
This is a technical observation for educational purposes only.
$BTC Weekend Update - June 14Hello Fellow Degenerates,
Bitcoin is holding above 104k helping us a lot when it comes to our bullish scenario, however the bearish scenario still lingers and threatens to destroy all of our hopes, dreams and portfolios.
- We need price to break above 108k to confirm our bullish bias
- A rejection of 106k could bring price to retest 104k and possibly break it, validating our bearish scenario
- Levels to watch: 110.5k, 108.4k, 106.8k, 104.3k, 101k


My expectations for BTCUSDThe current sentiment is bullish but the market structure on lower timeframe shows BTC would go down at my marked zone. Make your own research before entering the trade. Good luck to y'all 🤞

bitcoin long This one for the bullss.
Let us try something different from the herd.
Might work.
Everyone is bearish because of the war , when majority says it , we know what we should do.
BTC 3 ways , but longhallo , i think BTC its for long , but any way on my chart you can see all possibilitys .
Is Bitcoin Trend in Danger?Damn bears destroy what it was a beautiful trend but Bulls still have one more week to try to finish the job right. TIME will tell.
Alright now that volatility has subside (for now) we can see what the numbers will be for the next 2 to 3 days and doesn't look too good unless bulls are able to climb back up and stay above the $107k within the next 48hrs.
Weekly hasn't changed at all and is to the Upside.
Daily also still to the UPside but showing weakness.
Lets see if the 4hrs TF which is in bullish mode, can fix the damage that bears did today.
Lets see what the weekend brings. No popcorns today ladies and gentlemen.
BITCOIN ATH INCOMINGI want us to fill these imbalances. Not just wick them or graze them, but truly fill them. Sit in them. Let price spend time there.
Because time inside inefficiency is what gives others the chance to participate. It creates space for real transaction, not impulsive chasing but deliberate positioning.
Ideally, I want to see price return to the imbalance in discount, a zone where price is considered cheap. That’s where buyers are most willing to step in. That’s where the opportunity lies.
From there, I want to see a weekly body close inside the imbalance. Not a shallow reaction, but commitment. That confirms intent. Then we move, continue the bullish orderflow, and leave a fresh daily imbalance behind.
We’ve seen this play out before. In the example we studied, price initially wicked into the imbalance, then came back and raided the low. That second move was the invitation. It gave the market time to transact. You could clearly see volume building, buyers stepping in, and the imbalance being filled with purpose. Only after that did we get the explosive move to the upside. Not before. The strength came after the market gave participants time to load up.
Now, there is a top-side scenario on the chart where price could continue higher and form an imbalance above first. If the market is truly bullish, that’s possible, but it isn’t my preference. I’d rather see price reload deeper, offer value, and then expand.
The roadmap is simple: return, fill, confirm, and climb.
This isn’t just bullish continuation. This is controlled, calculated momentu

19 Weeks LeftFriends, the end of the cycle is drawing near. The average cycle pico bottom to pico top is 152 weeks and the parabolic impulse into price discovery begins around week 133. This leaves us with 19 weeks in the present epoch. Stand fast. Keep faith. Remain vigilant.

Circle’s IPO and the Crypto Listing Wave: The Market EntersOn June 14, 2025, the U.S. stock market witnessed a pivotal moment for the crypto industry. Circle, issuer of the USDC stablecoin and a major player in the sector, successfully went public. Shares opened at $31 and soared to over $134 by the end of the first trading day—an explosive 330% gain.
This isn’t just a one-off success. It marks the beginning of a new chapter: the public crypto era, where leading crypto companies are stepping into the spotlight of traditional finance.
Why It Matters
Circle’s IPO signals the maturation of the crypto market. Just three years ago, crypto companies were seen as high-risk, unregulated tech startups. Now, they’re structured fintech firms with clear business models, institutional backing, and regulatory compliance.
Who’s Next in Line
Following Circle, a wave of major crypto firms is preparing for their own IPOs:
eToro – the social trading platform with crypto features has finalized its SPAC merger and is set to debut on NASDAQ.
Gemini – the exchange founded by the Winklevoss twins filed for an IPO in mid-May.
Galaxy Digital and Ripple – both confirmed listing plans for the second half of 2025.
Kraken is exploring a listing in Europe, where requirements are more flexible than in the U.S.
These companies are waiting for the right moment—regulatory clarity, growing interest in crypto ETFs, and progress in U.S. Congress (with the CLARITY and GENIUS bills gaining momentum).
What It Means for the Industry
Increased Investor Trust – Public companies must disclose financials, pass audits, and comply with regulations. This builds confidence in the broader crypto sector.
Institutional Capital Inflow – IPOs unlock access to capital from pension funds, hedge funds, and asset managers that cannot invest in private crypto startups.
Marketing Power – Going public draws media attention and boosts brand awareness. Every IPO is a PR win for the entire industry.
Risks and Challenges
Regulatory Uncertainty – Despite progress, the SEC could change direction, especially with potential political shifts.
Overvaluation Concerns – Circle’s stock is already raising eyebrows, with a P/E ratio over 200 and trading volume growing faster than revenue.
Crypto Market Dependency – If crypto prices crash, the valuations of these companies could quickly collapse.
What’s Next
Expect up to 10 more crypto IPOs over the next 6–12 months, including players in DeFi, blockchain infrastructure, and Web3. This is the next stage in crypto’s journey toward mainstream legitimacy.
What was once the domain of tech rebels and early adopters is now becoming a business—with a stock ticker and quarterly earnings. And that changes everything.

BTC/USD Approaching Key Decision Zone Within Bearish Channel
Bitcoin continues to trade inside a well-structured descending channel on the 1H chart. Price is currently consolidating around the support zone of 104,517 – 104,071. This area could act as a potential pivot point.
If bulls manage to break above the descending trendline, a move toward the 106,268 resistance level could develop. However, as long as the price remains within the channel, the bearish bias remains in play.
This idea focuses on observing price behavior near critical levels without offering direct trade signals. Always monitor volume and structure confirmation before making decisions.

BTCUSD SHORT (SELL)🚀 Pair: BTCUSD
📉 Direction: Short (Sell)
🎥 Analysis:
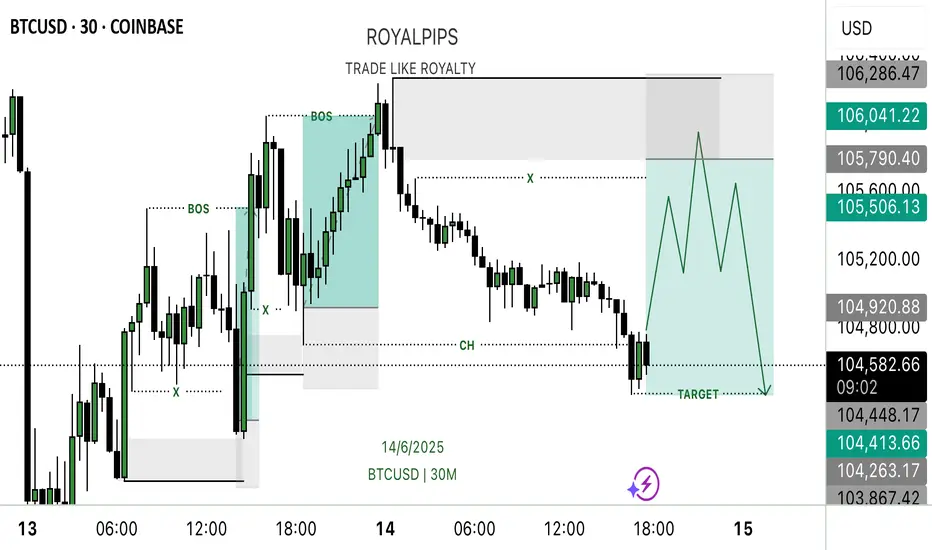
BTC has recently broken its last M15 low, marking a Change of Character (CHOCH) in the market structure. This shift from bullish to bearish momentum signals a potential reversal or downside movement.
I’m expecting a retracement back up to a key supply/resistance area (such as a previous support turning into resistance) before price continues downward.
This view is supported by a clear inducement in front of the supply zone, lower low formation, and weak buying pressure on the pullback — all indicating sellers are currently in control.
🕹 Entry: Supply zone level
🎯 Target: Next major support or liquidity pool below.
🛑 Stop Loss: Positioned above the last lower high to manage risk in case the market reverses.