BUYRejection Level
Daily Volume
Market Structure Shift
London US Session
Trend Line Break
Untapped Order Point
BITCOIN trade ideas

bitcoin is still bullishon the monthly and weekly time frame the bitusd price is going to make new highs than its previous

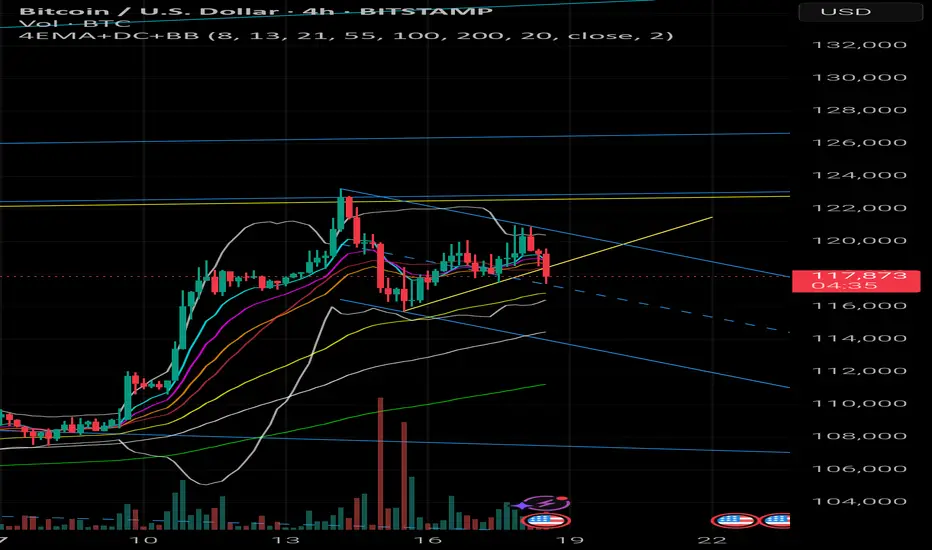
BTC Battles Resistance – Can Bulls Reclaim the Channel?🔥📈 BTC Battles Resistance – Can Bulls Reclaim the Channel? 🧠🚪
Bitcoin is now knocking on the door of the broken channel support — what was once a floor is now acting as resistance. For bulls to regain momentum, price must reclaim and close back inside the channel, ideally above 118.6K.
📍 Key Structural Notes:
We've already broken below the internal channel — this is no longer a confirmed uptrend.
Current resistance is the same trendline that previously acted as support — classic technical flip.
Failing here keeps BTC vulnerable for a deeper move toward the Main Support at 114.9K, where the real test lies.
📊 Order Flow Context:
Funding remains mildly positive, showing no panic from longs.
Premium is near-zero — market isn't chasing.
OI is steady, showing neutral positioning but potential for sudden volatility.
Spot volume picked up during the recent move, but not strong enough to confirm a breakout… yet.
🧩 Scenarios:
✅ Breaks back above 118.6K with volume → Targets: 122.4K, 126.7K, 128.7K (channel continuation).
❌ Rejection at resistance → Eyes on 114.9K. Losing that, and we enter danger territory toward 106K.
We’re at a decision point — and these are the moments that shape the next leg.
One Love,
The FXPROFESSOR 💙
Disclosure: I am happy to be part of the Trade Nation's Influencer program and receive a monthly fee for using their TradingView charts in my analysis. Awesome broker, where the trader really comes first! 🌟🤝📈

BTC/USD | 2025 Top = 130k | 2026 Top = 170k+Continuing the current upwards trajectory, using Fibonacci trend analysis, we'll reach BTC's peak for 2025 @ 130-135k within the next few months.
By the end of the month / beginning of 2026, BTC will be back to 100k - this is where this strategy begins.
Enter @ 100k between the 78.6% and 100% Fibonacci levels, setting a comfortable SL down to the 61.8% Fibonacci level @ 80k. Over the course of 3-6 months we'll then reach the first peak of 2026 at the 178.6% level @ 150-160k . Close.
From this point, timelines rely purely on consistency, however considering Bitcoin's adoption and rate of growth, an upwards trend is guaranteed.
We wait for price retraction down to 120-125k near the lower 127.2% Fib level and enter. SL down at 100% Fib level @ 100-105k. Next peak for 2026 is 170k and above , possibly creating a top @ 200k.

BTCUSD - Smart Money Trap Before the Next Move?1. Market Structure & BOS (Break of Structure):
We can observe multiple BOS levels around July 10–12, signaling a strong bullish transition.
2. Break of Structure (BOS)
Definition: BOS occurs when price breaks above a previous swing high with conviction.
Application on Chart: The BOS on July 11 marked the continuation of bullish market structure.
This indicated strong buying pressure, often driven by institutional order flow.
📉 3. Fair Value Gap (FVG)
Definition: A Fair Value Gap is an inefficiency or imbalance in the market where price moves too quickly, skipping potential orders.
On Chart: The FVG is present between July 11–12.
Expectation: Price often returns to these zones to “rebalance” or mitigate orders before continuing the trend.
Educational Note: FVGs act as magnet zones and are often used to identify entry points or liquidity pools.
💧 4. Liquidity Sweep
Definition: A liquidity grab occurs when price spikes above a recent high or low to trigger stop-loss orders before reversing.
On Chart: Just above resistance, a liquidity grab took place.
Purpose: Institutions often sweep liquidity before large moves to fill larger orders.
🔹 Resistance & Supply Zone:
The resistance area between 122,150–123,500 has held firmly, causing a notable correction.
This region aligns with institutional order blocks, suggesting potential smart money selling.
🔹 Support & Demand Zone:
The nearest support zone lies at 115,984, marked by previous consolidation and BOS.
Price is likely to revisit this zone, acting as a retest for demand re-entry, providing a strong buy-side opportunity if confirmed.
🔹 Current Price Action:
BTC is consolidating around 119,253, with a possible liquidity sweep above short-term highs.

BTC 1H – Make or Break at SupportBitcoin has retraced into a previous demand zone after rejecting from local resistance. The 1H Stoch RSI is fully oversold, hinting at a potential bounce — but a clean break below $116K could send us down to the next base around $111K. Eyes on reaction here.

Quick SHORT (TIGHT STOP) After the bullish run up, looking for this to retrace and then consolidate until further notice

Bitcoin ($BTC): The Current Run Targets In Sight - 7/18/2025CRYPTOCAP:BTC has cleared all chart levels (listed), riding a textbook BCU (abc) wave to new highs! Momentum’s conservative, and abc targets are in sight: $127,845–$133,000. Let’s see how this unfolds at these levels!

Bitcoin Forecast 🔁 I use a unique time-based cycle method built around the universal law of 3-6-9:
3 = Impulse wave
6 = Correction
9 = Cycle end
we are at the higher time frame cycle 9
each cycle of the 3, 6 ,9
contain a smaller one 3 ,6 , 9
This isn’t just about charts — the number 9 governs all natural cycles:
Pregnancy, learning, lunar cycles, economic growth, etc.
---
🗓️ These are the key monthly turning points I track every year:
> Jan 8 – Feb 7 – Mar 6 – Apr 5 – May 5 – Jun 4 – Jul 2 – Aug 1 – Aug 31 – Oct 30 – Nov 29 – Dec 6
📍 This month, July 2nd was a critical time pivot. From there, Bitcoin entered a new time cycle.
📌 Time Is More Powerful Than Price
Most traders focus on price action, waves, or indicators…
But the reality? Time is the real market driver.
⏳ Entry signals based on time outperform those based on price.
Why? Because price is a reaction — time is the cause.

BTCUSD 4h – Chart updated with possible reaction zones📉 Channel adjusted to real price action.
Watching:
🔹 Top of the channel
🔹 EMA100
🔹 Flat base near 115.7
Just structure – no signal.
#BTC #CryptoTA #MarketLevels #DYOR
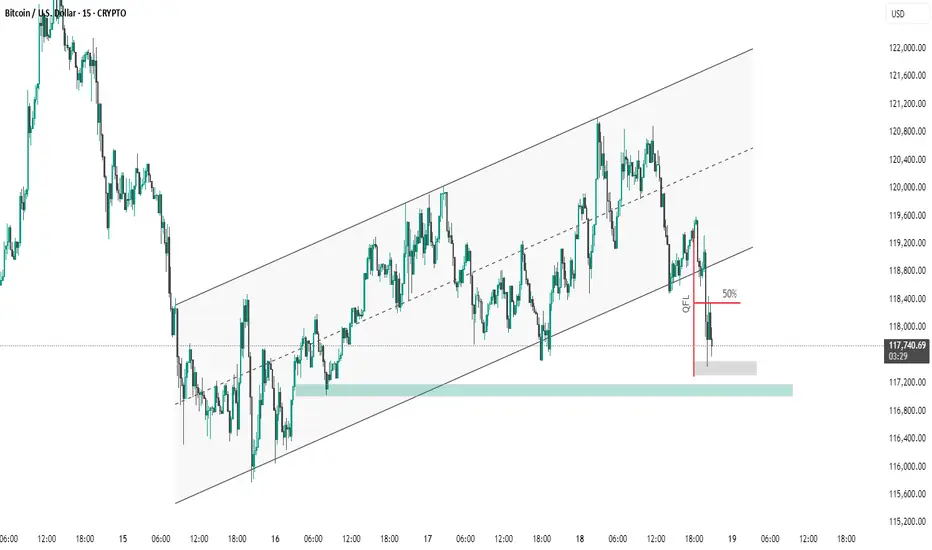
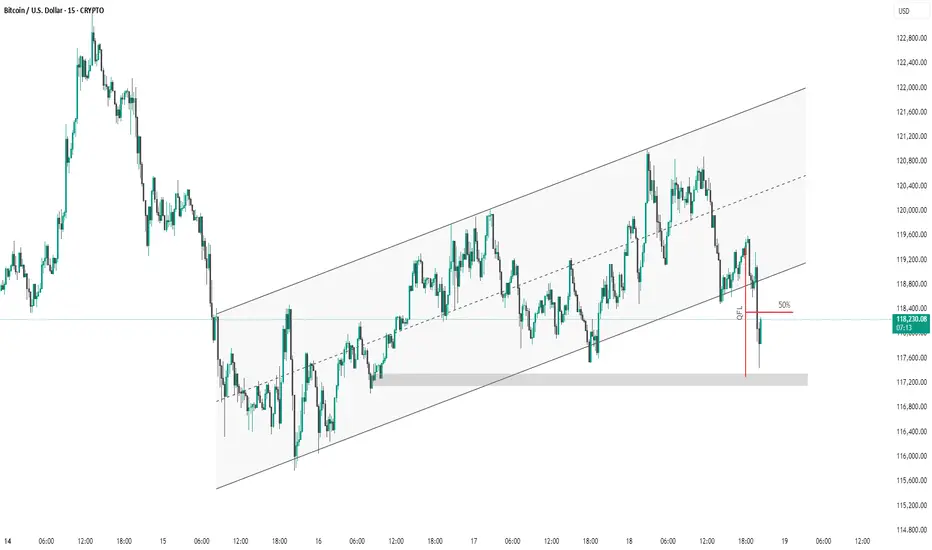
BTC #Short Note on BTC/USD (15-Min Chart):Short Note on BTC/USD (15-Min Chart):
Bitcoin recently broke down from an ascending channel, signaling a shift in momentum. After forming a QFL base, price failed to hold above the 50% retracement level and is now testing a key demand zone around $117,200. A bounce from this level is possible, but a breakdown below may open the path toward $116,000–$115,000. Short-term bias remains bearish unless the 50% level is reclaimed.
thanking you
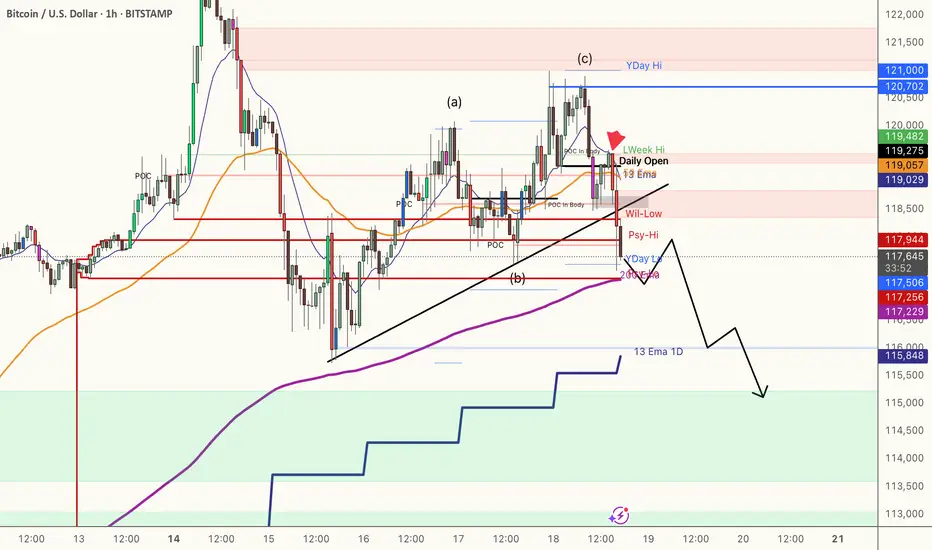
BTCUSD shortAfer breaking the corrective ABC structure, we will at least move bearish forward the previous low. We could see a bigger corrective structure
Last chance to make profit from BTC with buying positionBullish flag
Strong resistance breakout
2 bull points
Position trade spot buying
Bitcoin completing timecycle on oct 2025 after that it would be 4th time if market again crash for around 70%
Manage your risk in both future and spot trading
Note: NO analysis would 100% profitable trading is the game of probability and risk management so follow your trading plan with proper risk reward and win rate.

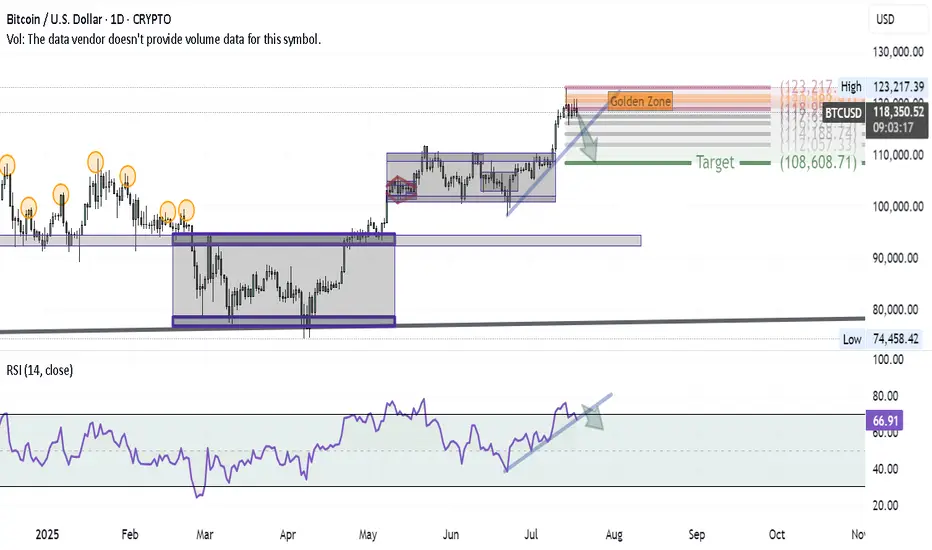
Bitcoin Correction Unfolding — First Wave in MotionAfter successfully hitting the BITCOIN target and anticipating a major correction in my previous ideas, here’s how the first wave of that correction is shaping up on the daily chart:
1- At the recent high, a Shooting Star candle formed — a classic reversal signal.
2- Using Volunacci analysis, the price retraced exactly to the Golden Zone, validating the first leg of the pullback.
3- The next step? A breakdown of the blue trendline would likely send us toward the Volunacci target at $108,600.
4- For confirmation, we're watching the RSI trendline — if it breaks down as well, it would strongly support the bearish continuation.
The setup is clean and developing as expected — it's all about following price and letting the chart guide the story.
BTC #15-minute BTC/USD chart This 15-minute BTC/USD chart shows price action within an ascending channel. Recently, Bitcoin broke below the channel's midline and dipped to a key demand zone (highlighted in grey), triggering a liquidity grab (marked as "GFL"). Price has since retraced to the 50% level of the drop, which may act as resistance. A failure to reclaim the channel could indicate further downside.

BitcoinBullish momentum short term based as the initial direction is bearish movement. With cot report indicationg long term bearish momentum.

Is Genius act , really genius ?!In my view GENIUS act is really harmful for crypto. It will force stablecoin issuers to buy a huge amount of U.S. treasuries/debt to stay in the U.S.
For the largest stable coin tether, we have two scenarios here:
1. Tether complies:
If the largest stablecoin, Tether, complies, the entire crypto market will become tightly bound to the U.S. economy. So, if the U.S. economy takes a dive, crypto will follow—hard. We already see correlation, but this will supercharge it.
On top of that, a crypto selloff could trigger one of these stablecoins to go bankrupt, forcing them to dump their U.S. treasuries, which would send shockwaves through the U.S. economy itself.
2. Tether refuses:
If Tether rejects this requirement, the U.S. might ban it. That could trigger a massive market crash. Worse, Tether might start to depeg from the dollar, like Luna did — and we all remember how that ended: absolute bloodbath.
Also it's fun to know how Chatgpt as an unbiased viewer thinks about genius act and it's relation with alt coins pump :
1. “Regulation = legitimacy” hopium
People see the GENIUS Act and think:
"OMG crypto is finally legal in the U.S. Let’s YOLO into everything that’s not a stablecoin!"
So even though the law targets stablecoins, it gives the illusion that altcoins are now “safe” to buy. Spoiler: they’re not.
2. USDC & Tether under pressure → people rotate into altcoins
Smart money’s thinking:
"If stablecoins get frozen or boring, let's ride the volatility wave elsewhere."
➡️ So they ditch stablecoins or high-cap BTC/ETH and ape into altcoins for bigger upside (or gambling addiction, whichever).
3. Low-cap alts pump on hype & narrative
Always happens. Whenever a big regulatory event hits:
ETH L2s pump (Polygon, Arbitrum)
Privacy coins get spicy (Monero, Zcash)
Meme coins go nuts (because why not)
Layer-1s and DEX tokens get love (Solana, Avalanche, Uniswap)
Everyone's front-running some imaginary future utility.
4. Retail sees green candles and FOMOs in
You know how it goes:
Twitter says “GENIUS Act = bullish for crypto”
TikTokers scream “ALT SEASON BABY 🚀”
People ape into garbage with 12 commas in the name
So prices go up. Until they don’t.
⚠️ WARNING: This pump is not based on fundamentals
It’s pure:
Misinterpretation
Speculation
Short-term rotation
a sprinkle of dumbass energy
It can reverse fast if market digests the actual legal implications.
Altcoins are pumping because people mistakenly think regulation = approval = pump season. Also because crypto traders have the attention span of a goldfish on Adderall.


BTC #15-minute Bitcoin (BTC/USD) chart This 15-minute Bitcoin (BTC/USD) chart shows price action within an ascending channel. Recently, the price broke below the midline and touched the lower channel boundary, bouncing back slightly afterward. A marked "QFL" (Quick Flip Level) zone with a 50% retracement is highlighted, suggesting a potential area of interest for buyers or a price reaction point. The shaded region indicates strong demand/support around the $117,200–$118,000 range. A breakdown below this support could signal further bearish momentum.
thanking you

Will this be the first proper alt szn since 2020?Altcoins are waking up. While Bitcoin has surged over 600% since 2022, Ethereum and smaller coins have lagged behind. But that might be changing. With ETHBTC breaking its downtrend, BTC dominance dropping, and political momentum building around crypto regulation, the stage could be set for a true altcoin season. In this video, we break down the charts, the trends, and what could come next. Is this the real deal or just another fakeout? Let me know what you think.

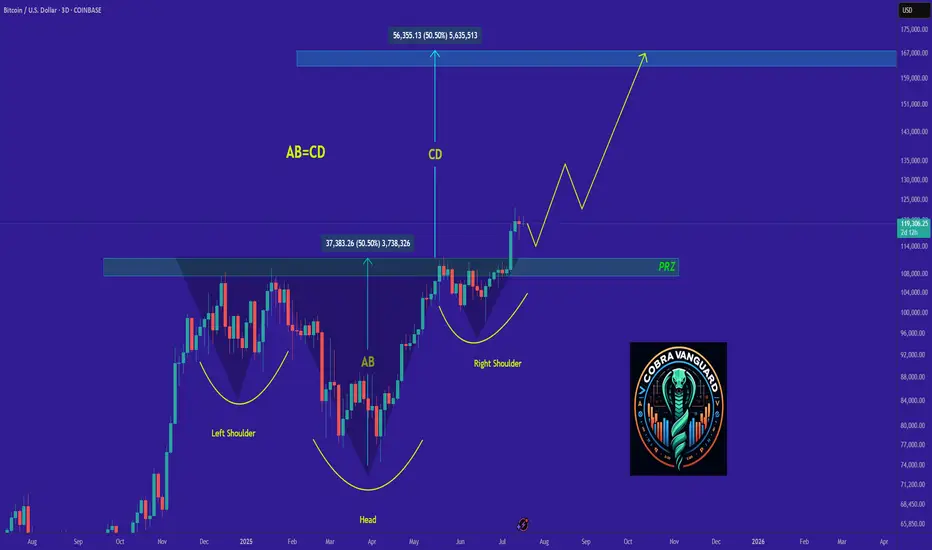
Bitcoin is bullish now & many Traders don't see it !!!I might be wrong and this might never happen, but it might come true From a technical perspective!!!
Remmember
Stay Awesome , CobraVanguard.
BITCOIN Entering Cyclical Profit Zone. Risk should be limited.Bitcoin (BTCUSD) has just entered the first level of the Logarithmic Growth Curve (LGC) Resistance Zone, which is the light pink band. The Top of the previous Cycle was priced at the top of the band just above this.
In fact every BTC Cycle had this as the 'Profit taking Zone'. The market marginally touched that also within December 2024 - January 2025 but got rejected, almost in similar fashion as January 2021, which was a Double Top approach of the peak formation during the previous Cycle.
This Cycle Top is expected to be within October - November 2025, so we call this the 'Profit Taking Zone' for a reason. Risk exposure from now on should be getting more and more limited. Peak range (depending of the nature of aggression of potential Rate Cuts in September) could be anywhere within $140 - 200k.
Do you think this is the time to start limiting BTC exposure, perhaps moving some of the huge profits to alts? Feel free to let us know in the comments section below!
-------------------------------------------------------------------------------
** Please LIKE 👍, FOLLOW ✅, SHARE 🙌 and COMMENT ✍ if you enjoy this idea! Also share your ideas and charts in the comments section below! This is best way to keep it relevant, support us, keep the content here free and allow the idea to reach as many people as possible. **
-------------------------------------------------------------------------------
💸💸💸💸💸💸
👇 👇 👇 👇 👇 👇
