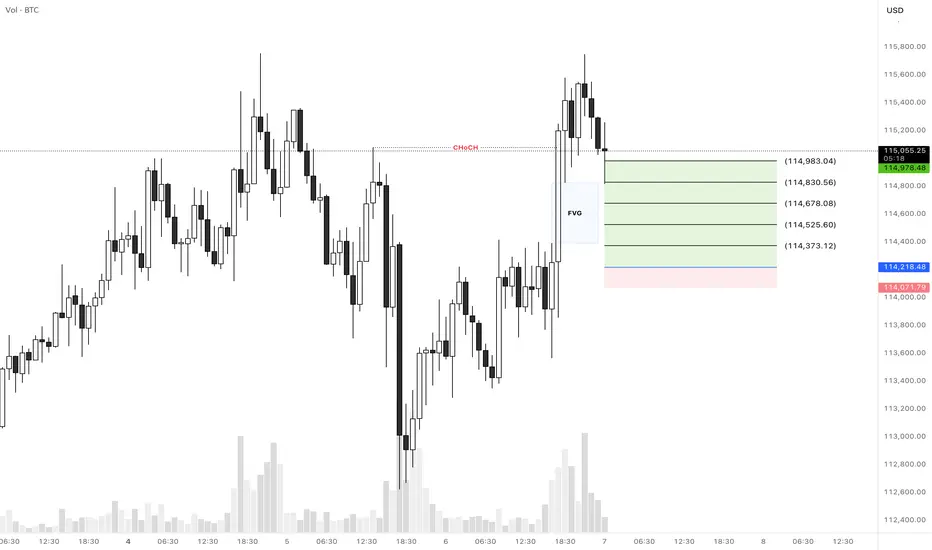
BTCUSD Long SetupHello everyone.
We have a CHoCH in 1H TF that it left a FVG area and it was touched a minute ago...
Let's see how does it reacts to this FVG area and if it didn't push the price up then we can expect our entry is valid...
Another thing that we should consider is that we're in down trend in 4H TF and the price didn't break the previous high for a CHoCH, so this trade would be a little risky so please consider the risk management...
Let's see what happens...
Good luck
BITCOIN trade ideas
BTCUSD 8/6/2025Come Tap into the mind of SnipeGoat, as he gives you a quick Market Breakdown of Bitcoins current Price Action. What is Price doing? Where is Price going? Come find out....
_SnipeGoat_
_TheeCandleReadingGURU_
#PriceAction #MarketStructure #TechnicalAnalysis #Bearish #Bullish #Bitcoin #Crypto #BTCUSD #Forex #NakedChartReader #ZEROindicators #PreciseLevels #ProperTiming #PerfectDirection #ScalpingTrader #IntradayTrader #DayTrader #SwingTrader #PositionalTrader #HighLevelTrader #MambaMentality #GodMode #UltraInstinct #TheeBibleStrategy

BTCUSD Technical Analysis – Supply Zone RejectionBTC/USD is currently reacting strongly to a visible supply zone around the $115,000 – $115,648 area, showing clear signs of rejection after testing that zone multiple times. This rejection aligns with the high-volume area on the visible range.
🔹 Key Levels:
🔵 Resistance Zone (Supply): $115,000 – $115,648
🔵 Mid Support: $113,975 (Previous structure zone)
🟠 Demand Zone: $112,391 – $112,700 (High interest buy zone with visible order blocks)
🔻 Bearish Expectation:
If price continues to respect the supply zone:
First Target: $113,975 – Minor support, may cause temporary bounce.
Second Target: $112,391 – Stronger demand area, possible bullish reaction expected here.
Red arrows mark the potential path BTC may take if bearish pressure holds.
⚠️ Note:
A break above $115,648 invalidates the bearish setup.
Wait for confirmation (e.g., bearish engulfing or break of structure) before entry.
📌 Trade Idea:
Sell Setup:
Entry: Near $115,000–$115,600
SL: Above $115,700
TP1: $113,975
TP2: $112,391
🔁 Follow for more BTCUSD supply/demand-based updates.
📊 #Bitcoin #BTCUSD #CryptoAnalysis #PriceAction #SupplyAndDemand #SmartMoney #TradingView

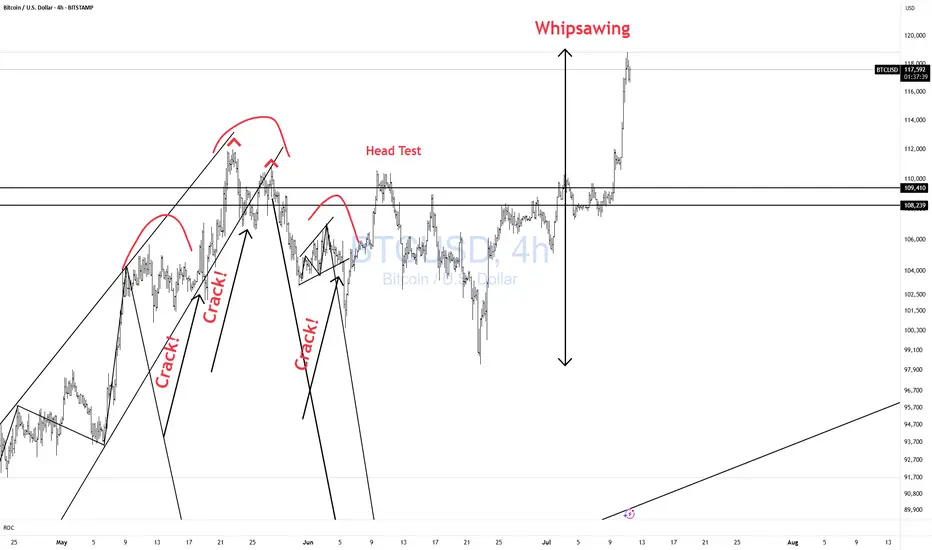
BTCUSD Whipsawing! CAUTION!Bulls CAUTION! Price is whipsawing all over the place.
Better to be out of the market wishing you were in than in wishing you were out!! Don't chase!!
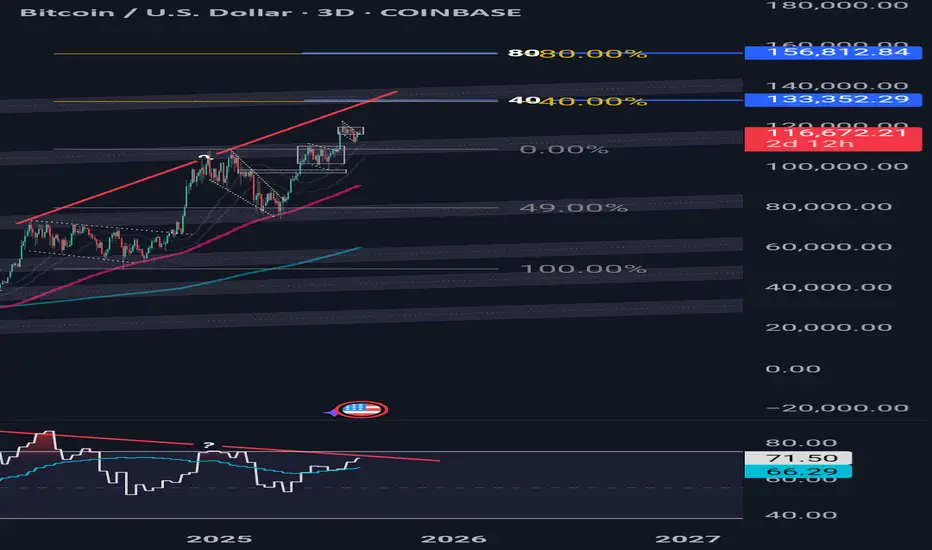
Bitcoin Still Going Strong...For nowBitcoin has been pushing up strongly since the start of the cup & handle in Oct-Nov of 2024.
But Bitcoin is showing weakness, where the bull flags you see on my chart are getting smaller the higher btc goes.
There is also negative divergence showing on my rsi, also signaling signs of weakness.
I do believe we are still bullish for now. But the first area to keep an eye on is between 133k-140k. If Bitcoin gets their I'll start to look for any shorting opportunities.
“Disclaimer: The information provided is NOT financial advice. I am not a financial adviser, accountant or the like. This information is purely from my own due diligence and an expression of my thoughts, my opinions based on my personal experiences, and the way I transact.
BTCUSD LongThe broader market structure on BTCUSD remains bullish following a clean Change of Character (CHoCH) at 119,839, which signaled the end of the previous downtrend. This was later confirmed by a Break of Structure (BOS) to the upside. After forming a higher low near $111,903.68, price has steadily climbed, creating a sequence of higher highs and higher lows. This structure suggests the market is in a bullish continuation phase.
A strong demand zone is evident between $113,800 and $114,400, where buyers previously stepped in aggressively, leading to a sharp rally. The price barely consolidated in this area before moving upward, confirming it as a solid zone of interest. Above current price, there's a large supply zone between $118,400 and $119,600, where price last dropped sharply—indicating strong selling pressure.
Currently, price is trading around $115,300, just below the 0.5 retracement level at $115,871, and has printed bullish momentum candles into this resistance area. The most likely price action is a pullback into the green demand zone ($114,400–$114,000) before resuming upward toward the supply zone around $118,400–$119,600.
Trade bias: Bullish
Expected direction: Upward after a possible pullback
Invalidation level: Break below $113,800 would invalidate short-term bullish bias
Momentum condition: Momentum currently favors buyers, with strong bullish candles and higher lows
Candle behavior: No signs of exhaustion yet, indicating strength in the move

Bearish Divergence on Bigger tf
CMP 105228.47 (02-06-2025)
Bearish Divergence on Bigger tf (Cautious
approach should be taken).
However, if 109350 is Crossed, we may
witness 115000 & then 120000 - 121000.
and if 112000 is crossed & sustained, be ready
to get New Highs :-)
Lets be more cautious & dig out 3 Important
Support Levels.
S1 around 103000 - 102500
S2 around 97800
S3 around 93400 - 93500.


Bitcoin Bull Flag - will it collapse?Bitcoin is currently in a bull flag.
Will it hold — or collapse?
The weekly close will decide.
🔹 If BTC closes above the bull flag support: Possible continuation of the rally.
🔻 If BTC closes below the flag: Expect a deeper correction.
Stay sharp. The weekly close is key IMO.
No FA. DYOR! For educational purpose only.

BTCUSD SHOW WEEKNESS & BEARS ARE GETTING READY TO TAKE OVER As explain on the chart, im looking to see if we BREAK SUPPORT mention on the chart
Once we take that SUPPORT i will go for SELL
Will update as soon i go in
Good weekend everyone :)

Bitcoin Forming a New Range?After all of the ups and downs over the past few days, I zoom out to a higher time frame to get a grasp of what's really happening. With three hours or so left in the day it looks most likely that the formation of a new range is in the works. I'm looking for two options over the next few hours, one being that it gets right back into the previous range and is all just a wick on the weekly chart which caused three days of panic for absolutely no reason. This would probably be hilarious but also the less likely outcome!

Inflection Zone, Do or Die levelI've drawn up a couple of major pivot points that I expect BITSTAMP:BTCUSD to consolidate at before continuing either up or down.
The market is in my opinion currently feeling a little bit confused and not quite fearful yet but a little bit doubtful anyway. The melt up has been real, and for some painful, as directional movement is at most only half of what matters. So this injection of volatility is welcomed at least by me, and I've been fairly exposed to growth stocks in my port lately.
Based on fibonacci phi channels and other confluences of support locations, it looks like we've turned a corner and are on the way down, but I'd be surprised if we breached 107k and as shown, if that did happen, there is a LOT of underlying supply.
I don't know where we go from here but I wanted to point out this level highlighted in light blue, as its historically been a major line in the sand for BTC.

btc consolidation and downentire bull market has been big impulse move up then consolidation and slightly more down than would be expected with typical bull flag

Potential Roadmap for BTC/USD In the next 30-40 daysVolatility incoming. It seems like BTC/USD is heading down to sweep some liquidity range at around 107-110,000.
However, market will recover after that, we are still in the "buy the dip" scenario.
End of August, I can personally still bet that BTC will sit higher than the current level

BTC PERPETUAL TRADE ,Short from $113,700
BTC PERPETUAL TRADE
SELL SETUP
Short from $113,700
Currently $113,700
Stoploss $116,800
Targeting $111,600 or Down
(Trading plan BTC go up to $115K
will add more shorts)
Follow the notes for updates
In the event of an early exit,
this analysis will be updated.
Its not a Financial advice

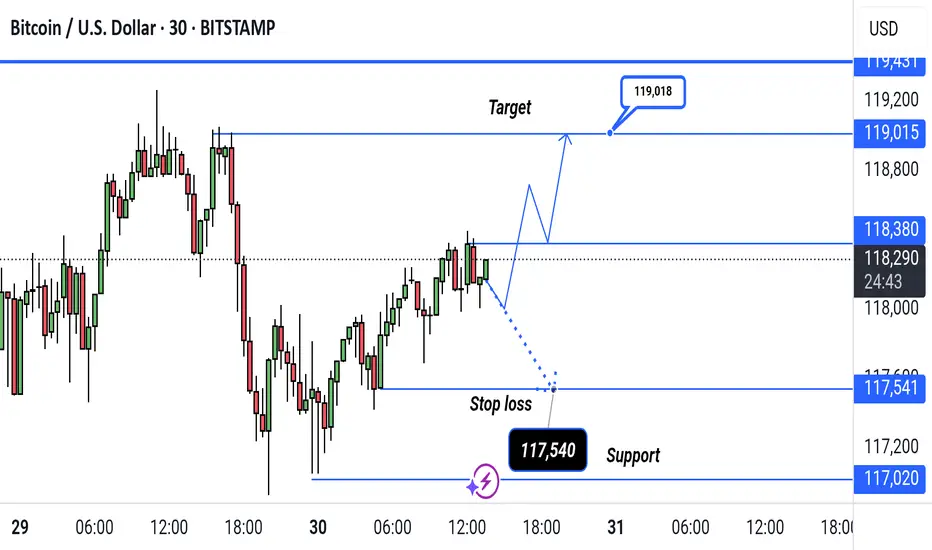
BTC/USD Bullish Breakout Setup – Targeting 119,018BTC/USD 30-Min Chart Setup:
Price is currently at 118,271, approaching resistance at 118,380. A bullish breakout could target 119,018, while a drop below 117,540 (stop loss) may signal downside toward support at 117,020.
Gaussian and the LMACD deep dive!As you can see LMACD is showing signs of exhaustion. Histogram has been compressing or decreasing in momentum while the price has been climbing up. This divergence wont last for too long and a change in the trend seem very likely. BTC might be entering in the bear market pretty soon and you might start seeing the histogram turning red and increasing in bearish momentum before changing the trend once we approach to the core of the Gaussian or even bellow this time. Breaking bellow the core would mean range bellow 40k as bear market bottom.
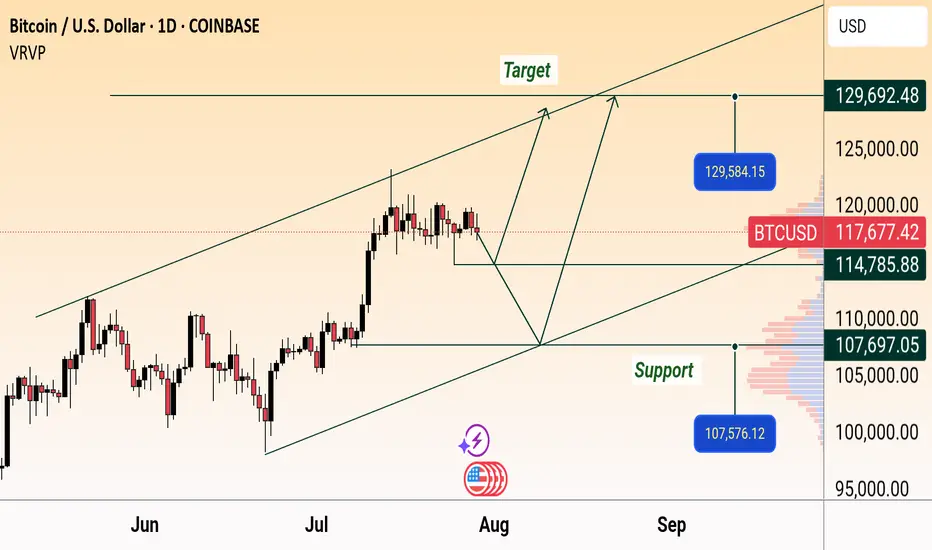
BTC/USD Daily Outlook: Support & Target Levels IdentifiedBitcoin (BTC/USD) Daily Chart Analysis:
Price is currently at $117,758.70, showing a slight decline. Key support levels are marked at $114,785.88 and $107,576.12, while targets are projected near $129,584.15 and $129,692.48. Chart suggests a possible upward channel, with both bullish and bearish scenarios mapped.
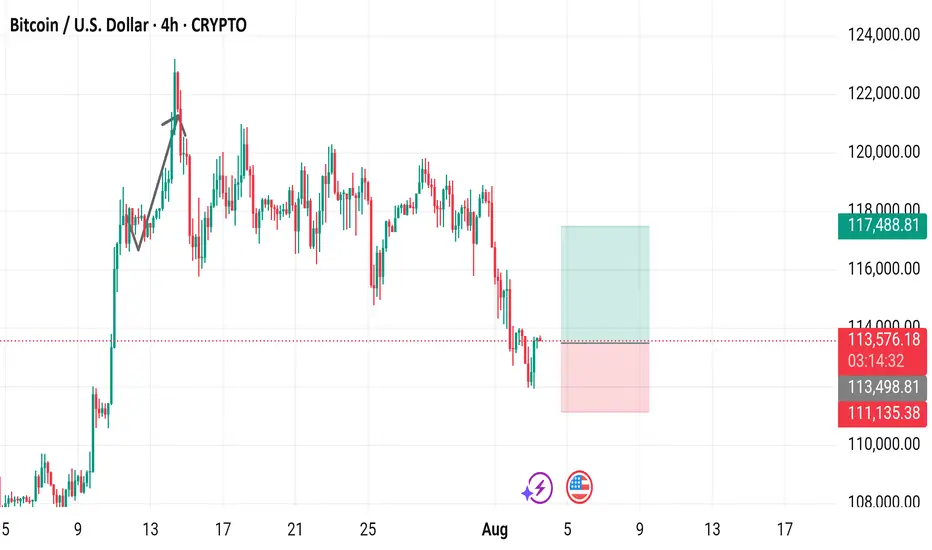
Bitcoin / U.S. Dollar 4-Hour Chart (BTCUSD)4-hour chart displays the price movement of Bitcoin (BTC) against the U.S. Dollar (USD) from late July to August 3, 2025. The current price is $113,570.31, with a 24-hour change of +$1,064.77 (+0.95%). The chart shows a recent upward trend followed by a sharp decline, with key levels marked at $113,570.31 (buy/sell price) and $111,135.38 (support level). The trading volume and price range are highlighted, with a notable drop below the $113,570.31 level as of 03:16:00 on the chart.
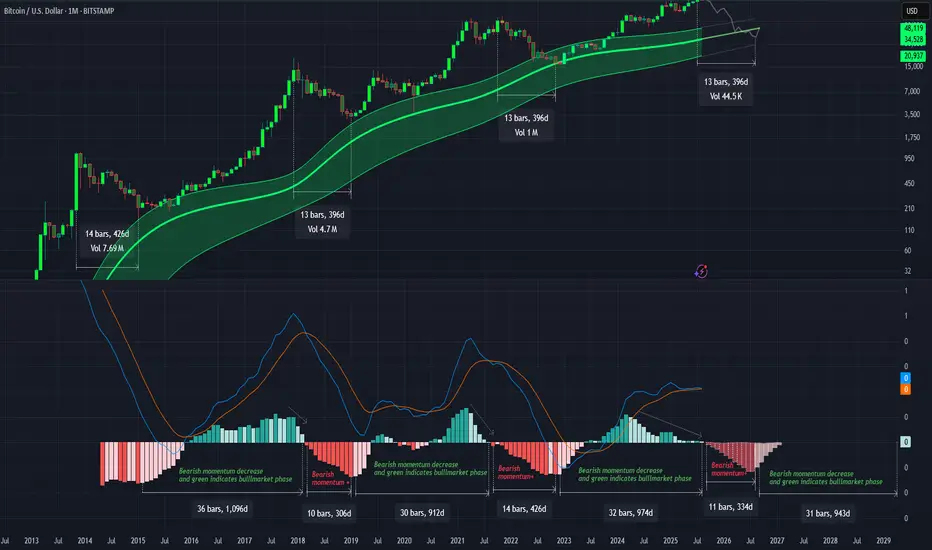
Bitcoin’s Bull Run: Is There Still Fuel in the Tank?Bitcoin has had an impressive year, breaking out of a downward channel and launching into a strong upward rally as we saw in the previous idea .
But now, price action is slowing, and many are asking: Is the bull run over or just taking a breather?
Let’s look at what the chart tells us.
📈 A Classic Bull Flag in the Making
After the breakout, BTC seems to be forming another channel or what traders often call a bull flag . This is typically a bullish continuation pattern , meaning that after a short consolidation, price may break upward again.
But that’s the technical side. What about the big picture?
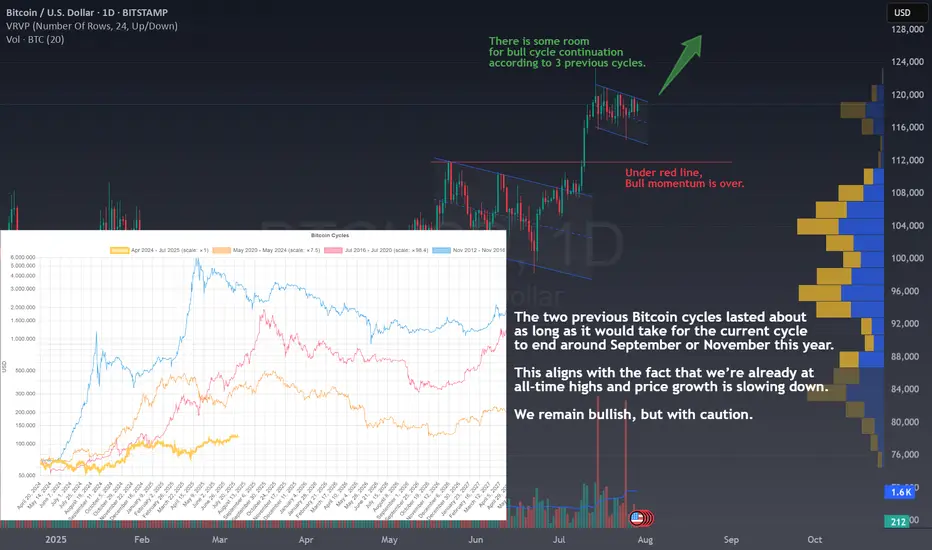
🔁 Bitcoin Cycles: History Rhymes
In the chart below the price, we see a comparison of Bitcoin’s last two cycles (shown in red and orange). Interestingly, both of those cycles point to end between September and November this year.
If history repeats, or at least rhymes, the current cycle could follow the same timeline. That gives us a few more months of potential upside before this bull run starts cooling off.
Note that the first cycle peaked faster, but also had a mini bull momentum in the same zone where the next cycles peaked.
⚠️ Still Bullish, But Watch Your Step
Even though we’re near all-time highs and price is showing signs of slowing, there may still be room for growth. However, the risk is increasing, so this is a time to stay bullish but with extra caution.
A key level to watch is marked in red on the chart. Falling below it could mean the bull momentum is fading. The reason is quite simple, a bull rally can't trade inside prices of previous consolidation phases because that means lateral or bear momentum.
🧠 Final Thoughts
Bitcoin has a history of repeating patterns, and right now, we seem to be tracking closely to previous cycles. With a potential breakout forming and a few months left on the clock, there could still be opportunities ahead.
But don’t forget: every cycle ends. Stay alert, manage risk, and don’t chase green candles blindly.
💬 Does this setup align with your view on BITSTAMP:BTCUSD ?
🚀 Hit the rocket if this helped you spot the opportunity and follow for more clean, educational trade ideas!
Bitcoin Found Support at $112kAfter making a new all-time high at $123,000, Bitcoin fell back down to test the previous high at $112,000 as expected in the previous post. In technical analysis, previous resistance tends to become support and for now we are seeing that $112k level hold as support with price bouncing up off it today and is trading back above $114k. We currently have the 50-day price average(50sma) right at that $112k level adding extra support for price as well.
As for the lower price indicators:
The PPO is showing the green PPO line holding above the 0 level which indicates that long-term momentum remains bullish. For short-term price momentum to turn bullish we would need to see the green PPO line cross back above the purple signal line.
The ADX indicator shows the purple -DI line rolling over after rising, and the green +DI line is beginning to rise indicating that the bear strength is weakening, and the bull strength is increasing. For long-term bull strength, we would need to see the green +DI line cross back above the purple -DI line, and for the background histogram bars to rise.
The TDI indicator shows the green RDI line holding above the 40 level which keeps the long-term bull trend intact. Generally, you want to see the RSI line trending between 40-80 as a sign of trend strength during a bull market. The green RSI line is also crossing back above the lower Bollinger Band after briefly crossing below it during the decline. In general, price will continue to decline when the RSI is below the lower BBand so getting back above that level is nice to see here. Next we would want to see the green RSI line move back above it's purple signal line, and back into the upper half of the Bollinger Bands.
I bought the dip into the $112k-$113k level as I expect this level to hold as support going forward. Next up, we're likely going to see a re-test of resistance at the new all-time high of $123k. From there, I'm still expecting a test of the 1.618 fibonacci extension at $135k.

BTCUSD Short-Term ScenariosIn this video, I have explained why I believe that in the short-term I expect bitcoins price to correct to 107000-108000 zone before gaining power and momentum to see new ATH. Note that the invalidation levels explained in the video are to be closely monitored.

BTC about to dump, 88k must hold or else...BTC is testing support in the 116k area RN, it wont hold, so next support 97-98k. iI have the feeling this will not hold and a set up for an 88k cliffhanger is incoming.
