BTCETH parabolic run pointing towards 100:1Historically, during bull markets, Ethereum frequently surpassed Bitcoin at various moments.
However, this time around, that trend has not materialised, leading to a decline in investor confidence.
With capital exiting the ETH market, sentiment has soured, and critical indicators are revealing significant losses.
Unless a robust bullish turnaround occurs, Ethereum's struggle may persist, as the market currently favors Bitcoin as the more secure option.
However once this parabola breaks, we could see a strong snap back reaction in favour of the more riskier #ALTS, #DEFI and #MEMES as #ETH is still the home for stablecoin issuance and still the most trusted secure smart contract blockchain available.
BITCOIN trade ideas

Huge Ready BTCAs we learn at start, trend is your friend... :)
Here is our friend, singing as some good song.
Thank you.
Wishing you great week! :)

BTC CONSOLIDATESBitcoin may be forming a *lower high* on the daily chart, with the most recent rally stalling at \$110,000 – just below the previous high near \$112,000. That failure to reclaim the prior high is an early sign of weakening momentum and suggests the strong uptrend that’s been in place since April might be losing steam.
The critical level now is \$100,000. That’s the most recent swing low, and it serves as the key structural support in this current move. A daily close below that level would confirm a *lower high–lower low* sequence, shifting the short-term trend from bullish to neutral or even bearish. If that happens, downside targets open up around \$97,000 – the next clear support – followed by \$95,500, where the rising 200-day moving average now sits.
Momentum indicators support this caution. RSI is trending down and making lower highs, showing a loss of bullish strength. Volume has also declined during recent rallies, hinting at buyer exhaustion rather than healthy consolidation.
For the bulls to retain control, the 50-day moving average near \$103,000 needs to hold. If that level fails, a test of \$100,000 is likely. On the flip side, a strong move back above \$110,000 would invalidate the lower high setup and put the breakout narrative back in play.
Right now, the market is at a decision point. The trend hasn’t broken yet, but structure is starting to crack. A confirmed lower high at \$110,000 – followed by a break below \$100,000 – would mark the first significant trend shift on the daily chart in months.

BTC is reviving for a new bull runBTCUSD is correcting to 108000 as it hits the sell zone at 101200. At 108000 it is quite clear to set up BUY signals. Another area to watch for BUY is 106500. BUY SL points are not above 700 price for BTC. Currently the uptrend is still going to continue so any pullback to support is considered a buying opportunity.

BITCOIN Megaphone is the last step before $150k.Bitcoin (BTCUSD) is repeating almost to the exact point the 2023/ 2024 uptrend, as right now it is in the process of forming a Megaphone pattern similar to the one during December 2023 - January 2024.
Before that, both patterns started the uptrend when a 1D Death Cross formed the bottom. After the 1st Bullish Leg, a Channel Up on a 1D Golden Cross marked the transition to the 2nd Bullish Leg that eventually led to the Megaphone.
In 2024, when BTC broke above the Megaphone, it started the final Bullish Leg that peaked a little above the 1.786 Fibonacci extension from the bottom. During that process, the 1D RSI sequences among the two fractals have been similar.
As result, aiming for the $150000, which is marginally below the 1.786 Fib ext, is a solid target.
Do you think the pattern will continue to be repeated? Feel free to let us know in the comments section below!
-------------------------------------------------------------------------------
** Please LIKE 👍, FOLLOW ✅, SHARE 🙌 and COMMENT ✍ if you enjoy this idea! Also share your ideas and charts in the comments section below! This is best way to keep it relevant, support us, keep the content here free and allow the idea to reach as many people as possible. **
-------------------------------------------------------------------------------
💸💸💸💸💸💸
👇 👇 👇 👇 👇 👇

BTC to go below 95K and then shoot up to make historyBTC to go below 95K and then shoot up to make history. So the somewhere near 94500 to 95000 the BTC will take support and the move upward and make history

BTC - UH OH ? - RE CORK THE CHAMPAGNE ? Last night the momentum was so strong , and resistance levels where being taken out one after another. Today when we should have been making new highs, instead we hit a wall. Not good. That wall in yellow is the 7/8ths reflection line. The bounce backward from here could pick up massive steam downward. The 1st stop loss has already been hit, #2 and #3 look to be tested today, and from the way things look now, they look to yield. I am stopped out, and will not reenter long until a new high is made. Good Luck!

BTCUSD Weekly TF Bullish ConfirmationsAfter price broke out of a bullish flag it retested a newly formed weekly demand zone. All this confirmations on a high timeframe are strong indications that pressure is still to the upside and will likely continue to be so for some weeks to come

BTC Retest key levelBTC almost touched previous high, had correction after taking liquidity, now retracing looking for nearest support, $106,800 or fibonacci 0.618, break or bounce play level to level

BULLISH ANTICIPATION● Higher Time frame (monthly)orderflow = Bullish
● HTF KEY LEVEL = monthly +OB
● ITF (daily)= Breaker block @ monthly key level.
PURGE ✅
CISD ✅
FVG ✅

Evening BTC Trend Analysis and Trading RecommendationsDuring the morning session, the Bitcoin price continued its upward momentum from the previous night, surging to an intraday high of 110,653. Subsequently, as bullish momentum gradually waned, the price entered a volatile downward channel. Consecutive bearish candles triggered a significant retracement of earlier gains. In the afternoon, supported by the hourly moving average, Bitcoin saw a brief rebound, climbing to 109,852 as U.S. stocks opened. However, bears quickly regained control, pushing the price down to 108,282 before stabilizing, after which it entered horizontal consolidation. The current price remains around 109,000. Notably, our previous short strategy at 109,800 precisely aligned with the trend, successfully realizing the expected profit.
Current trading advice: Consider light short positions within 109,400–109,700, targeting around 108,500. If the price effectively holds support and stabilizes at 108,500, you may attempt light long positions to speculate on a rebound.
BTCUSD
sell@109400-109700
tp:108500-107500

106.5K and 104.5KMorning folks,
As we've suggested upward action happened. Now overall situation stands relatively easy to understand. 100K seems like short-term vital area for upside tendency. While two support levels of 106.5K and 104.5K are those which market has to hold to keep tendency intact.
I would even prefer 106.5K area because this is also natural support line and because it agrees with downside AB-CD 1.618 extension target.

BTC NEXT TARGET BUY 110K MORE Bitcoin Alert! 🚨
BTC is showing strong momentum and the market is heating up! 🔥
Current levels present a strategic buy opportunity before the next big move.
📈 Targeting $110K–$115K in the coming wave — and the breakout could be explosive.
💰 Accumulate now before the FOMO kicks in.
📊 Smart traders are already positioning.
⏳ Time is limited — don’t watch from the sidelines.
This could be the move that defines the next phase of the bull run.
Stay ahead. Stay informed. Stay invested. 🧠🚀
#Bitcoin #BTC #CryptoAlert #BullRun #CryptoNews #BitcoinTarget #BTCNextMove #CryptoTradin

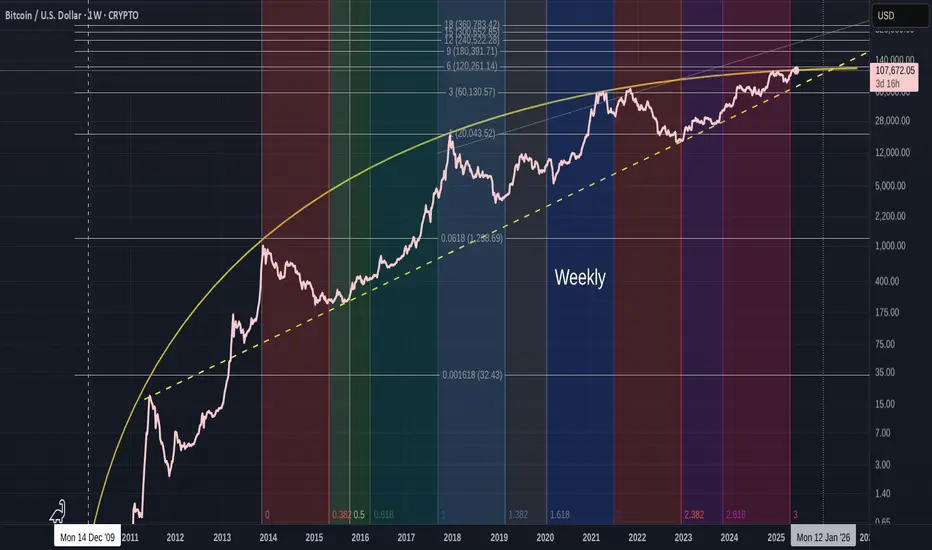
Bitcoin life cycle-stage One ending-Next cycle has to start NOW
There are 3 things to see in this chart
1) The Orange Arc of resistance. I have talked about this previously but to recap a little, it has its origins in Oct 2009 and has rejected EVERY ATH since then, as you can see on the chart. The Arc itself is part of a Fibonacci Spiral.
This Arc has begun to Squeeze PA against the lower trend line, that was formed in 2011.
And we are now in a position where PA MUST react or get pushed below the Long Term line of support.
This could be called Make or Break time for Bitcoin.
The Apex of this pennant is around Jan 2026
PA always reacts before the Apex.....99% of the time.
2) The Vertical Coloured bars are Trend Based Fibonacci Time, It begins on the 1st ATH in the channel that Bitcoin created. This channel is shown in the chart below
See how the Runs to the 2017 & 2021 ATH were all in a Bullish Green zone and how PA never retouched the lower trend line of support in this time
Since Mid 2021, we entered a Bearish Zone.
On the main chart, you will notice how this Fib Time has just ended.
3) The Trend based Fibonacci Extensions. Every single ATH rejected off a Fib extension.
The Root is at the 2009 Low and 1 is at the First ATH in the Bullish Fib time Zone.
The numbers here are all based off the 3,6,9 number sequence.
Lets look a little closer at the weekly chart
As we can see, PA got repeatably rejected off this orange Arc of Resistance and Current PA has been up there, trying to break through since 2024.
Many people have also commented on how PA has been so subdued this cycle and could this be reflected in the Fib Time showing us that we are in a Red Bearish Zone.
See how, from Mid 2021, when we entered a Strong Red zone, PA took a Deep dive off the Nov 2021 ATH.
Also note how this zone ended in late 2022 and in Jan 2023, PA began its current cycle Run. See the change in Colour ?
And Currently, while Bitcoin tries to break out of this squeeze, we were in a Red zone again....that just ended.
AND we can also see that we have not yet reached the 6 Fib Extension at 120,251 usd
The situation we face here is that if PA gets rejected off that Fib line, having just broken through the Arc, we could get pushed right back down under the Arc again. It is VERY STRONG RESISTANCE
This next move from Bitcoin HAS to be strong enough to take us up to the 9 fib line at 180,391 usd at a minimum. This way we can use the 6 Fib extension as support when PA cools off from a big push and so remain above the Arc and begin the Next long term cycle.
The Daily chart below shows us where we are right now
You can see how PA has repeatably tried to break above the Arc and been rejected Firmly Every time...so far, PA has avoided going right back down to the Lower trend line and has remained in near distance to this Arc..But we are running out of Time.
Recent attempts by PA have been Strong and I am sure that we will make it over but the real question is can we also get over that 6 Fib extension and stay above.
The weekly MACD certainly has enough strength to cope
Should we have a subdued Summer trading on Bitcoin, we will see this MACD cool off and be stronger before a sustained push near Autumn maybe.
To conclude, Bitcoin is under pressure to move out of its First Full Cycle.
It is getting Squeezed and now it is time for Bitcoin to prove it can cope with its new found "Adulthood"
The Next Big push, maybe later in the year, could very realistically reach 200K or more and this would place us Above that 9 Fibonacci extension I talked about earlier.
Of course, events could change and we could see PA collapse back below the Arc.
If this happens, all is NOT lost but it would certainly weaken the case for Long Term holders to continue doing so.
This then could create a Snownall effect and prices may tumble....And I will buy MORE....
Either way, we are in a HUGE moment for Bitcoin and I am privileged to be able see this all unfold...
Lets see what happens but, for me, I am Still VERY Bullish though Cautious....
We may have to revisit low 70K in the near future if Pa cannot get over this Arc and the 6 Fib extension
Bitcoin H1 | Falling toward an overlap supportBitcoin (BTC/USD) is falling towards an overlap support and could potentially bounce off this level to climb higher.
Buy entry is at 106,873.50 which is an overlap support that aligns with the 38.2% Fibonacci retracement.
Stop loss is at 105,200.00 which is a level that lies underneath an overlap support and the 50% Fibonacci retracement.
Take profit is at 109,219.00 which is an overlap resistance.
High Risk Investment Warning
Trading Forex/CFDs on margin carries a high level of risk and may not be suitable for all investors. Leverage can work against you.
Stratos Markets Limited (tradu.com ):
CFDs are complex instruments and come with a high risk of losing money rapidly due to leverage. 63% of retail investor accounts lose money when trading CFDs with this provider. You should consider whether you understand how CFDs work and whether you can afford to take the high risk of losing your money.
Stratos Europe Ltd (tradu.com ):
CFDs are complex instruments and come with a high risk of losing money rapidly due to leverage. 63% of retail investor accounts lose money when trading CFDs with this provider. You should consider whether you understand how CFDs work and whether you can afford to take the high risk of losing your money.
Stratos Global LLC (tradu.com ):
Losses can exceed deposits.
Please be advised that the information presented on TradingView is provided to Tradu (‘Company’, ‘we’) by a third-party provider (‘TFA Global Pte Ltd’). Please be reminded that you are solely responsible for the trading decisions on your account. There is a very high degree of risk involved in trading. Any information and/or content is intended entirely for research, educational and informational purposes only and does not constitute investment or consultation advice or investment strategy. The information is not tailored to the investment needs of any specific person and therefore does not involve a consideration of any of the investment objectives, financial situation or needs of any viewer that may receive it. Kindly also note that past performance is not a reliable indicator of future results. Actual results may differ materially from those anticipated in forward-looking or past performance statements. We assume no liability as to the accuracy or completeness of any of the information and/or content provided herein and the Company cannot be held responsible for any omission, mistake nor for any loss or damage including without limitation to any loss of profit which may arise from reliance on any information supplied by TFA Global Pte Ltd.
The speaker(s) is neither an employee, agent nor representative of Tradu and is therefore acting independently. The opinions given are their own, constitute general market commentary, and do not constitute the opinion or advice of Tradu or any form of personal or investment advice. Tradu neither endorses nor guarantees offerings of third-party speakers, nor is Tradu responsible for the content, veracity or opinions of third-party speakers, presenters or participants.

BTC Buyopen 107962
SL 107275
daily, 4hr, 1hr
Price above 200 EMA
daily, 4Hr
price above ATR
1hr
price on fib level
price fractal formed

BTC/USD Technical Outlook – Potential Bearish Continuation BelowBTC/USD Technical Outlook – Potential Bearish Continuation Below Resistance 📉🧊
Chart Overview:
The chart illustrates a clear bearish rejection from a major resistance zone (⚠️ 110,000–111,000 USD), followed by the emergence of a bearish engulfing candle 🔻 marked in orange. This move suggests selling pressure has returned after a short-term bullish rally.
Key Zones & Levels:
🔵 Resistance Zone: 110,000–111,000 USD
Price was rejected from this region with a strong bearish reaction.
🟣 Mid-level Support: 105,531 USD
Currently acting as an interim level — if broken, it may lead to deeper declines.
🔵 Support Zone: 100,500–101,500 USD
This is the next strong demand area — price previously rebounded strongly from here.
Technical Signals:
✅ Double Top Structure formation at the resistance zone, indicating trend exhaustion.
❌ Bearish Engulfing Candle near resistance, confirming reversal strength.
📉 Downward Momentum Arrow suggests possible continuation toward support.
🔻 Lower Highs Formation reinforces bearish sentiment after failed breakout attempts.
Projection 🎯:
If the price closes below 105,531, a bearish continuation is likely, targeting the support zone at 101,000–100,500.
Conversely, a strong bounce above this level could delay the drop, but upside is capped below 110,000 unless a breakout occurs.
Summary:
🧭 Bias: Bearish below 105,531
📍 Targets:
Immediate: 105,531 (key level)
Bearish Target: 101,000
Invalidated if: price reclaims and closes above 110,000 with strength
📊 Trader's Note: Look for confirmation of breakdown with volume or candle close before short entry. Set tight risk management due to volatility.

BTC/USD: Daily Trading Strategy AnalysisToday, from a long-term daily chart perspective, yesterday's close formed a small bearish candle. The K-line pattern shows consecutive bullish candles followed by a single bearish candle, with prices still at high levels. The attached indicators are in a golden cross, but due to yesterday's pullback after the rally, there is currently no sign of a strong volume surge. Therefore, the current retracement is still a corrective move. As the overall uptrend remains dominant, shorting should only be considered for short-term trades—do not misalign your strategy.
On the short-term hourly chart, the price failed to break above the previous high during yesterday's European session, coming under pressure and retracing. The current K-line pattern shows consecutive bearish candles, with attached indicators in a death cross. The price is currently in an arc-shaped downward trend, with support near the 105,300 area.
BTC/USD
sell@108000-108500
tp:106500-106000
I am committed to sharing trading signals every day. Among them, real-time signals will be flexibly pushed according to market dynamics. All the signals sent out last week accurately matched the market trends, helping numerous traders achieve substantial profits. Regardless of your previous investment performance, I believe that with the support of my professional strategies and timely signals, I will surely be able to assist you in breaking through investment bottlenecks and achieving new breakthroughs in the trading field.

BTCBitcoin tested the resistance area three times but was rejected. The price broke the local support area and is now heading towards the next support level. The recent price drop is due to escalating war news from Iran.

CHECK BTCUSD SIGNAL READ CAPTAINbtcusd buy now ✅
entry point (108050) (107850)
TAKE PROFIT 1: (108450)
TAKE PROFIT 2: (109000)
LAST TARGET (109.700)
STOP LOSS (107.300)

Bitcoin double top?It looks like we might be seeing a double top formation, and with lower lows and reduced trading volumes, the positive momentum is running out. The yellow line at the top represents my sell line and is based on a long-term trend dating back to 2015. This line accurately predicted the recent all-time high (ATH) within $50. Although Bitcoin can break through this line, it often doesn’t hold for long.
If the price does break through, the next ATH could be approximately 113700 USD. However, that could mean only small returns with the risk of a pullback to $40k. I’m a BTC bull, but you need to consider having more liquidity during the correction.
The news surrounding Bitcoin is very positive, yet it isn't reacting with enough momentum to reach the values suggested by bullish analysts. Many retail investors are currently focused on paying for living expenses rather than investing. In my opinion, the bull cycle may be nearing its end. The recent head and shoulders pattern that broke to the downside is concerning, although it was somewhat saved by institutions buying more.
This trend could continue, but it's important to note that miners are selling, which is another indicator of a market top, and the Net Unrealized Profit/Loss (NUPL) is high.

BTC - Bullish Ascending channel - Target 160K
Monthly shows BTC is in a Bullish Ascending channel confirmed by the higher lows and higher highs and the resistance/Support bands at the sides of the channel.
The expected behavior should be a move to the top of the channel.
The target for the move upwards should lie between the 150k to 160K zone .
Note: should BTC fall out of the Ascending channel then this will indicate a possible shorterm drop to the 76K area of support before a recovery back upwards .

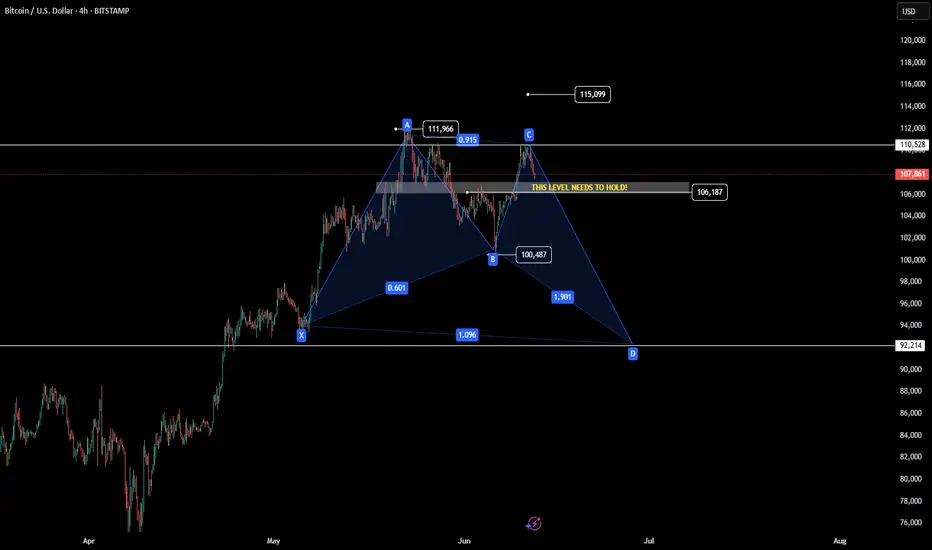
Bitcoin Bearish Bat pattern!🚨 Bitcoin Bearish Bat Pattern forming! 🐻
⚠️ 106k level needs to hold — if it breaks, the bearish bat could fully play out.
🎯 Potential target zone: 93k - 92k.