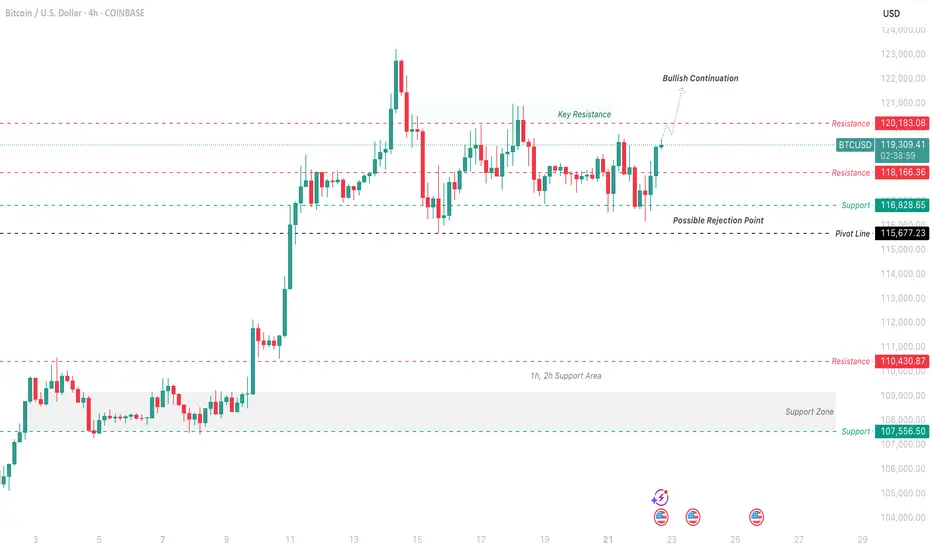
Bitcoin Price Analysis and Bullish Continuation PredictionThis analysis focuses on the Bitcoin/US Dollar 4-hour chart from Coinbase, highlighting a potential bullish continuation based on recent price action as of July 22, 2025. The chart shows a strong upward trend with a recent pullback, suggesting a possible rejection point near the pivot line at $115,672.23.
Putting myself in the reader’s shoes, I’d want to understand the key levels driving this prediction. The 1-hour and 2-hour support area around $107,656.23 has held firm, providing a solid base. The price recently approached the key resistance at $120,183.08, where it faced rejection, indicating a potential ceiling. If the price breaks above this resistance with strong volume, it could signal a continuation toward $123,000.00 or higher.
My thought process involves identifying the pivot point ($115,672.23) as a critical level. A bounce from this level, supported by the 1h/2h support zone, suggests bullish momentum. However, if the price fails to hold above $115,672.23 and drops below $107,656.23, it could invalidate this outlook, pointing to a deeper correction.
Profit Targets:
Short-term: $120,183.08 (key resistance)
Long-term: $123,000.00 (bullish continuation)
Stop Loss: $107,656.23 (below the 1h/2h support area)
These clearly defined targets and stop loss levels should help clarify the trade idea and manage risk effectively.
BITCOIN trade ideas
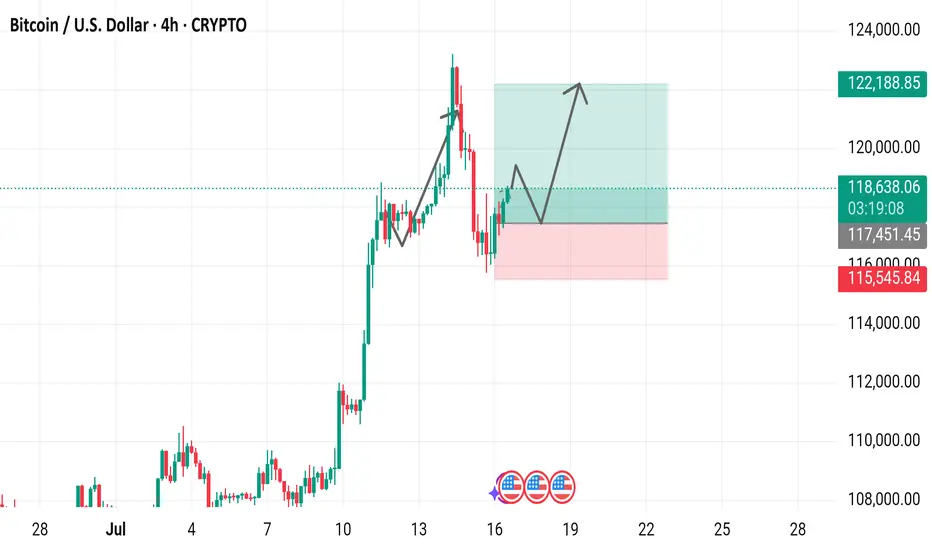
Bitcoin / U.S. Dollar 4-Hour Chart (July 2025)4-hour price movement of Bitcoin (BTC) against the U.S. Dollar (USD). The price has risen from 118,714.64 to 118,714.64 (+937.9 or +0.80%) over the period. Key levels include a support zone around 115,451.45 to 117,451.45 and a resistance zone near 120,000.00 to 122,188.85,
Bitcoin at the Threshold of the Fibonacci Gate - Silent Strain.⊢
⟁ BTC/USD - BINANCE - (CHART: 1W) - (July 22, 2025).
◇ Analysis Price: $119.209,03.
⊣
⨀ I. Temporal Axis - Strategic Interval - (1W):
▦ EMA9 - ($111.083,72):
∴ Price remains well above the EMA9, with consistent bullish spacing;
∴ The weekly candle closes with strength and full-body integrity above it;
∴ EMA9 slope continues upward, supporting ongoing momentum.
✴️ Conclusion: Short-term structure remains decisively bullish, with trend-following support intact.
⊣
▦ EMA21 - ($103.417,42):
∴ EMA21 is sharply rising and holds significant historical support;
∴ Price remains distanced, but no vertical stretch detected;
∴ Not touched since early 2024 - the bullish cycle is intact.
✴️ Conclusion: Mid-cycle momentum remains strong. No structural weakness under current trajectory.
⊣
▦ WMA200 - ($62.496,26):
∴ Remains deep below current price action - untouched since breakout phase in 2023;
∴ Its angle is now slowly tilting upward - reflecting macro regime change;
∴ Long-term holders remain in command; no gravitational pull is active.
✴️ Conclusion: WMA200 is no longer relevant for tactical reaction, but serves as a structural floor of the cycle.
⊣
▦ Fibonacci Retracement - (Top: $122.056,95 / Bottom: $27.143,79):
✴️ Top: $122.056,95 - (07/14/2025) = 1 Fibo;
✴️ Bottom: $27.143,79 - (10/16/2023) = 0 Fibo.
∴ Price is now within 2.33% of the Fibonacci 1.0 extremity;
∴ Entire move from $27k to $122k retraced cleanly with structural respect to 0.382 ($63.400;62) and 0.618 ($85.800,12);
∴ Current pressure nears full extension, requiring caution;
✴️ Conclusion: Full retracement achieved. Continuation must now be fueled by external influx or will face rejection at golden gate.
⊣
▦ RSI (21) + EMA9 - (RSI: 66.65 / EMA9: 63.73):
∴ RSI remains below 70 - showing momentum without exuberance;
∴ RSI crossed above EMA9 with positive slope;
∴ No divergence present; momentum confirmation continues.
✴️ Conclusion: Silent bullish continuity. No signal of exhaustion.
🜏 ORACVLO ARCANE: (RSI = 66 - No Fibonacci/Guematria convergence).
⊣
▦ MACD (9,21) - (MACD: 7,666.30 / Signal: 5,976.56 / Histogram: +1,689.74):
∴ MACD lines widening - strong expansion phase;
∴ Histogram rising above prior week;
∴ Still in mid-cycle range - not overextended.
✴️ Conclusion: Momentum engine active. No current loss of acceleration.
🜏 ORACVLO ARCANE: (Histogram = 1,689.74 - No convergence).
⊣
▦ OBV + EMA9 - (OBV: 86.27K):
∴ OBV rising cleanly with price;
∴ No divergence detected on weekly timeframe;
∴ EMA9 supportive, confirming accumulation bias.
✴️ Conclusion: Volume structure confirms legitimacy of bullish move.
⊣
▦ Stochastic RSI - (3,3,21,9) - (K: 94.30 / D: 84.53):
∴ Both lines in extreme overbought zone;
∴ No bearish cross yet - but a turn may initiate in next 1-2 candles;
∴ Historical turning points often occur from this elevation.
✴️ Conclusion: Momentum peaking. Vigilance required for reversal trigger in next cycle.
⊣
🜎 Strategic Insight – Technical Oracle:
∴ Price is pressing against the final Fibonacci gate of $122K, with momentum indicators still aligned;
∴ However, overbought pressure is building, particularly on the Stoch RSI.
∴ Breakout will require force; otherwise, a pullback from the threshold is probable.
⊣
∫ II. On-Chain Intelligence – (Source: CryptoQuant):
▦ Exchange Netflow Total - (All Exchanges) - (+920 BTC):
∴ Influx into exchanges suggests potential distribution is being prepared.
⊣
▦ Funding Rates - (All Exchanges) - (+0.008):
∴ Mildly positive; no leverage overheating detected.
⊣
▦ Taker Buy Sell Ratio - (All Exchanges) - (0.959):
∴ Slight taker sell dominance - friction at high prices.
⊣
▦ Spent Output Profit Ratio - (SOPR) - (1.017):
∴ Profitable exits ongoing. Healthy, but could tilt if profit-taking accelerates.
⊣
▦ Realized Cap + (EMA9) - (Rising):
∴ Network is revaluing BTC upward - structurally healthy.
⊣
▦ MVRV Z-Score + (EMA9) - (2.32):
∴ Elevated. Historically a zone where caution is warranted.
⊣
▦ Miner Reserve - (All Miners) - (1.809M BTC declining):
∴ Long-term miner outflows continue - no sudden spike detected.
⊣
🜎 Strategic Insight - On-Chain Oracle:
∴ On-chain data supports the current trend, but with visible friction. Exchange inflow and profit-taking are warning signs that price is now dependent on sustained demand;
∴ This is a zone of silent strain: structurally sound, but tactically stretched. While the broader framework supports continuation, there is no buffer left for error;
∴ Weakness will be exploited if new inflows fail to materialize.
⊣
𓂀 Stoic-Structural Interpretation:
∴ Structurally Bullish - Tactically Suspended;
∴ Tactical Range Caution: ($114.000 / $122.056).
⊣
▦ Codicillus Silentii - Strategic Note:
∴ The CME gap and the proximity to Fibonacci 1.0 have formed a psychological and technical ceiling;
∴ If unbroken this week, the next cycle may revert to (0.786) as reversion.
⊣
▦ Momentum-wise:
∴ RSI remains in the bullish zone (66.65) without entering overbought - a sign of discipline in the ascent;
∴ MACD shows expansion with a growing histogram - no curvature loss;
∴ Stochastic RSI is in extreme overbought (K = 94.30), signaling elevated tension.
✴️ Conclusion: Momentum is intact but strained. A breakout is possible, but failure to continue will invite a flush.
⊢
✴️ Final Codex Interpretation:
∴ Bitcoin stands at the edge of the Fibonacci Gate, within breath of the 1.0 threshold ($122,056); ∴ While structure, momentum, and on-chain flows permit a push higher, the presence of inflows to exchanges, elevated MVRV, and extreme oscillator positioning suggest that the threshold is sacred - and only silence or strength may break it;
∴ Rejection here would not be collapse, but strategic regression to gather force beneath the gate.
⊢
⧉
· Cryptorvm Dominvs · MAGISTER ARCANVM · Vox Primordialis ·
⚜️ ⌬ - Silence precedes the next force. Structure is sacred - ⌬ ⚜️
⧉
⊢

HUGE Cup & Handle On BTC/GOLDAre we in the same situation as in 2017? At that time, BTC followed with a 500% rally. Do you think history is repeating itself?
If we use the same percentages, we'll have a BTC/GOLD rally of 600%. This would mean that BTC could make 250%.

BTCUSD: Buy ideaBuy idea on BTCUSD as you can see on the chart because we have the breakout with force the vwap and the RL by the buyers.

BTCUSDPrice has broken out from the external trendline which has signify for a momentum to move up at this point the overall trend is bullish while we will be expecting sell as retracement for us to reenter to the upside. in this trend we will be targeting a R:R OF 1;3

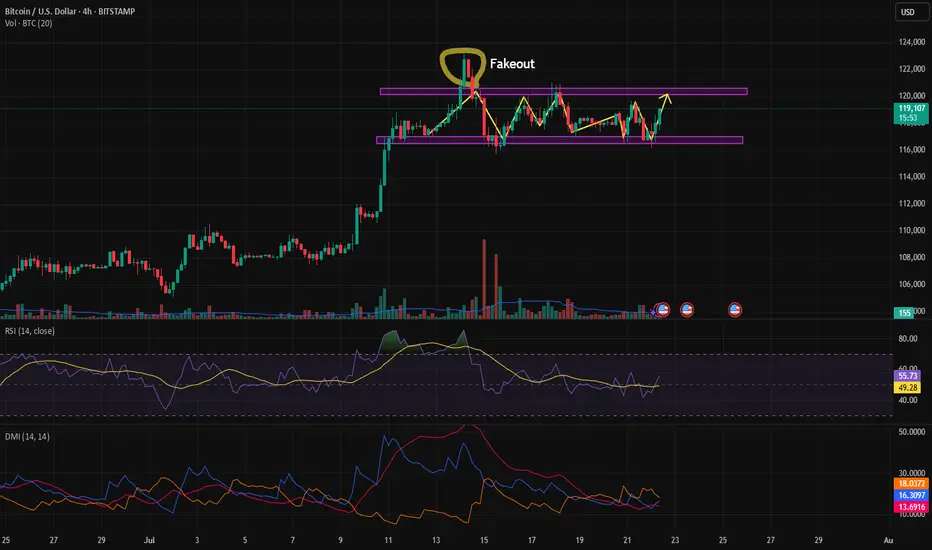
Range in BitcoinBitcoin has been ranging for nearly 12 days, and based on range-trading strategies, it's now possible to take a position. There's a high probability that the price will move toward the top of the range. For taking positions near the bottom of the range, we need to wait for a trigger since we're trading against the current direction. In case of a breakout above the range, we should be cautious of fakeouts.
SellRejection Level
Daily Volume
Market Structure Shift
London Session
Trend Line Break
Untapped Order Point

BTC USD LONG RESULTPrice had held been in a narrow falling wedge before breaking out with strong volume and held the support order block at the 0.6fib level and expecting to retest before going to the supply zone where TP zone was set.
Price did move as I predicted just missing and leaving our entry behind.
Better Setups ahead 💪💯
_THE_KLASSIC_TRADER_.

Bitcoin ConsolidatesBitcoin continues to flex its strength, grinding higher and holding firm just below resistance at $123,231. After breaking out above $112,000 earlier this month with a burst of volume and momentum, price has cooled off slightly, consolidating in a tight range between $117K and $123K. This isn’t weakness – it’s digestion. A bullish pause. Traders are clearly eyeing the next move, and so far, the chart looks like it’s winding up for another push.
Support at $112,000 has held cleanly, and the 50-day moving average is trending steadily upward, now comfortably below price – a textbook sign of bullish structure. If $123K breaks, it could set off a new leg higher, potentially triggering another wave of FOMO. But even a drop back to $112K would keep the uptrend intact, with secondary support around $105K offering a strong safety net.
Volume tells the story too. It surged during the breakout and has since tapered off, which is exactly what you’d expect during a calm consolidation. In short: BTC looks healthy, poised, and still in charge. The next big move could be just around the corner – and right now, the bulls have the edge.


Bitcoin May Pull Back Slightly Before Resuming Uptrend📊 Market Overview
• Bitcoin is currently trading around $116,934, slightly down after hitting an intraday high of $119,524.
• The earlier rally was supported by inflows into Bitcoin ETFs, accumulation by major holders like Trump Media and MicroStrategy, and a pro-crypto regulatory stance in the U.S. (e.g., Genius Act, CLARITY Act).
• However, a surge in whale transfers to exchanges and declining BTC dominance suggests profit-taking and potential short-term volatility.
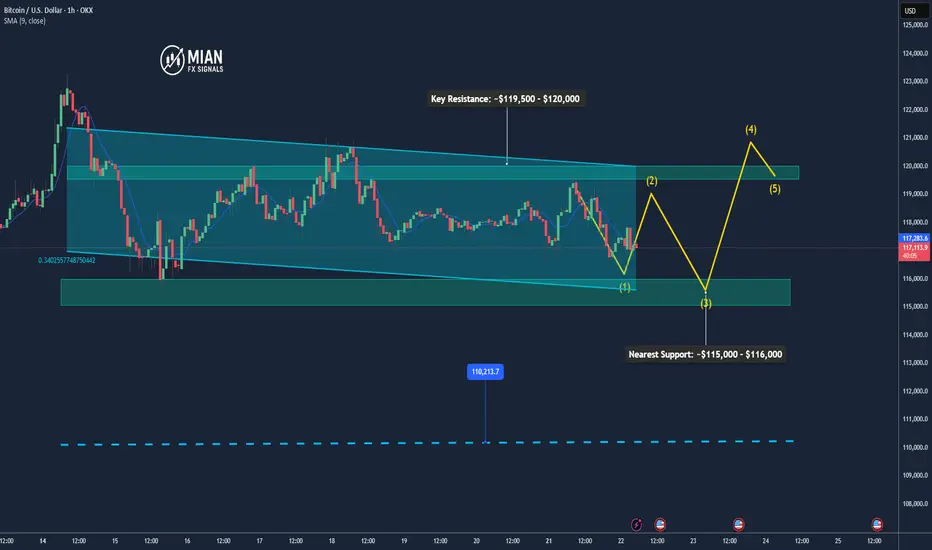
📉 Technical Analysis
• Key Resistance: ~$119,500 – $120,000 (intraday high and recent ATH)
• Nearest Support: ~$115,000 – $116,000, then $110,000
• EMA 09/20: Price is hovering around EMA 9/20 on H1–H4 timeframes, indicating a short-term uptrend but needing a pause or correction.
• Momentum / Volume: RSI is near overbought territory; falling volume hints at consolidation or a mild pullback. The overall trend remains bullish but slightly unstable.
📌 Opinion
Bitcoin is likely to pull back slightly in the short term toward the $115,000 – $116,000 zone due to profit-taking pressure, before potentially resuming the uptrend if it can break and hold above $119,500 – $120,000 with strong volume.
💡 Trade Setup
SELL BTC/USD at: $118,500 – $119,000
🎯 TP: $116,500
❌ SL: $120,000
BUY BTC/USD at: $115,000 – $116,000
🎯 TP: $118,500 – $119,500
❌ SL: $114,000
Total to 5T & BTC to...?Morning fellas,
No way BTC is stopping here. People are gonna get reckt shorting, and are not gonna believe where this price action is gonna stop.
TOTAL must reach anywhere between 4.5T & 5T, this spread across all Alts.
It has been a long time coming, and the party hasnt even started yet.
Hold your horses and trade thirsty, my friends!


July 18 Bitcoin Bybit chart analysisHello
It's a Bitcoin Guide.
If you "follow"
You can receive real-time movement paths and comment notifications on major sections.
If my analysis was helpful,
Please click the booster button at the bottom.
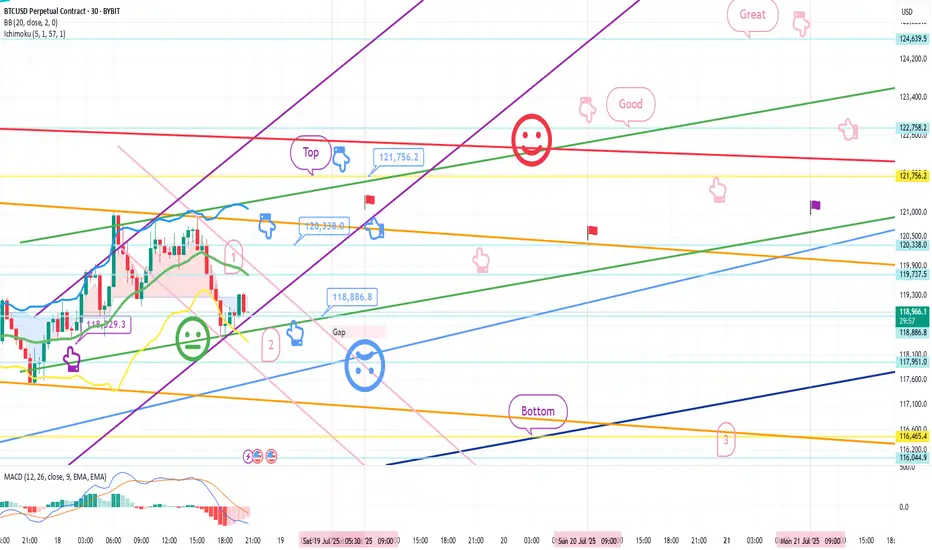
Bitcoin 30-minute chart.
There is no Nasdaq indicator announcement today.
The mid-term pattern was broken in the morning wave,
but I proceeded as safely as possible.
At the bottom left, I connected the final long position switching section in the analysis article on the 15th with a purple finger.
*When the blue finger moves,
Bidirectional neutral
Short->Long or long waiting strategy
1. Short position entry section of $120,338 / Stop loss price when orange resistance line is broken
2. Long position switching of $118,886.8 / Stop loss price when blue support line is broken
3. Long position 1st target of $121,756.2 -> Target price in the order of Good and Great
If it falls immediately from the current position or
touches the top once and falls, it is a vertical decline condition.
If it falls immediately, it is the final long waiting in section 2.
(When the sky blue support line breaks, the stop loss price is the same)
From the sky blue support line break, the 6+12 section is where the mid-term pattern is restored,
and it is roughly the bottom section.
If the strategy is successful, I have left a simulation with a pink finger on the right,
so please check the switching and profit-taking section,
and operate safely in each position, long, short, and no position, based on whether the purple support line breaks from the current position.
From the green support line break, the low point of today's daily candle is broken,
so it would not be good for a long position, right?
Up to this point, please use my analysis article only for reference and use,
and operate safely with principle trading and stop loss price.
Thank you.
BITCOINBTC is showing strong bearish momentum. Price has broken below key support and is forming lower highs and lower lows, indicating continuation of the downtrend.
Until we see a clear reversal pattern or reclaim of resistance levels, I expect further downside.
