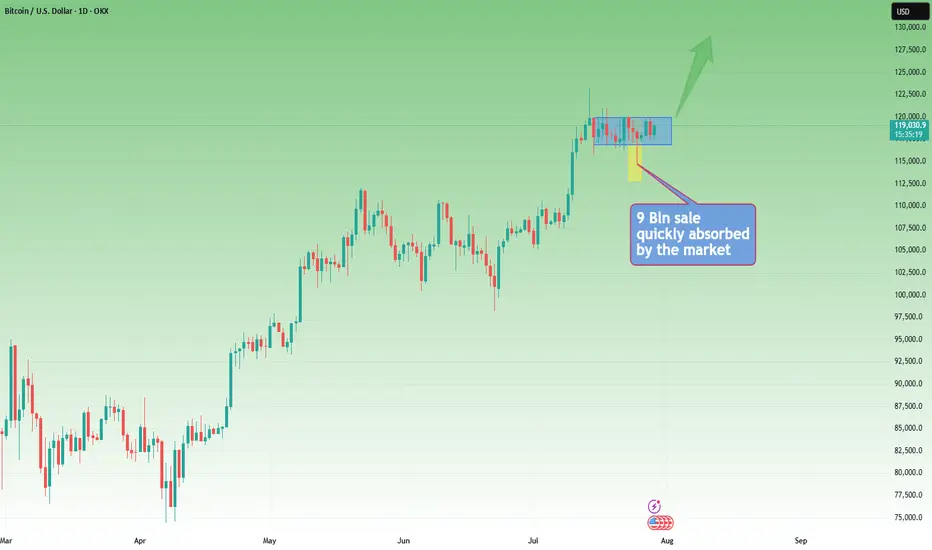
Rectangle Consolidation + Bull Trend = BTC Setup for ATHYesterday, Bitcoin dipped and recovered again, following last week's sharp spike down, triggered by the $9B Galaxy Digital sale on behalf of a Satoshi-era investor.
________________________________________
🧠 Why is this important?
Despite being one of the largest BTC sales in history, the move only caused a temporary spike down.
That’s a clear sign of market strength and strong interest on dips.
________________________________________
📉📈 Current Technical Context:
• If we ignore the spike, price is consolidating in a tight rectangle
• That’s typically a continuation pattern
• The broader trend remains strongly bullish
📌 Put all of that together, and we have at least 3 reasons to expect upside continuation
________________________________________
🎯 Key Levels:
• Break + daily close above $120K → likely leads to a new ATH and a potential test of $130K
• Invalidation only comes with a break below $114K
________________________________________
Conclusion:
BTC just absorbed a massive $9B sell without blinking.
As long as $114K holds, I'm bullish and expecting continuation.
Next leg could (and I hope it will) be explosive. 🚀
BITCOIN trade ideas
BTCUSD – Bearish Retracement Towards Key Liquidity Zone📊 BTCUSD – Bearish Retracement Towards Key Liquidity Zone
BTCUSD is currently trading near 116,425, showing signs of a potential bearish retracement after testing the previous resistance zone around 117,000–119,000. The chart structure highlights multiple Break of Structure (BOS) points, confirming shifts in market sentiment.
Technical Breakdown
Previous Resistance Rejection
Price failed to hold above the 117,000 mark, indicating strong selling pressure from the prior supply zone.
The rejection aligns with a liquidity grab above the recent highs, suggesting smart money distribution.
Liquidity & Fair Value Gaps
There’s a visible Liquidity/Fair Value Gap from the late July rally, which may now act as a magnet for price.
The market tends to fill these inefficiencies before deciding the next major trend move.
Target & Support Zone
The next key support and liquidity pool rests between 113,500 – 114,000, highlighted as the target zone.
This area has confluence with previous accumulation phases, making it a probable point for a bullish reaction if tested.
Volume Profile Context
Volume nodes indicate heavier trading activity below current levels, suggesting that a drop towards 114,000 could be met with increased buyer interest.
Market Outlook
Primary Bias: Short-term bearish retracement.
Immediate Target: 114,000 liquidity zone.
Invalidation: A daily close above 117,500 may shift sentiment back to bullish, opening the path toward 119,000–121,000.
Trading Insight:
Aggressive traders may look for short setups below 116,500, targeting 114,000. Conservative traders may wait for price to tap into the support/target zone for potential long opportunities with tight risk management.

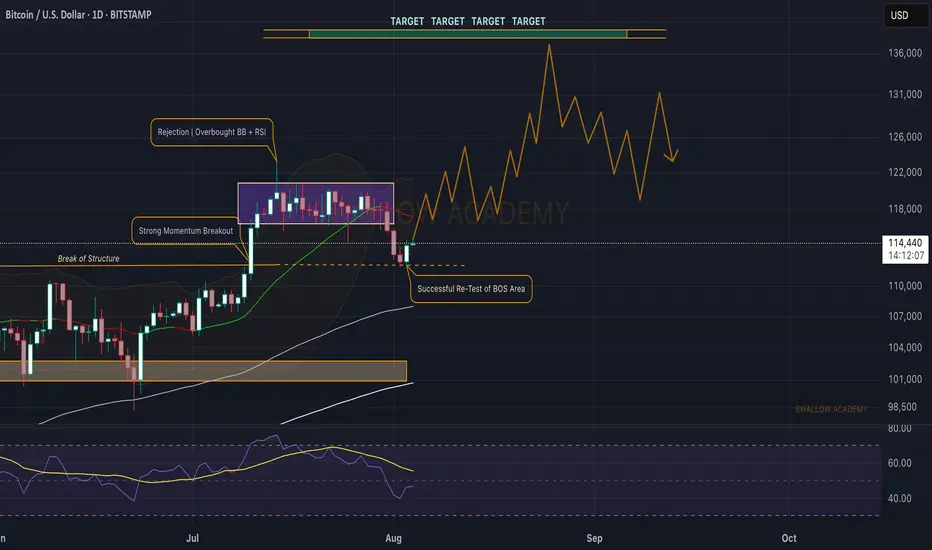
Bitcoin(BTC): History Never Lies | 3-5 Months Before Bear MarketBull Market - Bear Market - Accumulation - Expansion - Reaccumulation: this is the pattern we have been going with since 2012, where currently, after some help from Trump, in combination with the 2024 halving, we had really good upside momentum, which formed the new ATH and led us into the bull run that we have been looking for (by we I mean most traders).
Now, since the last time we shared this kind of analysis on the markets, we have successfully entered the bull market, where currently, based on previous bull runs, we still have around 90-150 days left of further upside movement, which would be a perfect opportunity for altcoins to have their momentum as well.
But bear in mind, each cycle is different, so we have to be ready for anything. What we see is that 2026 should be a bearish year, so be ready for that!
Swallow Academy

Bitcoin - The cycle is just starting!⚔️Bitcoin ( CRYPTO:BTCUSD ) just created new highs:
🔎Analysis summary:
Bitcoin is currently - especially with the new all time high breakout - just perfectly following previous cycle behavior. Since there is no real resistance above current price, apart from psychological levels, I do expect a substantial rally back to the upper channel resistance trendline.
📝Levels to watch:
$300.000
🙏🏻#LONGTERMVISION
Philip - Swing Trader

BTC cares US liquidity risks in AugustMorning folks,
So, in general as you can see our upside AB=CD that we discussed last time is working. But...
as you know BTC is strongly related to liquidity dynamic on US domestic system. This month Mr. Bessent wants to re-finance 1Trln in debt, with net borrowing around 250 Bln. Hardly BTC will get a small chunk of this funds.
it means that the volatility could rise significantly in nearest 1-2 weeks with downside price gravitating. Overall action looks rather heavy. Maybe BTC somehow will complete AB=CD target around 116.20-116.25K, but now this action looks like retracement - no thrust, slow action a lot of overlapping candles. So lows might be re-tested or even broken.
In current situation we think it would be better to not take any new longs and watch for clarity. If you have position already - move stops to breakeven.

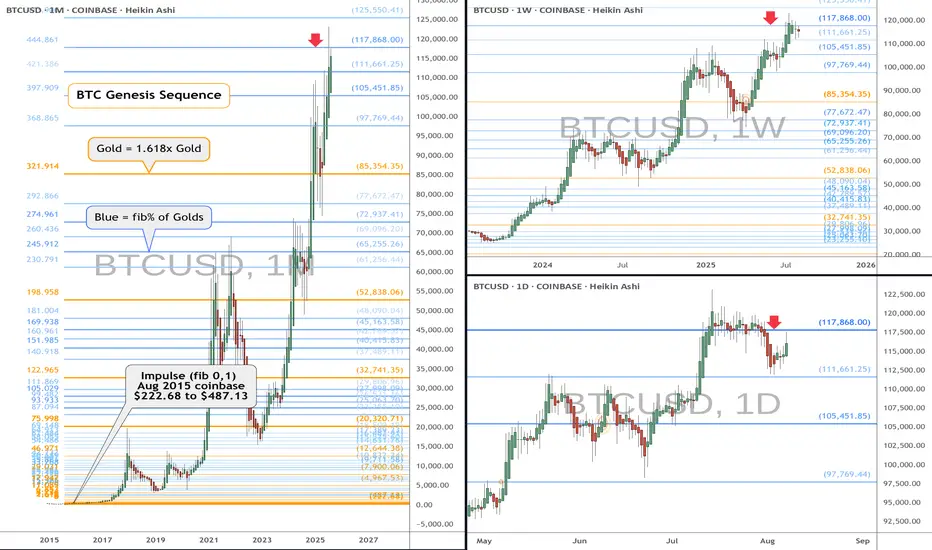
BTC heads up at $117,868 coinbase: Genesis fib trying to TOP it Shown here is a single fib series in 3 different time-frames.
The "Genesis Sequence" has called all major turns since 2015.
Exact reactions at the last few fibs confirm a warning here.
.
See "Related Publications" for previous analysis ------------->>>>>>>>>>
Such as the last post with a "Road Map" that played out PERFECTLY
.
Hit BOOST and FOLLOW for more such PRECISE and TIMELY charts.
=========================================================
.
Bitcoin (BTC): Successful Re-Test on Break of Structure AreaBitcoin is showing a good start at the beginning of the week, where we are seeing a successful retest happening, which again might send the price back into the accumulation zone and then the breakout we have been looking for.
So as long as we are above the retest zone of BOS, we are bullish; if we break it, then 101,000-104,000 is going to be our next target!
Swallow Academy
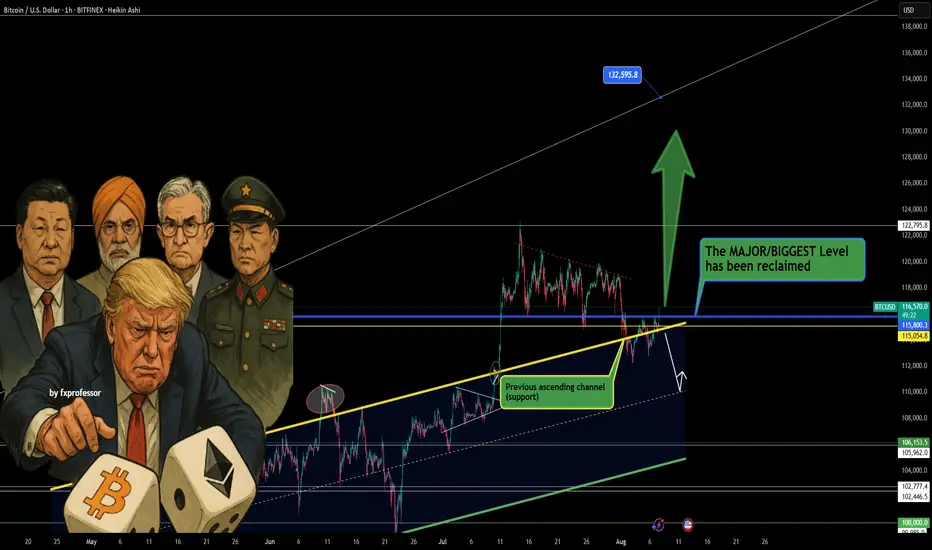
Trump Boosts 401K Crypto Talk, But BTC Levels Lead the Way UP📢💥 Trump Boosts 401K Crypto Talk, But BTC Levels Lead the Way UP 🧠📊
News just dropped that President Trump may sign an executive order allowing crypto into 401(k) retirement plans. 🇺🇸📜 While that’s a massive headline, let’s stay grounded—we play the levels, not the politics. 🧘♂️📉📈
⚠️ A quick disclaimer: It’s Trump, so… let’s see if the ink even hits the paper. But price is king, and the chart already gave us the real signal.
🔄 Bitcoin just reclaimed the single most important level: $115,800. This isn’t just a number—it was the previous ascending channel’s support, and it’s now acting as strong support again. This changes the game.
🟢 As I’ve mentioned in previous ideas, I remain hedged:
✔️ Long BTC
❌ Short S&P 500
That ratio is working out well, as shared earlier today in the post:
“Bitcoin vs S&P 500 – Ratio Signals Strength” — it’s clear which asset the market favors. BTC is holding structure. SPX? Not so much. 📉🔍
🎯 Next upside target: $122,795
🚀 Bigger extension level: $132,595
🛑 Breakdown invalidation: Loss of $115,800 would weaken the case.
News or not, structure always wins. Stay sharp, stay level-headed. The market rewards those who listen to the chart, not the noise. 📡🧠
One Love,
The FX PROFESSOR 💙
Disclosure: I am happy to be part of the Trade Nation's Influencer program and receive a monthly fee for using their TradingView charts in my analysis. Awesome broker, where the trader really comes first! 🌟🤝📈
Watching for intraday BTC bounce firstMorning folks,
So, neither NFP data nor technical picture helped BTC to stay above 117. While US Treasury is started drain liquidity and borrow (they need 1 Trln this month), sending ~ 150 Bln to its TGA account with the Fed - BTC got hurt.
Now price stands at vital area - previous tops. If BTC will drop under 110K, collapse could start. Let's hope that this will not happen...
Meantime, we're at 112-113K support. We already talked about it before. Here we have reversal bar and bullish engulfing pattern, so maybe we could get a bit higher pullback on intraday chart. 113.8 and 113.1K support areas on 1H TF might be considered for long entry. Invalidation point for this plan is the low of engulfing pattern.
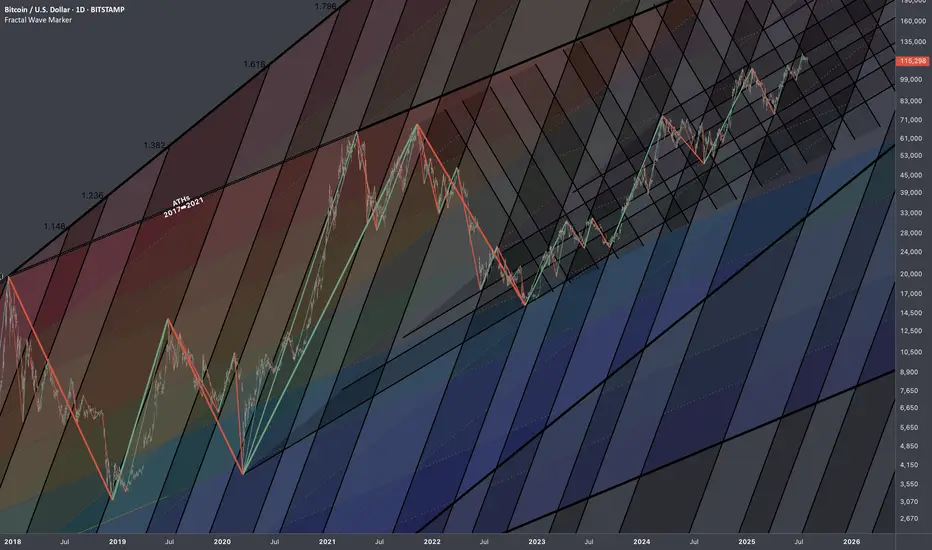
Bitcoin: Interconnections Rewired🏛️ Research Notes
Keeping fib channel of the rising trend angles as they've number of times covered well that aspect of cycle texture.
The other frame of reference would be with fib channel that covers drop from 2021 ATH to late 2022 bottom.
Last bit would be integrating fib channel discovered while ago that connects covid & late 2022 bottoms
Together they create a framework that addresses the complexity and makes even the most chaotic price movements seem to be a part of structural narrative.
Bitcoin on the Rise — But the Bat Hasn't Flown Yet
---
🚀 **!** 🦇
We're anticipating a continued bullish move in Bitcoin until it completes the **Bat Pattern** at the key level of **$118,469**. 📈
From there, we expect a reversal — a drop toward **$113,800**. 📉
Stay tuned, drop your thoughts below, and let’s decode the market together.
#Bitcoin #CryptoAnalysis #BatPattern #TechnicalAnalysis #LearnThenTrade
---

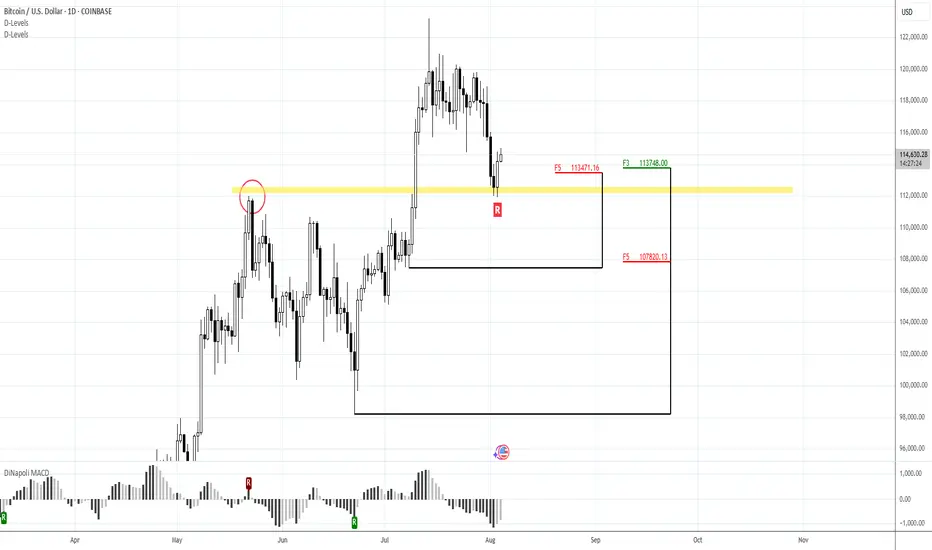
BTCUSD 1H BULL STILL IN CONTROL BEFORE MASSIVE CRUSH :))BTCUSD Looking to test 117600
BTCUSD created very good support around 113171 (from last week drop)
Let see if we break or hold 117600, if thats HOLD btcusd shows big sign of decline

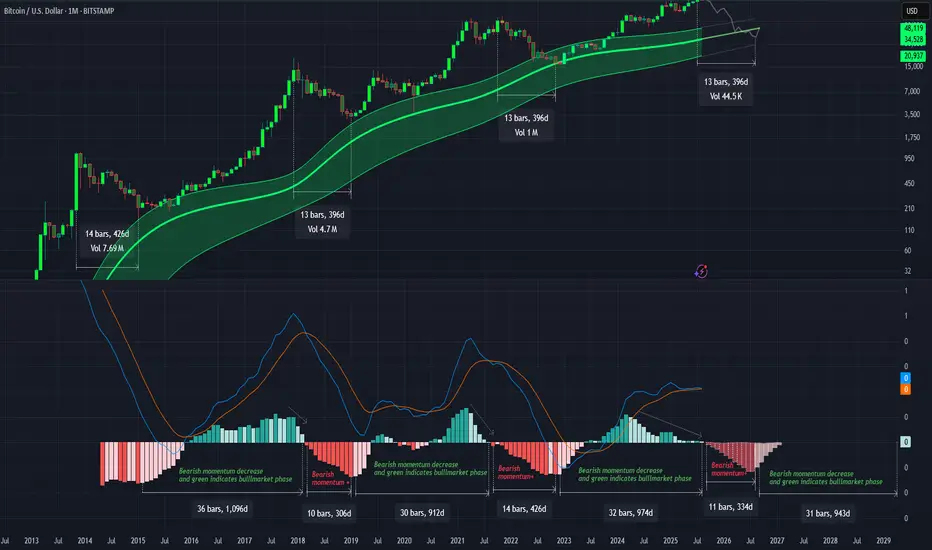
Gaussian and the LMACD deep dive!As you can see LMACD is showing signs of exhaustion. Histogram has been compressing or decreasing in momentum while the price has been climbing up. This divergence wont last for too long and a change in the trend seem very likely. BTC might be entering in the bear market pretty soon and you might start seeing the histogram turning red and increasing in bearish momentum before changing the trend once we approach to the core of the Gaussian or even bellow this time. Breaking bellow the core would mean range bellow 40k as bear market bottom.
Do you think I'm joking ???As I said, Bitcoin broke the triangle, and now with a slight price correction(109k), it could surge to $150k , and you still think I'm joking!!
Previous analysis

BTCUSDBTCUSD is getting ready for upside towards 116K-117K.
Disclosure: We are part of Trade Nation's Influencer program and receive a monthly fee for using their TradingView charts in our analysis.

BTC Bear Divs5 hidden bear Divs on yesterdays daily. 2 wicks on the 50MA. If the engulfing holds, nice setup for a reversal with a target of 130 +/- by EO August.

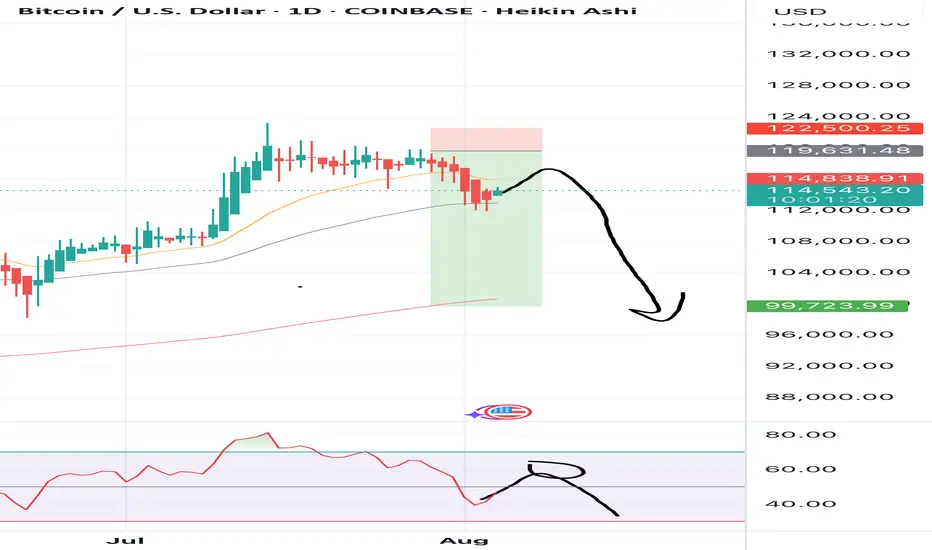
BTC Retrace RoadMap and 3 nearby supports worth watching NOWThis is a near-term followup to my big picture linked below.
Dip is underway after orbiting our Genesis Fib at 117.9k.
Quickly approaching the next three supports worth watching.
Supports get stronger below but each one needs to slow the dip.
$ 115,140 is a minor fib but possible end of dip wave.
$ 113,9xx is a double fib that should be pretty strong
$ 111,661 is the sister Genesis fib, and a MUST HOLD
.
Big Picture chart and why 117.9k was KEY
=======================================================
.

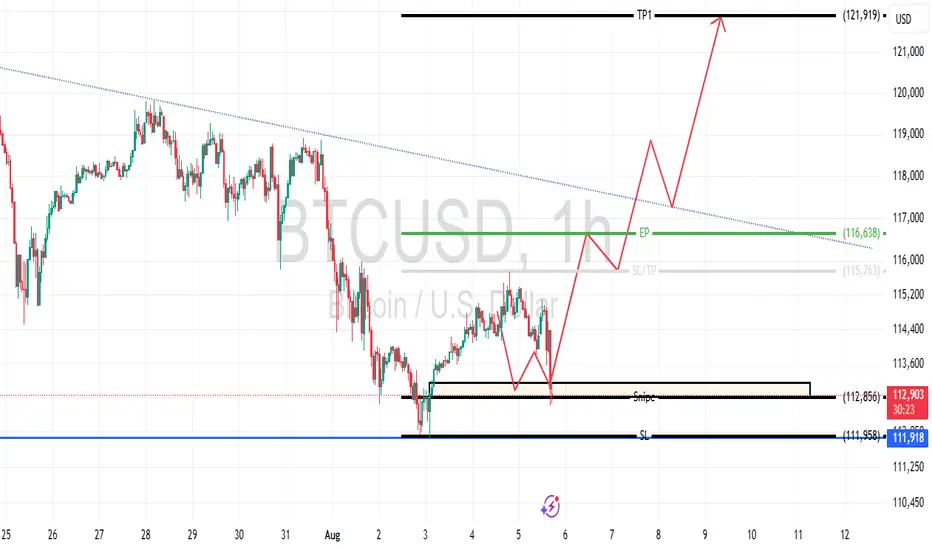
Bitcoin Possible new ATHPrice targets TP1 at $121,919, with an entry point (EP) at $116,638, stop loss (SL) at $111,987, and a support/slip level at $112,856. Expecting a rise from current levels near $113,085, driven by a breakout above the descending trendline.

BTCUSD 8/1/2025Come Tap into the mind of SnipeGoat as he gives you a Full Top-Down Analysis of Bitcoins Price Action as we come into the month of August. What is Price doing? Where is Price going? Come get the answer here!
_SnipeGoat_
_TheeCandleReadingGURU_
#PriceAction #MarketStructure #TechnicalAnalysis #Bearish #Bullish #Bitcoin #Crypto #BTCUSD #Forex #NakedChartReader #ZEROindicators #PreciseLevels #ProperTiming #PerfectDirection #ScalpingTrader #IntradayTrader #DayTrader #SwingTrader #PositionalTrader #HighLevelTrader #MambaMentality #GodMode #UltraInstinct #TheeBibleStrategy

BTC going back to the trenches to schemeBTC/USD – Bearish Pullback to $110,000 Incoming?
Technical Overview:
Bitcoin is currently showing signs of exhaustion after reaching the $125K–$130K resistance zone, which aligns with the upper boundary of the long-term ascending channel formed since the $20K breakout. RSI is flashing strong bearish divergence on the daily and weekly timeframes, suggesting the bulls are losing momentum.
The price also failed to hold above the key psychological level at $120K, now acting as strong resistance. A decisive break below the $115K support zone could trigger a broader correction down toward $110,000, which marks the following confluences:
0.382 Fibonacci retracement of the last impulse from $95K to $130K
High-volume node on the VPVR (Volume Profile Visible Range)
Retest of the previous macro breakout level (former resistance now potential support)
Macro Factors:
Growing speculation of delayed rate cuts from the Fed is putting pressure on risk-on assets, including crypto
Whales and institutional players have been seen rotating out of BTC into altcoins and cash in recent on-chain data
ETF inflows have slowed dramatically compared to earlier in the cycle
Conclusion:
Unless BTC can reclaim $120K with strong volume, the path of least resistance looks like a healthy correction toward $110,000, where stronger demand may kick in. This could provide a better risk-reward entry for long-term bulls.
🚨 Watch for a daily close below $115K to confirm bearish!

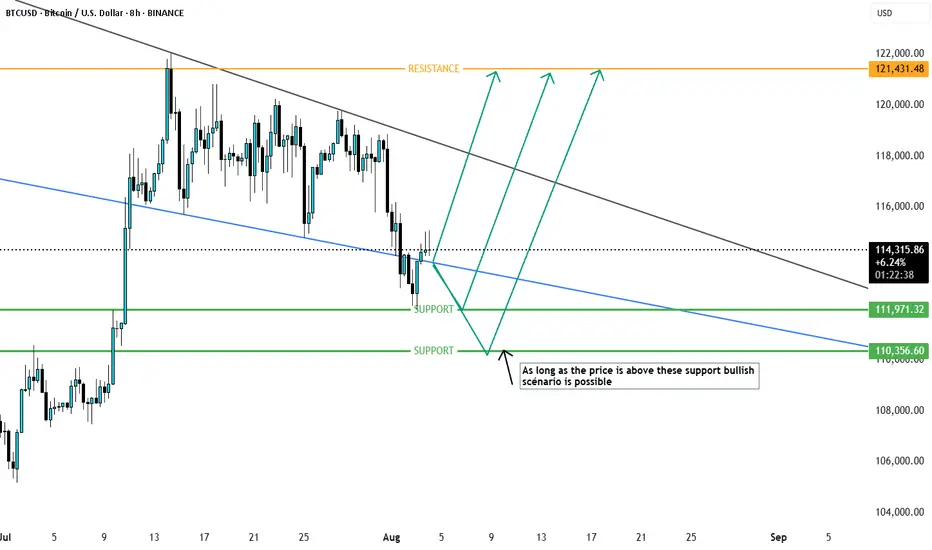
BTCUSD Possible senarioas long as the price is above this suport BTCUSD is bullish and if price drops below these support then short term bearish may be possible. let us see. currently price is rejecting from fib 0.5 of recent swing
Bitcoin confirmation of a pull back before the sell pressure Confirmation of a pull back before the sell pressure ..... so we are to hold all our sell positions