best area for buy BTCI see a change in the H4 trend in BTC..this means it is in line with the major trend..there is a possibility that it will return to the price range of 118500
BITCOIN trade ideas

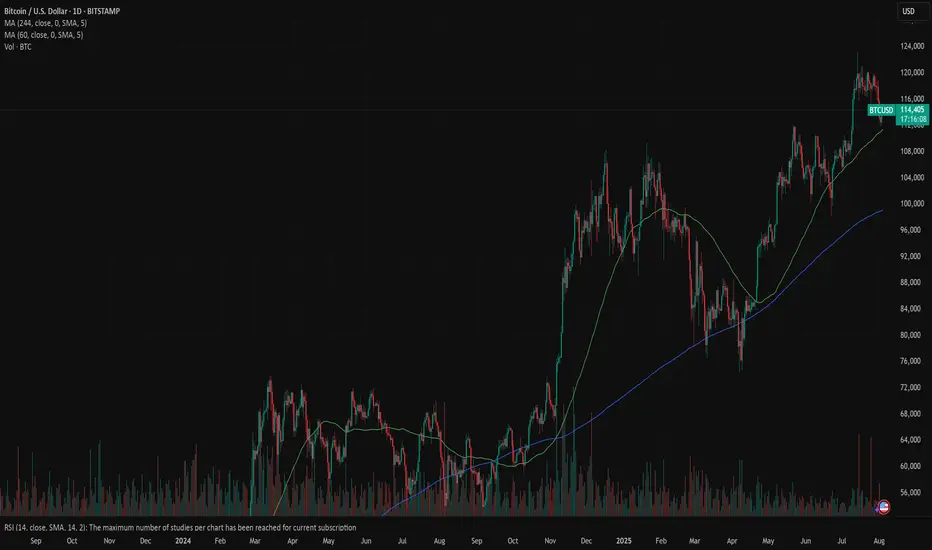
BTCUSD – bullish momentum is backBitcoin is making a strong comeback, breaking above short-term resistance and reestablishing its uptrend after a prolonged consolidation phase. The technical structure now shows clear control from the bulls, with higher highs and higher lows beginning to form.
Positive risk sentiment and growing expectations of capital flowing back into the crypto space—especially after a series of weak U.S. economic data—are fueling the current BTCUSD rally. If momentum holds, the next target could be the upper boundary of the price channel.
Keep an eye on how price reacts at key levels and trendlines — this might be the launchpad for the next bullish leg.
Good luck, and if you enjoyed this analysis, don’t forget to hit like and drop a comment!

1h out look Btc chart Bitcoin appears to be completing its Wave (4) correction around the 0.382 Fibonacci level near 116,359. As per Elliott Wave structure, a potential Wave (5) extension is anticipated with key Fibonacci targets at 119,908 (0.618), 122,107 (1.0), and 125,664 (1.618). Price action confirmation above the current structure may trigger the next bullish leg.

$BTC Finally Historical Profit Done at $123K Price of ATH CRYPTOCAP:BTC tying to push price upward movement and if it's Breakout the $120K-$122K Price Level area than it could be reached $128K - $136K price level area.
I'm guess it will be happened. Always Pattern indicate and say price movement of Bitcoin. I was many Prediction of popular coin and i will succeed in 2025. I'm long term analyst of long term investment of Traders.
🚦From News: Bitcoin Holds Firm Above $115K Support as Charts Point Toward $150K Target
Bitcoin holds above $115K support with charts pointing to a potential $150K Elliott Wave target.
Hashrate hits all-time high as energy value model places BTC valuation 45% above current price.
U.S. policy shift enables 401(k) crypto access, opening a $9 trillion market for Bitcoin adoption.
Bitcoin has held firm above the $115,000 support and is now showing signs of a large move on the charts. Price patterns and rising adoption trends are aligning as BTC prepares for a possible rally. At the time of writing, BTC was trading at $116,620, showing steady upward momentum.
Technical Structure Points Toward Upside Continuation
According to an analysis prepared by Lau, Bitcoin has taken the $115,000 support and may be preparing to break its all-time high. On Binance, the BTC/USDT daily chart displays a breakout from resistance near $116,438.79. The price reached a new high before retracing to $111,917.37, where it found support.
BTC’s price structure continues to show higher lows, aligning with the Elliott Wave pattern that targets $150,000. Key support levels remain at $98,385.45 and $89,326.51, confirming a strong technical base. According to Daan Crypto Trades, Bitcoin is steadily rising toward the $120,000 zone, where a cluster of stop losses and liquidation points may fuel further upside.
The current bullish flag formation is still intact, supported by the 50-day SMA at $113,154. The RSI has moved to 54, indicating recovering momentum without being overbought. Analysts view a break above $117,350 as a key signal for another upward push.
On-Chain Metrics and Market Drivers Support Growth
Bitcoin’s energy value stands at $167,800, which is around 45% above the current market price. According to Charles Edwards, founder of Capriole Investments, “Hash rates are flying and Bitcoin Energy Value just hit $145K.”
This model links BTC’s value to miner energy inputs and network security. Bitcoin’s hashrate reached an all-time high of 1.031 ZH/s on August 4, based on data from Glassnode. Alongside this, adoption is growing in the U.S. market.
President Trump’s policy allowing 401(k) crypto inclusion has opened a $9 trillion market. Crypto-linked equities and ETFs have also seen strong inflows, supporting long-term price action.
#highlights #everyone #premium #BinanceSquareFamily #Binance #BTC☀ #SUBROOFFICIAL
Disclaimer: This article is for informational purposes only and does not constitute financial advice. Always conduct your own research before making any investment decisions. Digital asset prices are subject to high market risk and price volatility. The value of your investment may go down or up, and you may not get back the amount invested. You are solely responsible for your investment decisions and Binance is not available for any losses you may incur. Past performance is not a reliable predictor of future performance. You should only invest in products you are familiar with and where you understand the risks. You should carefully consider your investment experience, financial situation, investment objectives and risk tolerance and consult an independent financial adviser prior to making any investment.

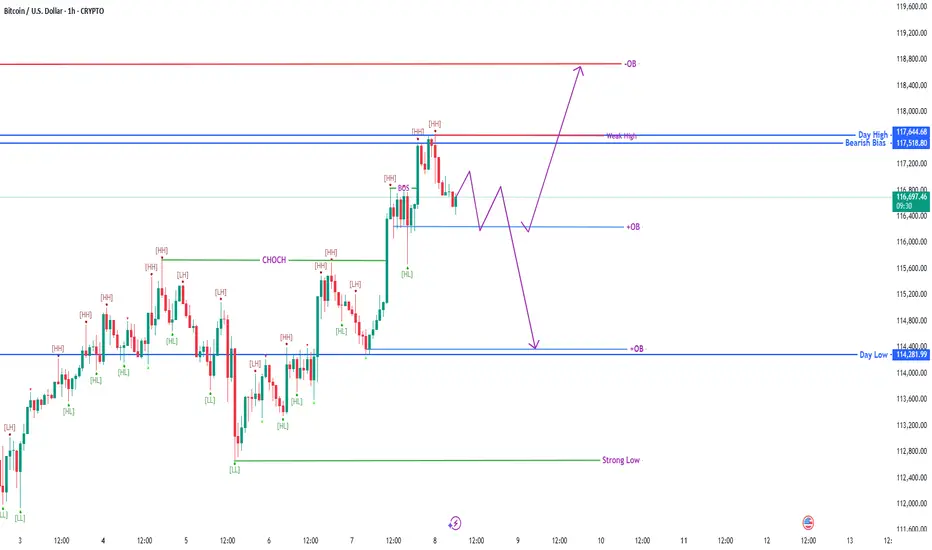
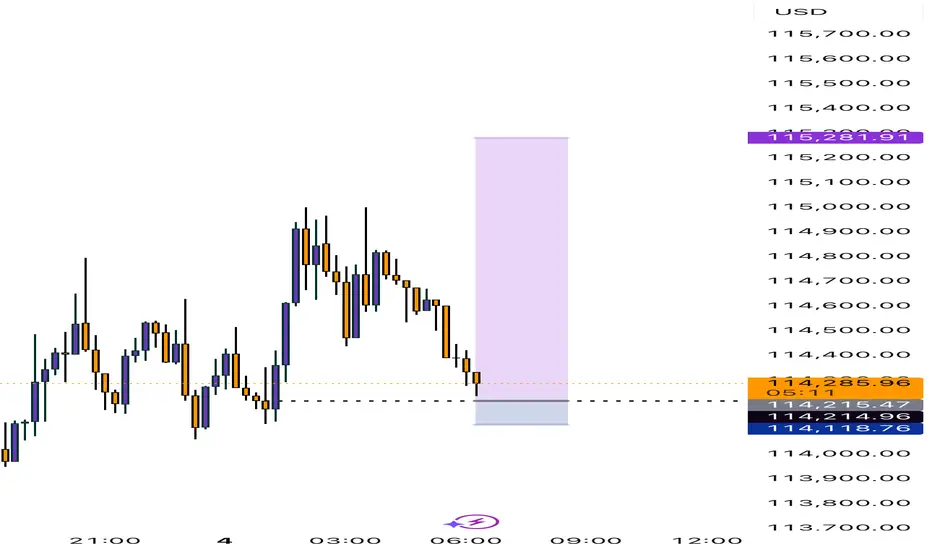
BTC/USD 1H – Weak High in Play | OB Reaction Zones AheadPrice is currently consolidating below Weak High and just above the mid OB zone.
Two key scenarios in play:
1️⃣ Pullback into OB → Bullish breakout toward upper OB around 118.8k.
2️⃣ Failure to hold OB → Bearish move targeting lower OB near 114.2k.
🔹 Structure shows HH, HL with BOS confirming bullish control, but liquidity sweeps remain possible.
🔹 Watch OB reactions for clean entry triggers.


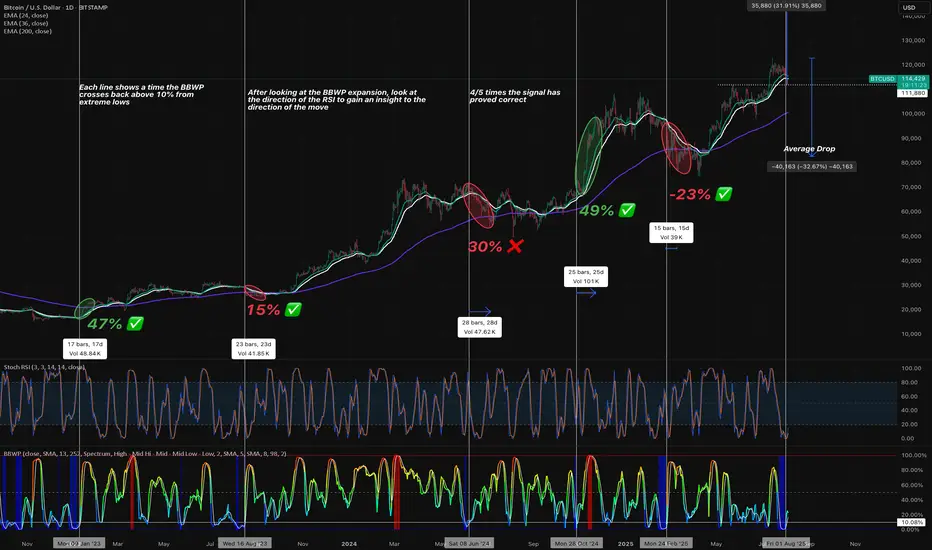
BTC Expansion BTC expansion after a low reading on BBWP. The stochastic RSI gives us an idea of the direction of the move.
BTCUSDT — No New D1 BUY Signal YetBTCUSDT — No New D1 BUY Signal Yet
Even as BTCUSDT pulls back, I’m confident we still have one more D1 peak ahead — likely pushing above the 123k zone — before it gradually tops out on the D1, then W, and eventually the M timeframe.
When that happens, BTC will start to decline, TOTAL will see outflows, and TOTAL2 and TOTAL3 will follow suit. In other words, BTC and TOTAL will hold their top range to give altcoins (which began their run in July) time to form their own W tops. Once that’s complete, the entire market will decline together — potentially bringing TOTAL down toward the $2.5T level.
That stage of the market will feel bleak and hopeless, but it will also be the moment to accumulate assets forming W bottoms.
For now, we wait for one more drop on H4 to long BTC. As for altcoins you already hold — XRP, ZEN, LTC, HBAR, XLM, ETH, LINK, and others — keep holding. It’s not yet the time to take profits.


BTC Elliott Wave medium term analysisCRYPTOCAP:BTC is still consolidating, as shown on the charts.
The structure is shaping up like a classic Elliott Wave 1–2–3–4–5 pattern, with the 4th wave now in play.
This could mean another retest of $110,500 before launching into the final, larger 5th wave 🚀.
The 4th wave might present a solid long entry opportunity heading into the 5th.
📊 DYOR – trade safe.

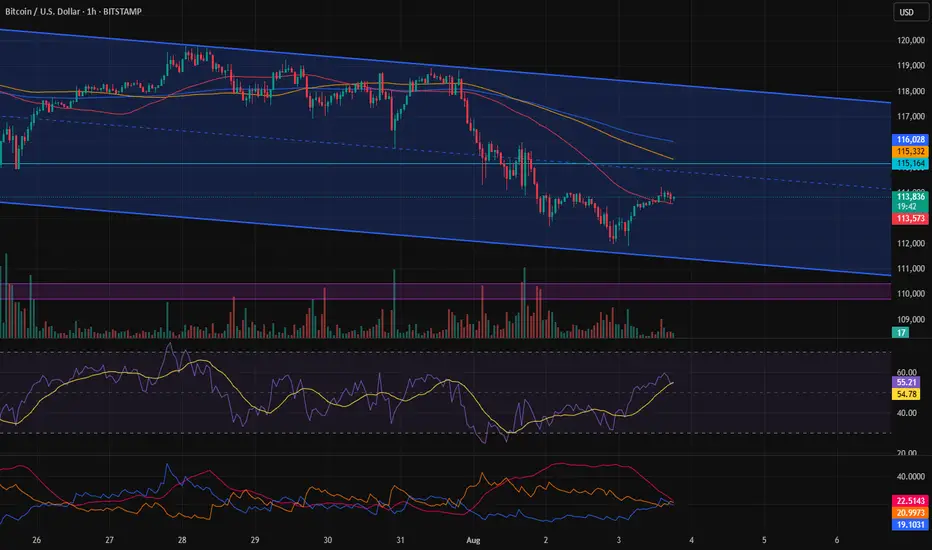
BTCUSD manages to hold the lower border of the – Rebound LikelyBTCUSD manages to hold the lower border of the descending channel, ready to rebound.
BTCUSD broke below 116,000.00 support level on August 1 and declined towards 112,000.00 support level. Afterwards, the asset successfully rebounded from it. Although, we noticed 2 false breakouts of the channel, in general the asset tries hold itself within the descending channel, still showing us the strength of this formation.
Here, the rebound towards 118,000.00 level is expected with intermediate consolidation slightly above the 116,000.00. In the long term, the asset still moves within the descending channel, so no new long-term bullish momentum is expected.

BITCOIN LOG UPDATESThis meaningful indicators on logarithmic, Since 2022- now I still used this on BITCOIN.
it works, some of my followers doubt this but its fine, we might see 170k per bitcoin by end of this year? This predictions base on the logarithmic , this indicator shows how the supply works with only 21M bitcoins, unlike other commodities. Bitcoin is the most followed commodities on this indicator I rarely used.
Youve come here so far to know bitcoin, here is my chart for this year. It will keep Bitcoin hard to buy until it reached a million per coin, then the public regret it.
Keep the word DCA. Goodluck.
Holding it is the key.

End of the correction and continuation of the drop?Given the recent days of decline, it’s become much harder for Bitcoin to move up. It needs significant volume to break through the resistances ahead, and from a technical perspective, I don’t see that volume. I prefer a bearish scenario for now, as it could offer better short opportunities.
Update on last BTCUSD trade idea.Price successfully broke the pattern and made a significant rally.
Cheers to who followed. Want to be part of my Telly?
Chat me privately on TV’s private chat section

Bitcoin remain bullish Btcusd remain bullish, with price showing signs of strength.
I am seeing a stable trend with minimal vitality, indicating potential continuation of the uptrend.
Resistance and support level on daily timeframe
Resistance 117,672
Support 115,894
Trade setup
Entry 116,500
Stop loss 115,800
Take profit 117,500

BTCUSD important support at 112,760The BTCUSD remains in a bullish trend, with recent price action showing signs of a corrective pullback within the broader uptrend.
Support Zone: 112,760 – a key level from previous consolidation. Price is currently testing or approaching this level.
A bullish rebound from 112,760 would confirm ongoing upside momentum, with potential targets at:
117,680 – initial resistance
119,760 – psychological and structural level
122,100 – extended resistance on the longer-term chart
Bearish Scenario:
A confirmed break and daily close below 112,760 would weaken the bullish outlook and suggest deeper downside risk toward:
111,070 – minor support
108,800 – stronger support and potential demand zone
Outlook:
Bullish bias remains intact while the BTCUSD holds above 112,760. A sustained break below this level could shift momentum to the downside in the short term.
This communication is for informational purposes only and should not be viewed as any form of recommendation as to a particular course of action or as investment advice. It is not intended as an offer or solicitation for the purchase or sale of any financial instrument or as an official confirmation of any transaction. Opinions, estimates and assumptions expressed herein are made as of the date of this communication and are subject to change without notice. This communication has been prepared based upon information, including market prices, data and other information, believed to be reliable; however, Trade Nation does not warrant its completeness or accuracy. All market prices and market data contained in or attached to this communication are indicative and subject to change without notice.

Moon Street Cheat Sheet
All same color lines are idendical to eachother ( copies )
3 times since BTC's beginning, they have been pretty accurate with both time and angle ( on log chart )
is 4th time the charm , or was it the 3rd ?
We shall see

It seems like no one likes non-panic morning posts...Futures are like a rented Ferrari, spot is like a purchased Mercedes.
There are hidden reserves under the melting volumes. What do you think about the current denouement?

Wait for the BUY BITCOIN ON FIREthis is my newest strategy for bitcoin , the overall sentiment is bullish , we are just ranging and retracing the 112K zone , once its goes back to that levl give it a buy

Bitcoin - Will Bitcoin reach its previous ATH?!Bitcoin is below the EMA50 and EMA200 on the four-hour timeframe and is in its short-term descending channel. In case of an upward correction, Bitcoin can be sold from the specified supply zone, which is also at the intersection of the ceiling of the descending channel.
It should be noted that there is a possibility of heavy fluctuations and shadows due to the movement of whales in the market and compliance with capital management in the cryptocurrency market will be more important. If the downward trend continues, we can buy in the demand range.
In recent days, Bitcoin has stabilized below the $120,000 mark, a development that reflects increasing structural maturity in the market and strong institutional capital inflows. Unlike in previous cycles, where price rallies were largely driven by retail hype, the current liquidity flows are channeled through regulated and professional instruments like ETFs. During the month of July alone, Bitcoin ETFs attracted over $6 billion in inflows, marking the third-highest monthly inflow in their history. Leading this trend were BlackRock’s IBIT and Fidelity’s FBTC, which together recorded more than $1.2 billion in net inflows within a single week. This signals a shift in trust from traditional investors toward crypto markets—within transparent, traceable, and regulated frameworks.
On-chain metrics further validate this shift. The MVRV ratio, which compares market value to realized value, is currently fluctuating between 2.2 and 2.34. These levels do not indicate profit-taking extremes nor fear of major corrections, but instead point to a healthy and rationally profitable market. Meanwhile, the supply of Bitcoin held in non-exchange wallets is rising, while exchange-held balances have dropped to their lowest levels in a decade, now accounting for just 1.25% of total supply. This trend implies reduced short-term selling pressure, as coins transition from liquid to long-term holdings.
Trader behavior is also evolving. Unlike previous bull runs, profit-taking remains controlled. The SOPR index, which measures realized profit relative to purchase price, has not yet reached saturation levels. This suggests that current holders are not satisfied with existing gains and are anticipating higher price levels. Furthermore, metrics like daily active addresses remain stable, indicating a lack of speculative retail influx. The network’s current dynamics resemble those of mature traditional markets, where investment decisions are guided by analysis, discipline, and long-term perspective.
Analysts at major financial institutions believe that if this trend continues, Bitcoin could reach targets of $180,000 to $200,000 by year-end. A more conservative scenario places the $95,000 to $100,000 range as a strong support zone—especially if political, regulatory, or macroeconomic pressures intensify. Overall, the convergence of institutional capital, rational trader behavior, stable on-chain conditions, and regulatory clarity has transformed Bitcoin into a more structured and dependable asset than ever before.
Ultimately, Bitcoin is no longer just a speculative tool. It has secured its role as a legitimate asset within the portfolios of global financial institutions. Even if the pace of capital inflow is slower than in previous cycles, the underlying structure is more robust and sustainable—offering a clearer path toward broader global adoption and higher valuation.
Nonetheless, recent data from CryptoQuant suggests that long-term Bitcoin holders (LTHs) have begun net selling near the $120,000 resistance zone—a psychologically significant level in Bitcoin’s price history. Analysts interpret this as a potential sign that veteran investors—those who entered during earlier market cycles—are now realizing profits as prices reach historic highs. If short-term holders follow suit, this shift could amplify selling pressure and trigger heightened price volatility.

Bitcoin: follows general sentimentShort term general market correction occurred at Friday's trading session, after the release of weaker than expected non-farm payrolls data. This time the crypto market was also part of this general correction, where the price of BTC broke toward the downside, ending the week modestly below the $114K. There is a general unrest among investors that implementing trade tariffs would negatively impact the US economy in the future period, in terms of company earnings, in which sense, they took the defensive strategy for their assets, including crypto.
During the first half of the week, BTC was holding firmly between the range of $117K - $119K, with most of the trades around the $118K. However, the final break occurred at Friday's trading session, where a general sell-off occurred on financial markets, pushing BTC down to $114K. Weekend dropped the level of BTC below the $114K, currently moving around the $113,2K. The RSI closed the week at the level of 41, where a clear oversold market side has not been reached. Interestingly, the MA50 is still holding the up-course, still moving away from the MA200. There is still no indication over a potential cross in the near term period.
The week ahead will be a week where investors will digest all data from this week in a quest for a new equilibrium level. Some corrections are still possible, both toward the downside or the upside. In case that the market decides on a further correction, then the level of $112K first emerges on charts, before the $110K support is tested. In case of a reversal, the first level to be tested is the $115K.