BTC/USD Short Setup – Breakdown from Bear Flag Edge🚀||| 👆Your Boost is appreciated in Advance👆 |||🚀
Thesis: Bitcoin is trading within a well-defined descending channel, potentially forming a bear flag on the higher time frame. Price is currently hovering just below the key resistance zone near $108,600 (“The Edge”), failing to reclaim the upper boundary of the flag.
==================================================================
Entry: 🔻 Short at $106,850 – Price is rejecting the upper channel resistance and failing to break above “The Edge”
Stop-Loss: 🔺 $109,000 – Above the recent swing high and invalidation of the flag structure
Take-Profit 1: ✅ $104,700 🎯
Take-Profit 2: ✅ $102,400 🎯
Optional extended:
TP4: $98,000 – Full measured move of the flag breakdown
Risk-Reward Ratio: ~1:1 to 1:4 depending on target
====================================================================
#MJTrading
#BTCUSD #Bitcoin #CryptoTrading #ShortSetup #BearFlag #TechnicalAnalysis #PriceAction #MarketStructure #SwingTrade #TradingView
BITCOIN trade ideas

SYMMETRYHey traders, hope you’re crushing it this week! 🚀 Quick note on our BTC/USD 4-hour ABC setup: the symmetry I’m talking about is purely price-based—AB and BC move roughly the same number of ticks, not the same amount of time.
So when we say “symmetry,” we mean:
A→B drop: ~3,670 ticks
B→C rally: ~3,427 ticks
That close price match gives us confidence in our PCZ at 107,600–107,300 (78.6%–100% retrace of B→C).
⚔️ Trade Plan Recap
Entry: Long between 107,300–107,600
Stop: Below 107,000 (keeps risk tight)
Targets:
Zone 1: 61.8–78.6% of B→C → 110,657–111,569
Zone 2: 127.2–161.8% extension of A→B → 114,206–116,084
Remember: look for that bullish pin-bar or engulfing candle down in our PCZ before pulling the trigger, and bail if we lose 107,000. No time-based symmetry here—just clean price alignment. Trade with structure, not emotion, and keep an eye on any macro or on-chain news for extra context. ✌️

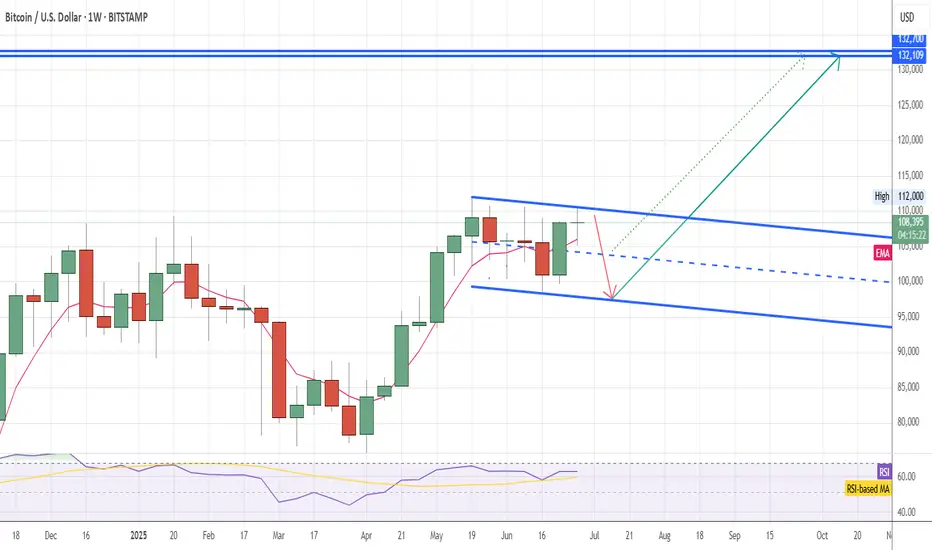
BTC waiting for channel breakBTC is compressing in a falling channel: in my view in the short term it could retrace at least to the channel mid line (around 104k) maybe to the channel lower trendline (around 97,5 - 97,8k).
Once the channel will be broken BTC will reach final bullish cycle target in the range
(132,109k - 132.700k) , then bearish cycle will start in autumn
BTCUSD going long after breaking resistance Price heading towards previous high after strong move up from the 200 ema.
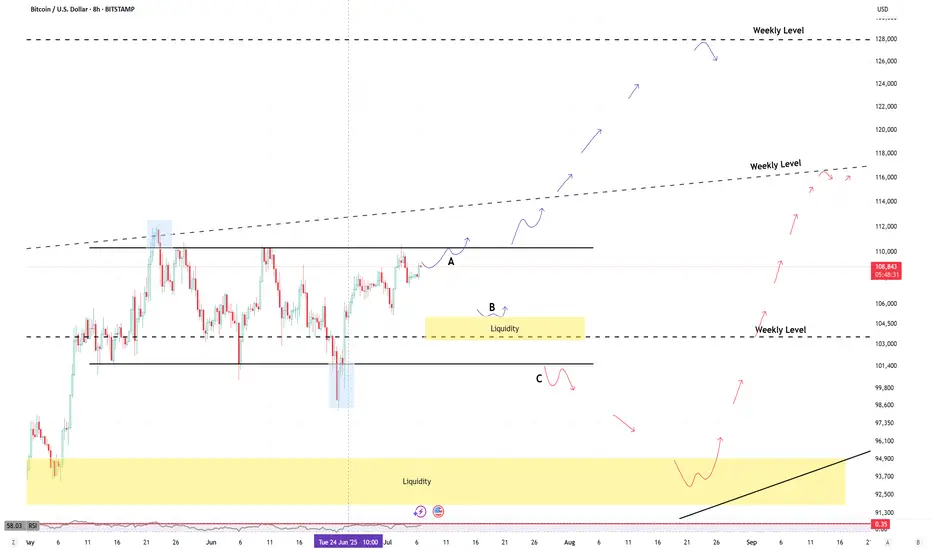
BTC Summer Roadmap: Key Levels & Breakout ScenariosBTC has retested the weekly resistance trendline (around $114K) that has been in place since February 2021. Over the past 4 years, this trendline has been tested four times, and a fifth retest appears imminent in the short term.
Historically, a fifth retest often leads to a breakout. If that breakout occurs, the next major target for BTC is around $128,000.
That said, the market rarely moves in a straight line.
As outlined in the chart, I’ve considered three potential scenarios for BTC to unfold this summer.
New trades will be based on these movements, with optimal entries either at the yellow-highlighted zones or upon a confirmed breakout above the current weekly resistance.
Disclaimer:
This analysis is based on my personnal views and is not a financial advice. Risk is under your control.
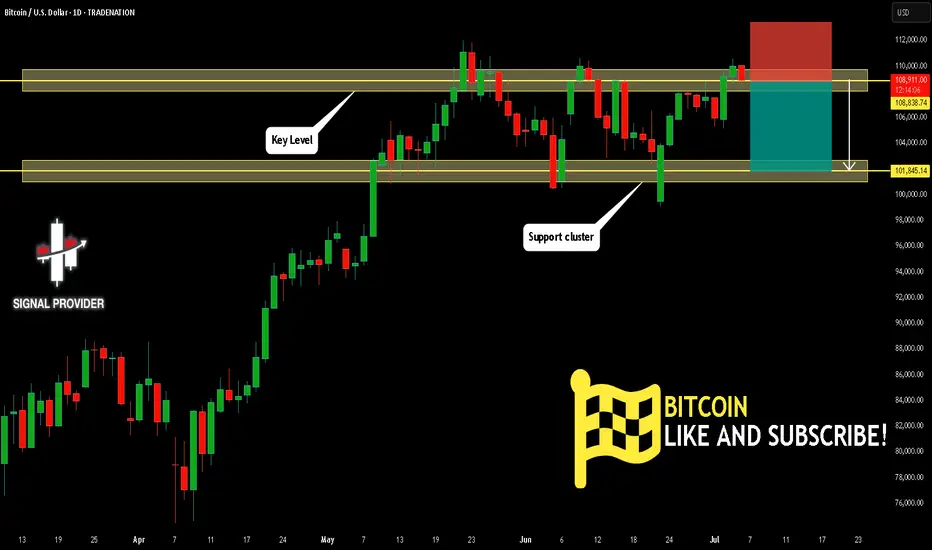
BITCOIN Will Fall! Sell!
Please, check our technical outlook for BITCOIN.
Time Frame: 1D
Current Trend: Bearish
Sentiment: Overbought (based on 7-period RSI)
Forecast: Bearish
The price is testing a key resistance 108,838.74.
Taking into consideration the current market trend & overbought RSI, chances will be high to see a bearish movement to the downside at least to 101,845.14 level.
P.S
The term oversold refers to a condition where an asset has traded lower in price and has the potential for a price bounce.
Overbought refers to market scenarios where the instrument is traded considerably higher than its fair value. Overvaluation is caused by market sentiments when there is positive news.
Disclosure: I am part of Trade Nation's Influencer program and receive a monthly fee for using their TradingView charts in my analysis.
Like and subscribe and comment my ideas if you enjoy them!
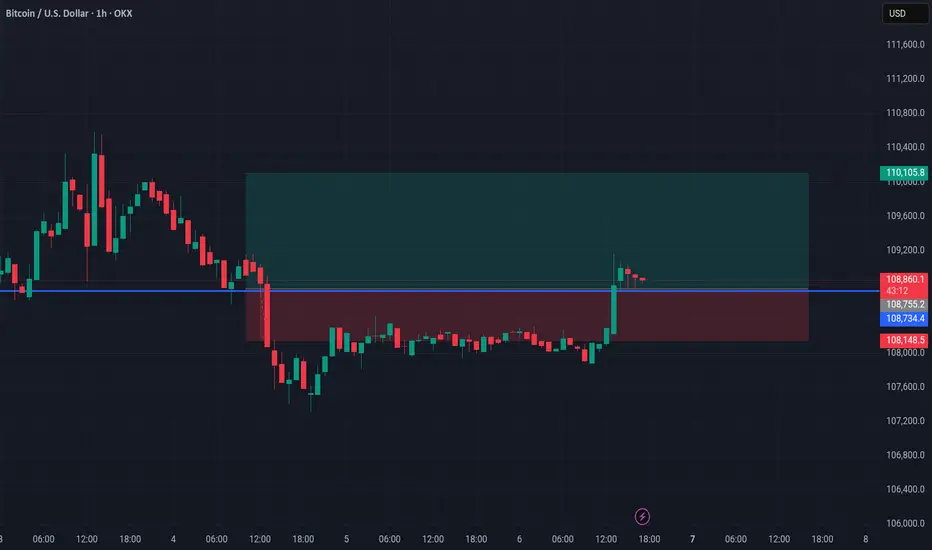
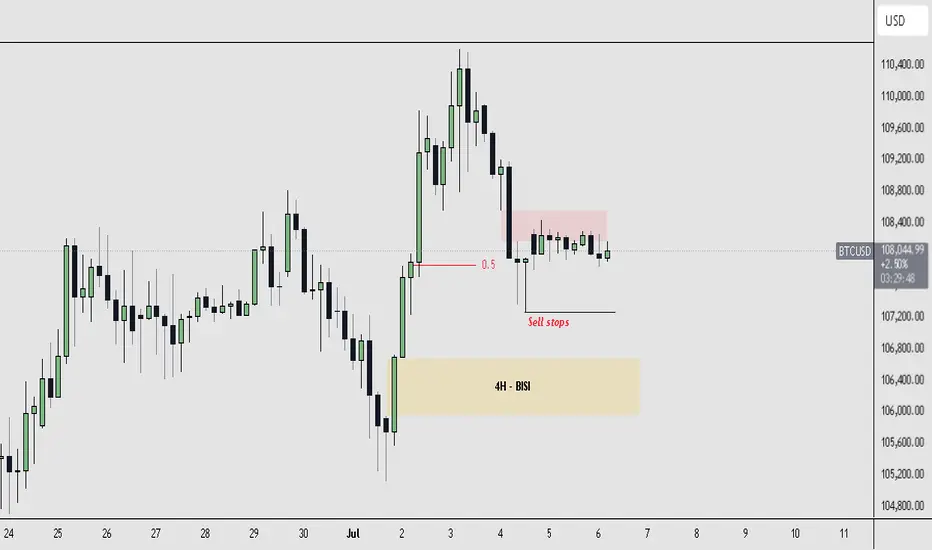
$BTCUSD Trade Idea Currently, BTCUSD is operating within a defined dealing range between $105,000 (low) and $110,600 (high). Price is consolidating near the equilibrium (0.5 level) of this range and forming a sideways structure just above visible sell-side liquidity.
We are seeing confluence with a 4H SIBI (Sell-side Imbalance, Buy-side Inefficiency) overhead, which is currently capping price and adding to short-term bearish pressure. At the same time, price is hovering above a clear liquidity pool marked by sell stops, creating a potential for a liquidity sweep scenario.
Below current price action lies a well-defined 4H BISI (Buy-side Imbalance, Sell-side Inefficiency) zone, which serves as a strong demand area and an ideal draw on liquidity before any potential bullish continuation.
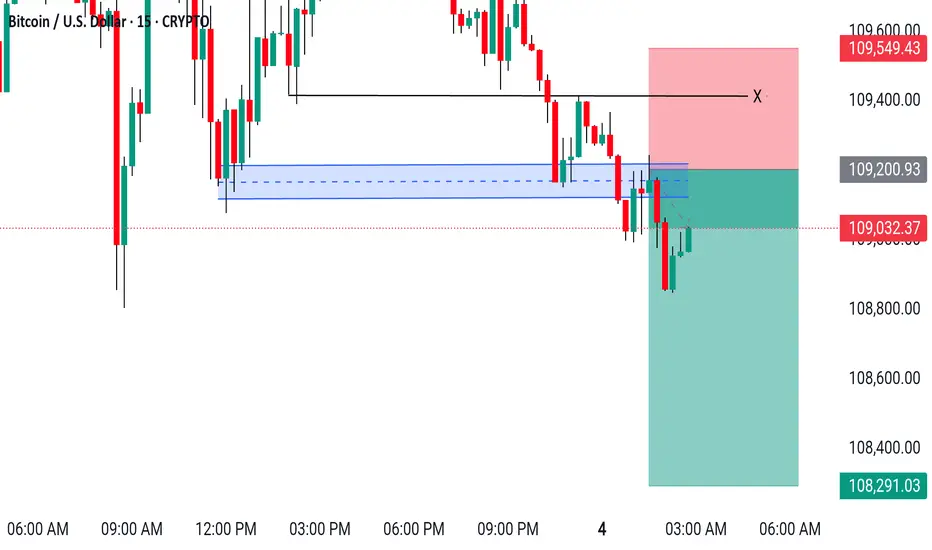
BTCUSD Sell Setup (15M) Chart Analysis BTCUSD Sell NOW
Entry: ~ 109,200
Target : ~ 108,600
Target : ~ 108,290
SL : ~ 109,550
BTCUSD TRADES SIDEWAYS DUE TO A LACK OF DRIVING FACTORS
BTCUSD has been moving within sideways since the end of last week. This week there will be lack of news. The first significant will be FOMC minutes tomorrow, which will definitely affect the DXY index and bitcoin. So before that time I expect that the sideways dynamic of the asset will remain.
So, nothing to trade? Not really
We may consider entering long positions at a current price with a take profit nearby 0.786 Fibo and a stop loss just below the previous low:
🔼 a market buy order at 108078.50 with
❌a stop loss at 107389.50 and
🤑a take profit at 109176.65
After that I expect the price to rebound from the upper border of the triangle. Maybe will consider another long entry.

BTC/USDT HIDDEN PATTERN! SM, FIB AND MORE COMFIRMED!Price Resilience Amid Geopolitical Stress
Bitcoin demonstrated remarkable strength during the Israel-Iran conflict, briefly dipping to ~$98K but swiftly rebounding above $105K. This aligns with historical patterns where BTC initially sells off on geopolitical shocks but recovers aggressively within weeks, outperforming gold and equities by 15-60% post-crisis. There is a $96K-$94K "footprint" that coincided with institutional accumulation, evidenced by $1.37B in spot ETF inflows during the conflict week, led by BlackRock's IBIT ($240M single-day inflow) according to official information. This institutional backstop and many others might single-handedly prevented a deeper correction for now, remember that smart money psychology is to create cause out of thin air and buy during selling and indecisive times.
Critical Levels to Watch
Immediate Support: $108k area is vital. A sustained hold here maintains short-term bullish momentum. The 50-day SMA near $102.8K (tested during June 13 conflict sell-off) remains a macro support floor.
Resistance & Targets: The $112K ATH is the near-term ceiling. Breaking this requires stronger spot demand—currently, net exchange inflows are negative, indicating weak retail participation or traders that are backing off for now.There's a $120K target (0.618 Fib) aligned with Standard Chartered’s $150K year-end model if ETF inflows persist.
Risk Zones: A close below $108.3K risks a slide to $105K. Failure here opens path to $96K and a further break of this 92k to 96k zone could lead directly to 70k area or even lower if economical and social activities are not favorable in the near to medium future.Dominance above 55% (currently 65%) delays alt season, but a break below 60% could ignite alts in a positive way.
Macro Catalysts & Market Sentiment
Policy Tailwinds: Trump’s "One Big Beautiful Bill" (proposing $5T debt ceiling hike and U.S. strategic BTC reserves) could weaken the USD, boosting BTC’s "digital gold" narrative. DXY’s -9% YTD drop already correlates with BTC’s 54% post-election rally.
Fed Influence: Pressure to cut rates (amid cooling employment data) may accelerate institutional rotation into BTC. ETF inflows hit $2.75B in late June, signaling renewed institutional FOMO.
Geopolitical Cooling: Iran-Israel ceasefire talks reduced immediate panic, but residual volatility risk remains. Traders note BTC often rallies 20-40% within 60 days of conflict events.
Structural Challenges
Liquidity Fragility: Whale moves (for example: 10K BTC sell orders) now impact prices more due to ETF-driven liquidity concentration. Recent $98K flash crash exemplified this.
Regulatory Overhang: MiCA compliance costs in the EU and U.S. security-reclassification proposals could pressure smaller tokens, though BTC’s status appears secure 28.
Seasonal Slump: July historically sees 6.1% of annual crypto volume—low volatility may delay breakouts until August 4.
Strategic Outlook
A July breakout above $112K could ignite the next leg to $120K, but a retest of $107K-$105K is likely first. Altcoins remain subdued until BTC dominance breaks <55%—select projects with institutional backing (for example, ETF candidates) or real-world utility for asymmetric opportunities.
Conclusion: BTC’s resilience amid chaos confirms its institutional maturity. Trade the $108.3K-$112K range aggressively, with a break above ATH targeting $120K by September. Always hedge tail risks (escalations, regulatory shocks) in this volatility-rich asset class. While this great surge in institutional inflow is good for BTC it also indicates a reduction or slower pace of other crypto currencies.
This is my analysis for BTC, let me know what you think and I hope you like it!

Bitcoin – The 270/100 CycleBitcoin isn’t just trading. It’s pulsing — in cycles that reward those who understand timing as much as price.
Over the last two years, BTC has shown a repeating pattern with surgical precision:
Range Phase:
Each macro consolidation lasts ~220 to 270 days, where price builds structure, absorbs supply, and prepares for its next expansion. This is the quiet phase — the zone where conviction is tested, and weak hands exit.
Impulse Phase:
What follows is a ~100-day vertical leg, where BTC surges between +50% to +80%, targeting the next macro resistance. We’ve seen this repeatedly:
Accumulate → Expand → Re-accumulate → Expand.

BTC Bull Flag Breakout or Fakeout? Eyes on $107K–$112K ZoneHere's my updated chart for Bitcoin (BTC/USD) on the daily timeframe. The price action is currently testing a key zone that could define whether we're heading into the next major leg up, or facing another rejection.
Pattern Breakdown:
- BTC is respecting a bull flag formation after a strong impulse leg earlier this year.
- The $105K level has held as critical support, keeping the bull flag structure intact.
- Price is currently pressing against descending resistance (~$107K) with tightening consolidation indicating an imminent breakout decision.
Key Levels to Watch:
Support:
$105K – holding this level keeps bullish momentum valid.
$101.6K (Bollinger midline)
$100.4K (EMA 100) – must hold for macro trend to stay intact.
Resistance (before $112K):
$107K – major descending trendline resistance.
$110.1K – upper Bollinger Band and recent local high.
$112.45K – key breakout level from the flag. A daily close above this could trigger a sharp rally.
Indicators:
MACD is forming a bullish crossover but lacks strong momentum, watch for a green histogram to confirm.
RSI at ~51 gives BTC room to run, not in overbought territory.
Volume is low, but coiling tight near the apex could spark volatility.
Conclusion:
BTC is at a critical decision point. A clean breakout above $107K, followed by sustained momentum through $110K–$112K, would significantly raise the probability of a confirmed bull flag breakout, with a potential move toward $120K+.
However, the $105K level is a key support that must hold to keep this structure intact.
If we see a daily close below $105K, attention shifts to the $101K level (Bollinger Band midline + 53 SMA).
A close below $101K would invalidate the bull flag entirely, turning this setup into a potential bull trap, and shifting short-term bias bearish.
All eyes are on the $107K–$112K resistance zone for confirmation—or breakdown signals if support levels give way.

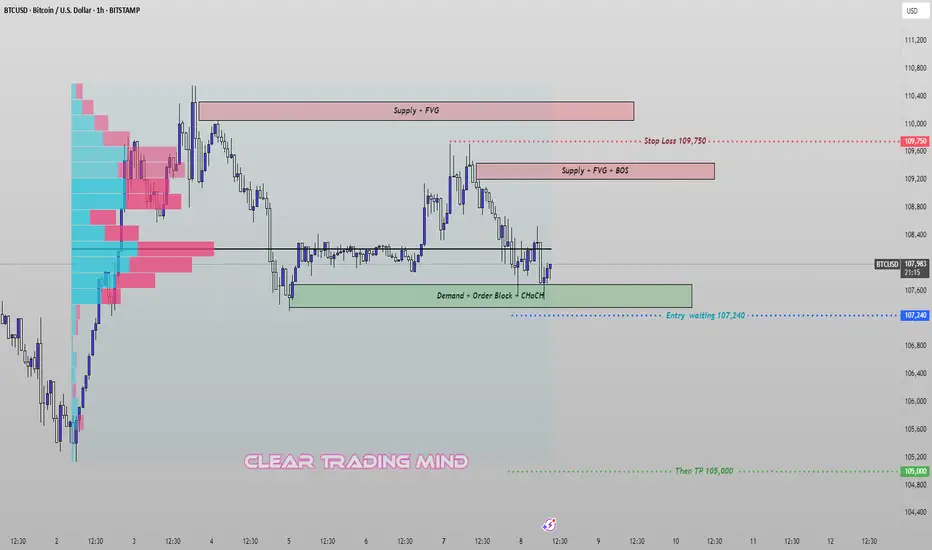
BTCUSD – Breakout Plan from Demand Zone (CHoCH + OB Setup)🔹 Current View:
I'm closely watching the 107,240 zone, where we have a strong Demand + Order Block + CHoCH (Change of Character) setup. This is a key support area that could trigger a fresh bearish move if broken.
🔹 My Plan:
I'm waiting for a clear breakout below 107,240 to enter a short position.
➡️ Entry: 107,240 (after confirmed breakout)
➡️ Stop Loss: 109,750 (above supply + BOS zone)
➡️ Target: 105,000 (previous inefficiency zone)
🔹 Supply Zones Noted:
- 109,250–109,500: Supply + FVG + BOS
- 110,000–110,500: Strong Supply + FVG
This trade is based on price breaking demand structure and retesting key supply areas above. Volume profile also shows heavy activity above, indicating possible resistance on any pullbacks.
BTCUSD M30 Bearish Outlook #BTCUSD M30 Outlook 🕒
BTCUSD looking bearish below 108,490 zone.
🎯 Target: 107,470
Bias: Lower highs & weakness on M30.

BTC Setup: 2.7 R:R"Bitcoin Poised for New Uptrend After Bull Flag Breakout Retest"
Bitcoin appears ready to begin a new uptrend after successfully retesting the breakout from a bull flag pattern and completing consolidation above key support.
This setup offers a 2.7:1 risk-to-reward ratio, with the following trade parameters:
Entry: $109,965.79
Stop Loss: $106,300
Target: $120,000
Bitcoin Awaits Breakout Above $114K🪙 Current Price: ~$109,500
📈 Trend: Bullish but facing strong resistance at $114,000
📉 Support: $106,000–$107,000
📌 Outlook: Breakout above $114K could lead to $130K+. Otherwise, possible pullback to $106K.
📊 Key Drivers: ETF inflows, Fed rate cut expectations, weak USD.
💡 Strategy:
🔺 Buy: $107,000 – $107,500 → TP $114,000 | SL $106,000
🔻 Sell (take profit): $114,000 – $115,000 → SL if closes below $112,000

Btcusdt tecenical analysis.Btcusdt tecenical analysia next move possible at h1 time frame.not fincial advice.

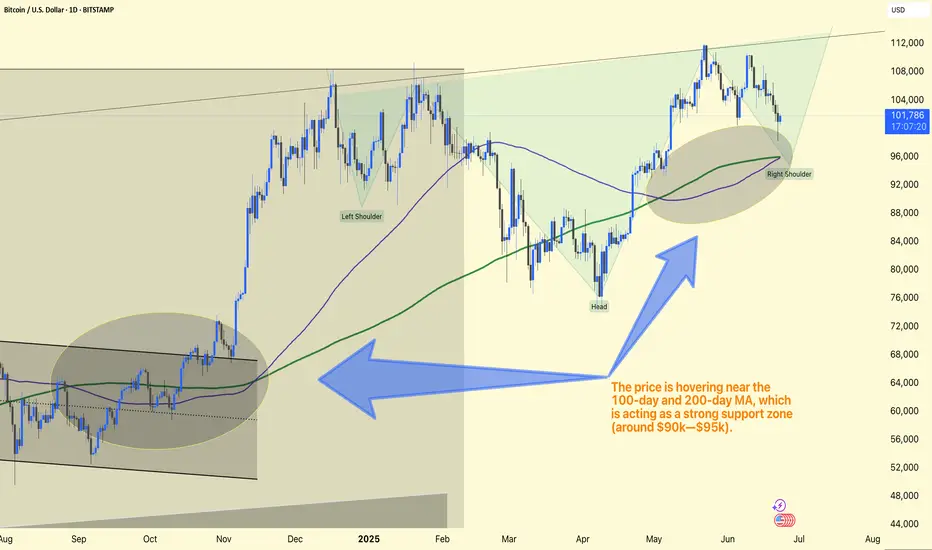
BTC/USD Analysis Update. Chart Pattern:
The chart clearly shows an Inverse Head & Shoulders structure:
Left Shoulder
Head
Right Shoulder
This is a strong bullish reversal pattern.
Moving Averages:
Price hovers near the 100-day and 200-day MA, acting as a strong support zone (around $90k–$95k).
This area is critical for sustaining long positions.
Expected Move:
Strong bullish potential towards the $113k–$115k zone, aligned with the upper trendline target.
RSI also suggests room for a bullish recovery from this zone.
Trade Plan:
Ideal Entry: Near $90k–$95k (Right Shoulder area)
Stop Loss: Just below $88k
Target: $113k–$115k
This structure is very favorable for long positions if the price confirms strength within the right shoulder zone.
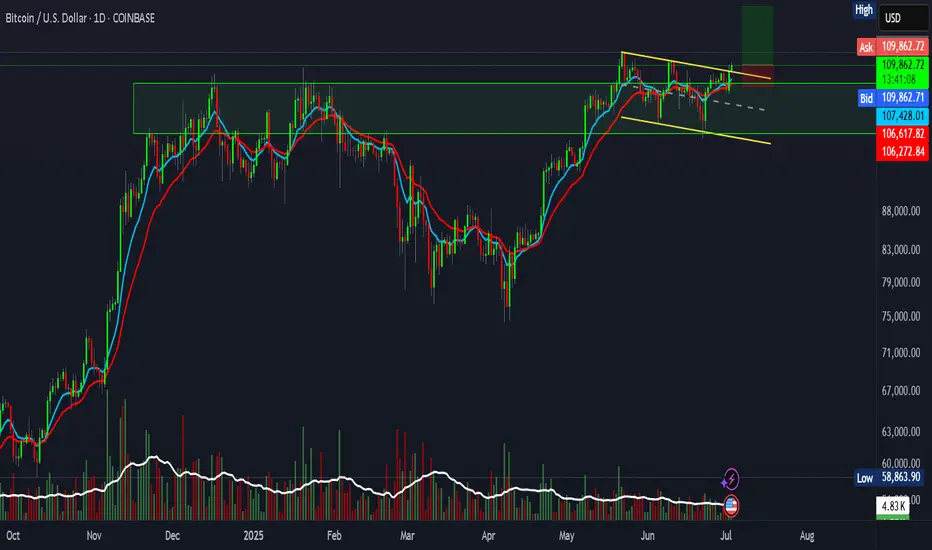
BTC wait for Long
Bitcoin continues to struggle with its long-term weekly resistance.
In the short term, it’s likely that BTC will consolidate within the $100,000–$112,000 range.
Positioning heavily into altcoins during this phase may not be ideal. It’s more prudent to wait for either a confirmed breakout above weekly resistance or a pullback toward the $94,000–$92,000 support zone.
For now, the focus remains on short-term trading opportunities within this range. A potential long setup is outlined in the chart.
Disclaimer:
This analysis is based on my personnal views and is not a financial advice. Risk is under your control.

BITCOIN Short From Resistance!
HI,Traders !
#BITCION went up sharply
Made a retest of the
Horizontal resistance level
Of 110026.5 from where we
Are already seeing a local
Bearish reaction so we
Are locally bearish biased
And we will be expecting
A local bearish correction !
Comment and subscribe to help us grow !


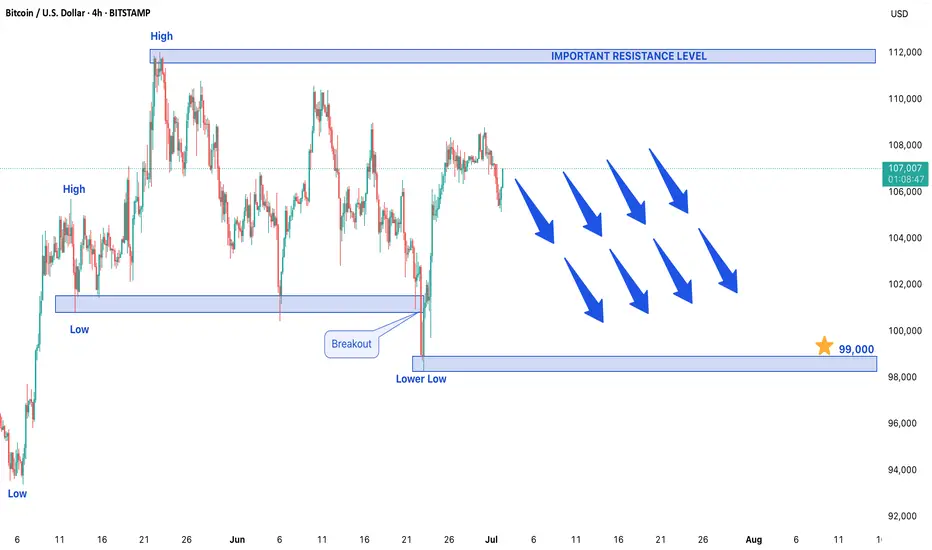
BITCOIN STRATED FORMING BEARISH TREND STRUCTUREBITCOIN SHOWS SIGNS OF BEARISH REVERSAL – KEY LEVELS TO WATCH
After an extended bullish run, Bitcoin is now showing early signs of a potential trend reversal as the market begins forming a bearish structure. The formation of a lower low on the price chart indicates weakening bullish momentum and suggests that sellers may be gaining control. This development comes after a sustained upward trend, signaling that a corrective phase could be underway in the cryptocurrency market.
Bearish Confirmation: Lower Low Formation
The appearance of a lower low is one of the most reliable technical indicators of a trend reversal. This pattern demonstrates that bears are successfully pushing prices below previous support levels, establishing a new downward trajectory. While this doesn't necessarily confirm a long-term bear market, it does suggest that Bitcoin could face further downside pressure in the near term. Traders should watch for confirmation through follow-through selling or additional bearish candlestick patterns.
Downside Target: $99,000 in Focus
If the bearish momentum continues, Bitcoin could test the $99,000 support level in upcoming trading sessions. This level represents a psychologically important zone where buyers may attempt to step in. However, a decisive break below this support could accelerate declines, potentially leading to deeper corrections. Traders should monitor volume and price action around this level for signs of either consolidation or continuation of the downtrend.
Resistance Level: $12,000 as Key Barrier
On the upside, $12,000 now acts as a critical resistance level. Any short-term rallies toward this zone could attract renewed selling pressure, reinforcing the bearish outlook. For the current downtrend to be invalidated, Bitcoin would need to reclaim and sustain above this resistance with strong buying volume. Until then, traders may consider selling into strength near this level while maintaining tight risk management.
Market Outlook: Correction Expected After Prolonged Rally
Given Bitcoin's history of volatile price swings, this potential reversal should not come as a complete surprise after its extended bullish run. Market participants should watch for:
- Increasing trading volume on downward moves (confirming bearish conviction)
- Potential bearish continuation patterns (like descending triangles or flag formations)
- Macro factors that could influence crypto markets (regulatory news, ETF flows, or macroeconomic shifts)
Conclusion
Bitcoin appears to be entering a corrective phase, with $99,000 as the next key downside target and $12,000 serving as major resistance. While the broader uptrend may still be intact long-term, short-term traders should prepare for potential bearish continuation. As always, proper position sizing and stop-loss strategies remain crucial in navigating Bitcoin's inherent volatility. A break above $12,000 would require reassessment of the bearish outlook.
Bitcoin [BTC1!] Draw and Bias. 05.07.25, SaturdayLooking for bullish action on BTC. No stance on alts.
