Apple (AAPL) Gains Momentum with 5 Swing Rally, Upside LikelyApple Inc. ( NASDAQ:AAPL ) is showing signs of strength as it builds momentum in a classic Elliott Wave structure. Today’s chart highlights a 5-swing rally from 208.4 low that has propelled the stock higher, signaling potential for further upside in the near term. After establishing a solid base, NASDAQ:AAPL has completed a 5-swing sequence—a bullish pattern often seen in trending markets. The rally began from a key support zone of 184.6 – 209.5. The latest leg up has ended wave (1) in 5 swing, suggesting the short term trend shifts to the upside. As long as pullbacks hold above the recent swing low, the path of least resistance is upward.
The immediate support sits at the prior swing low at 208.4. A hold above this zone keeps the bullish outlook alive. A break below this critical level would negate the bullish view, potentially signaling a deeper correction. Expect pullback in wave (2) to find support in 3, 7, or 11 swing for further upside. For those looking to join the trend, consider waiting for a 3 waves dip toward 100% – 161.8% Fibonacci support to optimize the risk-reward ratio. Define your entry, stop loss, and target ahead of time—tools like the Position Size Calculator can help fine-tune your approach.
AAPL trade ideas
Heading for 4 days of strong gains, gold gets support from TrumpIn the Asian session, spot gold
XAUUSD
continued to rise, surpassing $3,145/ounce, up more than $24 on the day.
The global trade war has caused concerns in the market, continuing to push gold prices to new highs. Gold prices rose 8% in March and have increased for three consecutive months this year.
Gold prices have increased more than 18% this year, following a 27% increase last year, thanks to a favorable monetary policy environment, strong central bank buying and demand for exchange-traded funds (ETFs).
Trump: Tariff details could be announced soon (Bloomberg)
US President Trump said on Monday local time that details of the tariffs could be announced either Tuesday night (April 1) or April 2.
Trump also said the US would be “very friendly” to other countries and that tariffs could be significantly reduced in some cases. Trump then talked about other issues before returning to the tariff issue, adding: “The tariff plan is in place.”
White House spokeswoman Karoline Leavitt said on Monday that US President Trump will announce the reciprocal tariff plan “country by country” in the White House Rose Garden on April 2 and that no tariff exemptions are currently being considered.
In the latest escalation in the trade war, Trump is set to impose broad “reciprocal” tariffs on all U.S. trading partners on Wednesday, which he has called “Liberation Day.” Trump also plans to impose a 25% tariff on all non-U.S.-made cars this week.
Asked about the reciprocal tariffs and which countries would be affected, Leavitt declined to provide details. Asked whether lower tariffs would be applied to products used by U.S. farmers, Leavitt said “there are no exemptions at this time.”
Trump also said on Sunday that he would impose secondary tariffs of 25% to 50% on buyers of Russian oil if he determines Russia is trying to thwart U.S. efforts to end the war in Ukraine.
Gold Technical Outlook
XAUUSD
4 days of soaring, gold is heading for its fourth consecutive strong day as it breaks the target at the 0.618% Fibonacci extension of $3,139, followed by the target at the 0.786% Fibonacci extension of $3,177.
With the current technical conditions, there is no resistance or signal for a significant technical correction.
With the medium-term trend being highlighted by the price channel (a) and a blue price channel as the short-term trend. As long as gold remains above the EMA21, it will remain technically bullish in the long-term.
Meanwhile, the Relative Strength Index (RSI) is operating in the overbought zone but is not giving any signal for a possible correction to the downside.
For the day, the technical outlook for gold remains bullish, and any current pullback should be viewed as a short-term correction or a buying opportunity. With that, the notable positions for the uptrend are listed as follows.
Support: 3,139 – 3,128 – 3,113 USD
Resistance: 3,177 USD
This is the end of the article, wishing you a productive and happy working day
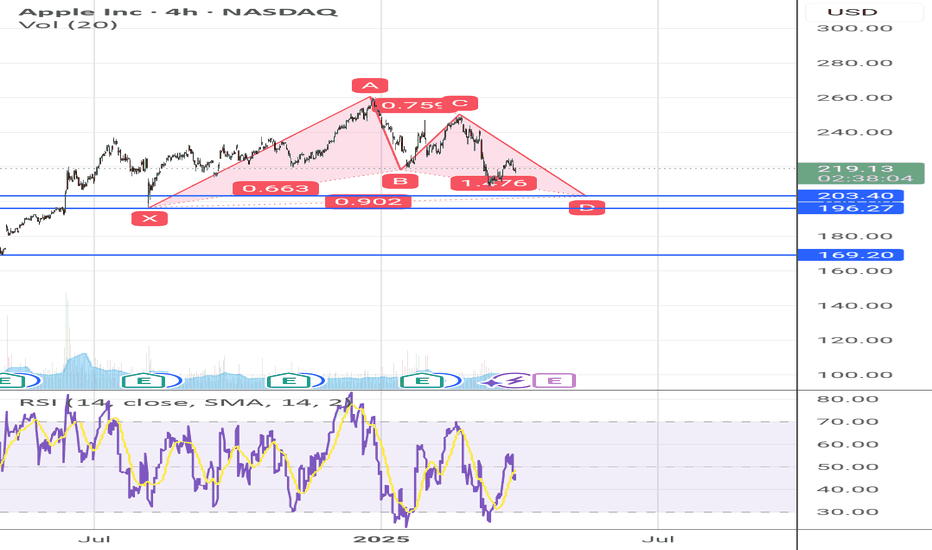
Long APPL between 196-205A bat pattern forming at 0.886 price at 203 at point D.
Pricing goes lower than 196 below point X, would invalidate the pattern.
The support of 196 is the previous resistance, which is why I see this pattern will soon test this points and a buy call might be realises.
Otherwise next support @ 169 would be the extreme for next buy call.
AAPL Breaks Structure! Will the 215 Level Hold or Crack Further?🧠 Smart Money Technical Analysis (1H Chart)
* Market Structure: AAPL recently broke its bullish trendline and confirmed CHoCH (Change of Character) twice, followed by a clear Break of Structure (BOS) on the 1H timeframe. Price is now in a minor bearish trend.
* Rejection Zone: Strong sell pressure came from the $225–$228 supply zone, which aligned with both CHoCH and BOS, acting as confirmation of distribution by smart money.
* Current Price: ~$217.26
Price is hovering just above the red support zone (~$215) — a key level. A breakdown here would suggest acceleration of the bearish move.
* Indicators:
* MACD: Bearish crossover and momentum pushing down, though histogram is flattening — potential loss of downside momentum.
* Stochastic RSI: Oversold, indicating a possible bounce, but not yet confirmed.
📊 Options GEX & Flow Analysis
* GEX Map:
* Gamma Resistance sits at $225–$228, aligned with Smart Money’s CHoCH zone.
* GEX Walls:
* 2nd CALL Wall: $227.5 (34.53%)
* Highest NETGEX: $222.5
* 3rd CALL Wall: $230 (39.67%)
* PUT Support Zones:
* Strongest PUT Wall: $215 (-81.59%)
* Next downside wall: $210 (-60.42%)
* Extreme Support: $200 (-21.37%)
* Options Oscillator:
* IVR: 54.3 — moderately elevated.
* IVx Avg: 38.4
* PUT$ Flow: 20% dominance, leaning bearish.
* Sentiment Lights: 🔴🔴🟢 — Bearish Bias with Caution
⚔️ Scenarios & Trading Ideas
🟢 Bullish Scenario (Low Probability)
* If $215 holds as support and MACD reverses:
* Entry: Above $218.50
* Target 1: $222.5 (Gamma magnet)
* Target 2: $225–$228 (Supply + GEX cluster)
* Stop: Below $214.50
🔴 Bearish Scenario (Preferred Bias)
* Break and close below $215 support opens downside:
* Entry: Under $214.50
* Target 1: $210 (Put Wall)
* Target 2: $205 / $200 (Deep put walls)
* Stop: Above $218
🔍 Summary
AAPL is currently sitting at a pivotal level ($215), with bearish momentum taking hold. If it loses this level, expect a slide toward $210 and possibly deeper. GEX positioning supports downside flow, while SMC shows supply zones were defended. Watch closely for any bounce or breakdown confirmation — this is a trader’s edge zone.
Disclaimer: This analysis is for educational purposes only and does not constitute financial advice. Always conduct your own research and manage risk appropriately.
Tecnical level for new buy entry is 185Not yet time to go heavy longs on Apple....If you wanna go heavy longs, 180-185 would be a safe level...If the channel breaks, then all hands in the air for a mega diarrhea fall.....I hope it doesn't come to that but....It looks like Wyckoff distribution at the moment for Apple....For very long term investors, buy some with every 10% dip.....
APPLE: Fibonacci Fractal Mapping IApple Inc has some complex cycles which we're about to breakdown to composite phases via fibonacci ratios.
REGULARITIES
Continuous Fractal
Since start 00's, bearish trends in Apple have notably shrunk in percentage terms, painting the past two decades as a period of ever growing optimism. Many long-term cycles remain incomplete for an extended time amplifying the opposing force.
A linear extensions through local tops can serve a future support level.
A parallel line of that same angle carries the same deterministic properties.
This unlocks use of Fibonacci channels to further analyze the structure factoring in specific side tilt.
Continuous Fractal Type - forces alternative approach in interconnecting critical points
Fibonacci Fractal Mapping
Fractal Hierarchy
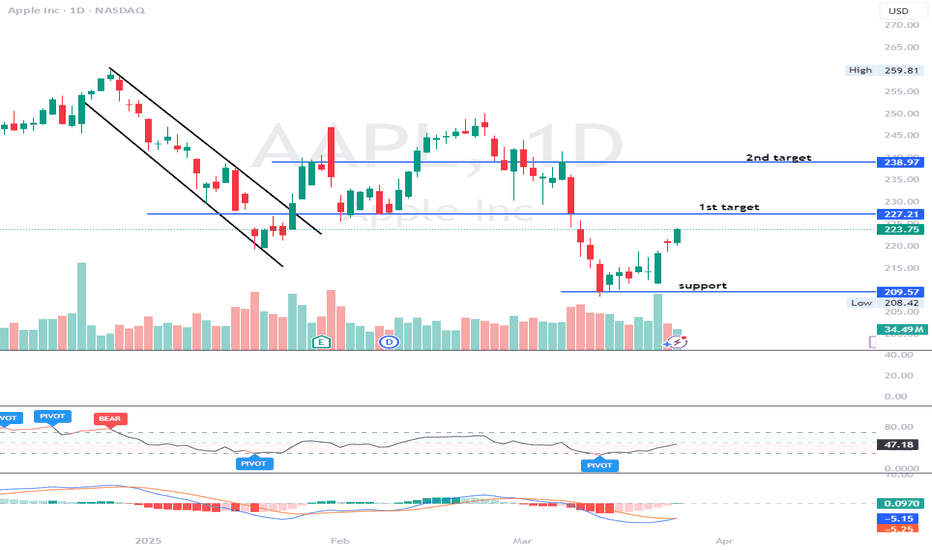
AAPL will go short Mar 27Based on recent price action and indicators (with RSI and MACD hinting at possible weakness on the higher time frame), a short setup carries roughly a 60% probability of success over the next trading session. Conversely, a long move has an estimated 40% chance if prices find support and reverse from the current vicinity.
A target near 219–219.5 might be reasonable.
AAPL Eyeing Gamma Reversal Zone – Will Bulls Defend the Pullback🍎 Technical Analysis (TA) – Intraday Setup
Current Price Zone: ~$221.39
* AAPL recently broke structure to the upside (BOS) after a clean reversal from the CHoCH zone near 210–213.
* Price tapped the supply zone at 225–227.5 (aligned with GEX call resistance) and is now retracing.
* This pullback is happening in low volume, hinting at a possible reload phase.
Indicators:
* MACD: Bearish crossover, but fading momentum — potential for a bullish crossover soon.
* Stoch RSI: Oversold and curling, signaling potential bounce opportunity.
🔐 Key Zones
Support Levels:
* 217.5 → HVL support zone, critical gamma level.
* 215 → Strong PUT support zone; multiple touches + GEX protection.
* 210 → 2nd PUT wall and base of previous accumulation.
Resistance Levels:
* 225 → CALL resistance (Highest NetGEX + Gamma Wall)
* 227.5 → 2nd CALL Wall
* 230 → Extended target / 3rd CALL Wall
🧠 GEX & Options Flow (TanukiTrade)
* GEX Sentiment: 🟢🟢🟢 — Bullish
* IVR: 39.1
* IVx avg: 30
* PUT$%: 14.7% → Dealers are likely hedged long → may support dips
* Gamma Wall: 225 → Key resistance (calls dominate here)
* HVL Cluster: 217.5 → strong likelihood of pin or bounce at this level
📌 This sets up a Gamma Pin Scenario between 215 and 225, with room to breakout if buyers step in early.
🛠️ Trade Scenarios
📈 Bullish Setup – Bounce at 217.5–215
* If AAPL reclaims 220+ after defending HVL, expect push to retest resistance.
* Entry: On reclaim of 222 with volume
* Target 1: 225
* Target 2: 227.5
* Target 3: 230
* Stop-Loss: Below 215
* Options Play:
* Buy Apr 12 $225 Calls
* OR Bull Call Spread: Buy $222.5 / Sell $230 Calls for a defined risk
📉 Bearish Setup – Breakdown Below 215
* Would indicate bulls failed to defend demand zone.
* Entry: On clean break of 215 with selling volume
* Target 1: 210
* Target 2: 208
* Stop-Loss: Above 218
* Options Play:
* Buy Apr 12 $210 Puts
* Bear Put Spread: Buy $215 / Sell $210
🧭 Final Thoughts & Bias
* Bias: Leaning Bullish above 217.5 — structure still supports higher low formation.
* If 217.5 breaks, watch 215 for final support test.
* GEX zones suggest dealers may support near 215 and sell near 225, so expect chop unless a catalyst forces breakout.
📛 Disclaimer: This analysis is for educational purposes only and does not constitute financial advice. Always do your own research and manage your risk appropriately.
APPLE My Opinion! BUY!
My dear subscribers,
My technical analysis for APPLE is below:
The price is coiling around a solid key level - 218.33
Bias - Bullish
Technical Indicators: Pivot Point sHigh anticipates a potential price reversal.
Super trend shows a clear buy, giving a perfect indicators' convergence.
Goal - 229.62
My Stop Loss - 213.08
About Used Indicators:
By the very nature of the supertrend indicator, it offers firm support and resistance levels for traders to enter and exit trades. Additionally, it also provides signals for setting stop losses
———————————
WISH YOU ALL LUCK
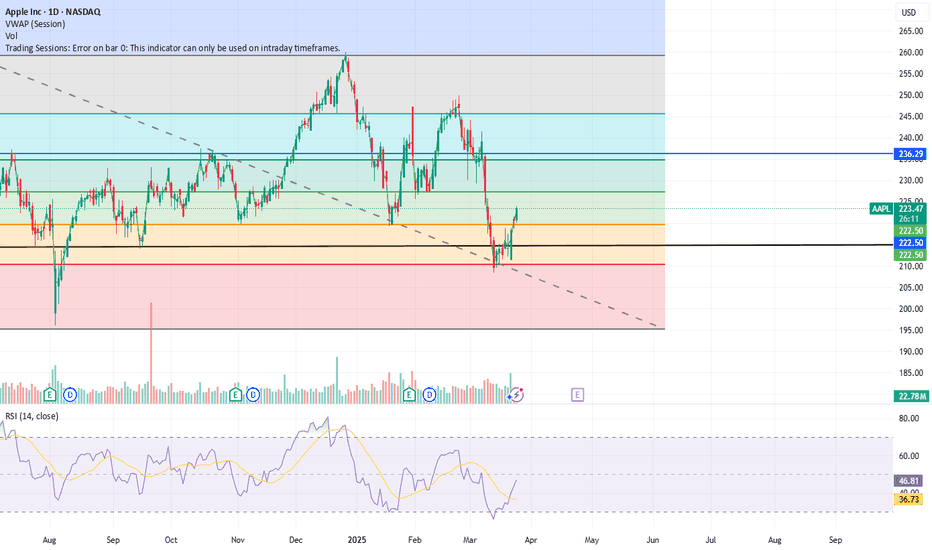
AAPL Bullish Opportunity – Momentum BuildingApple (AAPL) has recently pulled back and is now showing early signs of a bullish reversal. The price has bounced from key Fibonacci support and is reclaiming the 9 EMA — with bullish signals appearing on both MACD and RSI.
🔍 Technical Highlights:
✅ Bounce from 0.236 Fibonacci level
✅ MACD bullish cross forming with momentum picking up
✅ RSI climbing from oversold conditions
✅ Daily candles reclaiming the 9 EMA
✅ Room for continuation toward key retracement levels
📈 Fundamental Tailwinds:
🔹 Apple is entering the AI data center space, signaling a major expansion into infrastructure behind the scenes
🔹 The upcoming WWDC in June is expected to reveal powerful new AI software integrations across iOS and macOS
🔹 Apple remains one of the top “Magnificent 7” stocks, often leading institutional flows during tech recoveries
🔹 Anticipation is building ahead of new software announcements, which historically lift investor sentiment
📈 Trade Setup:
🟢 Entry Zone: $221–224
🔴 Stop Loss: Below $205
✅ TP1: $228 – 0.382 Fibonacci
✅ TP2: $234 – 0.5 Fibonacci
✅ TP3: $248 – 0.618 Fibonacci / resistance zone
Apple is now combining technical recovery with fresh fundamental momentum, creating a well-aligned opportunity for swing traders and position holders alike.
Apple.. Now becoming A-Peeling ??APPLE (APPL) has retraced about 50% of its range from April 2024
Currently I see a bullish Wolfe Wave emerging on a 4H timeframe.
Additionally points 2-3-4-5 have formed a nearly perfect ABCD pattern
We do need a broad market reversal and more business clarity from the Waffle House to engage.
I have indicated my targets.
A safer way to play this is to wait for a confirmation with an upwards break of the 1-3 line.
(~219/220 area)
Not about Investment advice. Do your own due diligence.
S.
AAPL Testing Crucial Reversal Levels! Breakout or PullbackQuick AAPL update based on the 1-hour charts, highlighting key reversal zones and Gamma Exposure (GEX) for options.
📈 Technical Analysis (TA):
* AAPL is currently testing a small green reversal zone around $220–$221, indicating potential bullish exhaustion.
* Recently established higher highs (HH) and higher lows (HL) suggest bullish momentum, but caution at current reversal zones is advised.
* Significant support identified in the red reversal zone at $208–$210; a strong area for buyers to step in if prices pull back.
* A Change of Character (CHoCh) observed at both red and green reversal zones confirms their importance for price action decisions.
📊 GEX & Options Insights:
* Strongest CALL resistance and highest positive NET GEX sit clearly at $225. Watch carefully for bullish confirmation.
* Solid PUT support noted at $210, aligning neatly with the red reversal zone—key downside protection.
* IV Rank moderate at 38.1%, suggesting balanced opportunities for debit and credit spread strategies.
* PUT sentiment currently at 9.2%, pointing to prevailing bullish sentiment but requires caution due to proximity to reversal levels.
💡 Trade Recommendations:
* Bullish Scenario: Look for a clear break above $221. Target $225, leveraging calls strategically. Stops recommended below $218.
* Bearish Scenario: Observe closely for rejection signals at $220–$221; consider puts targeting the lower reversal zone around $210.
* Neutral Approach: Moderate IV provides good conditions for Iron Condors or credit spreads between clear boundaries ($210–$225).
🛑 Risk Management: Keep your stops disciplined and your position sizes controlled, especially at these critical decision points.
Stay cautious and trade responsibly!
Disclaimer: This analysis is for educational purposes only and does not constitute financial advice. Always do your own research and manage your risk before trading.
Go Long on AAPL: Short-Term Bullish Outlook Awaits Next Week
- Key Insights: Apple shows robust potential in the tech sector, poised for a
rally despite internal challenges. Investors should monitor technical levels
as reclaiming key moving averages will indicate stronger bullish trends. The
stock's resilience amid economic challenges positions Apple favorably.
- Price Targets:
- Next Week Targets: Target 1 (T1) at $219, Target 2 (T2) at $228
- Stop Levels: Stop Level 1 (S1) at $211, Stop Level 2 (S2) at $206
- Recent Performance: AAPL has exhibited relative strength, gaining 2.24%
recently amid sector pressures. Remaining a key player in driving tech
sector momentum indicates potential upward movement.
- Expert Analysis: Market experts maintain optimism, suggesting careful
observation of Apple's ability to navigate innovation hurdles will be key to
maintaining upward trends. Positive momentum is anticipated with substantial
chances of leading a rally.
- News Impact: Apple faces internal challenges in AI development but retains
investor confidence. A notable increase suggests positive market sentiment.
Speculation around organizational changes could influence future
performance, indicating strategic adjustments.
APPLE: Long Signal Explained
APPLE
- Classic bullish pattern
- Our team expects retracement
SUGGESTED TRADE:
Swing Trade
Buy APPLE
Entry - 218.33
Stop - 212.02
Take - 231.04
Our Risk - 1%
Start protection of your profits from lower levels
Disclosure: I am part of Trade Nation's Influencer program and receive a monthly fee for using their TradingView charts in my analysis.
❤️ Please, support our work with like & comment! ❤️


