AMGN trade ideas

AMGN - Bullish TriangleStill bouncing inside the setup as consolidation move. Waiting for the price to bounce outside.

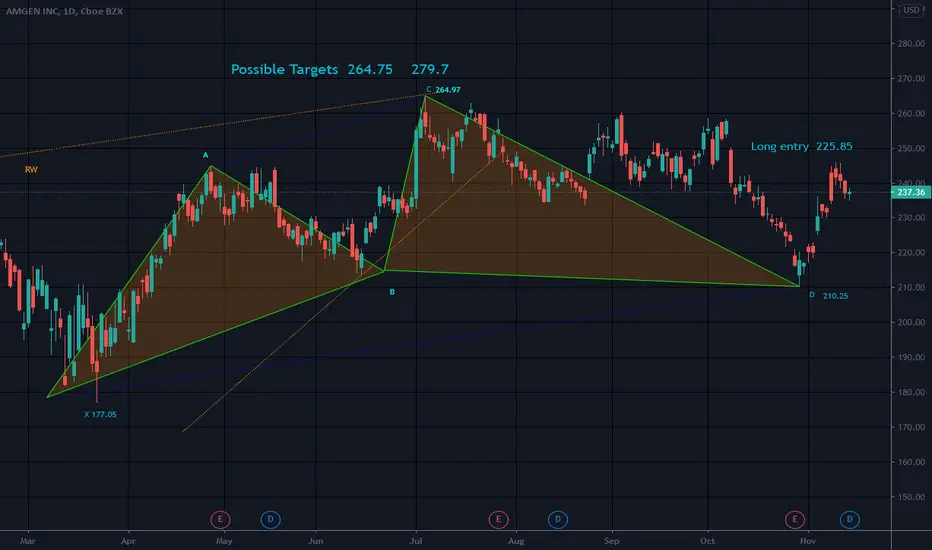
ABC BullishAmgn fell from a rw at 239ish and put a damper on the prior rally..it seems to be recovering ..
Looks like amgn made some sideways movement with R overhead..
Possible stop under C..
Pick a good entry if you like this stock and trade safely..
Long term uptrend...(20 yr monthly) with turbulence as of late..trend are hard to change though..like a big steam ship...they can't stop on a dime..but they can eventually stop and turn around...
Not a recommendation


$AMGN - NR Picks Nov 22Amgen se dedica a descubrir, desarrollar, fabricar y ofrecer terapias humanas en todo el mundo. Se centra en las áreas de inflamación, oncología / hematología, salud ósea, enfermedades cardiovasculares, nefrología y neurociencia.
La compañía tuvo una reacción positiva a inicios de mes cuando presentó una actualización de su fármaco para la psoriasis, durante el mes el precio de la acción fue cayendo hasta estar cerca a los niveles pre-reacción.
Este retroceso se ve como una oportunidad para Amgen , recordemos que esta compañía es una de las mas importantes del sector. Creemos que el interés de los inversores durante el mes ha cambiado a compañías que están brindando actualizaciones sobre el desarrollo de la vacuna contra el COVID-19.

$AMGN - NR Picks Nov 22Amgen se dedica a descubrir, desarrollar, fabricar y ofrecer terapias humanas en todo el mundo. Se centra en las áreas de inflamación, oncología / hematología, salud ósea, enfermedades cardiovasculares, nefrología y neurociencia.
La compañía tuvo una reacción positiva a inicios de mes cuando presentó una actualización de su farmaco para la psoriasis, durante el mes el precio de la accion fue cayendo hasta estar cerca a los niveles pre-reacción.
Este retroceso se ve como una oportunidad para Amgen, recordemos que esta compañía es una de las mas importantes del sector. Creemos que el interes de los inversiores durante el mes ha cambiado a compañías que estan brindando actualizaciones sobre el desarrollo de la vacuna contra el COVID-19.

AMGN UP or DOWNWe see all time triangle for amgn/spx,
recent descending channel and breakout with attempt to return to the channel
we possibly can go either way

Amgen Nears a Death CrossMany stocks have hit new highs this month, but Amgen isn’t one of them.
The biotech may be showing signs of topping out. The main thing jumping off its chart now is the falling 50-day simple moving average (SMA). Current prices have dropped back to the 200-day SMA. If the trend continues, it could produce a “death cross.”
Next, why is AMGN’s 50-day SMA falling? The reason can be found on October 8 when a potential heart drug failed to reduce death in a phase 3 trial. Its partner, Cytokinetics , lost more than 40 percent of its value on the news.
Third, AMGN’s last peak occurred at almost exactly the same price around $241 where it ended 2019. It’s back in negative territory YTD and at risk of potentially bearish window dressing into December.
Fourth, stochastics have been overbought -- even as the stock made a lower high versus early October.
Finally, relative strength has been poor in big pharma. Most of the gains in health care lately has been in HMOs, hospitals and medical devices. For an example of the weakness, just look at Pfizer or Gilead Sciences. Even with Covid products, they haven’t been able to advance.
Investors should always be wary of stocks falling when the market’s rising because it can foreshadow broader distribution.
TradeStation is a pioneer in the trading industry, providing access to stocks, options, futures and cryptocurrencies. See our Overview for more.


Bullish Cypher PatternPossible stop below D or 210.75
Possible long term targets 321.9 to 352
Amgen tried to break out several weeks ago and did not hit targets. Perhaps the bearish rising wedge won the battle
It has been a bit stagnant for a while but is over LE level for this pattern
The cypher is a five point harmonic chart pattern, made up of points XABCD. The cypher is easy to spot on a chart because it has a characteristic wave like appearance displaying either rising peaks or falling valleys.
In any cypher, points X, C and D are the critical points. For a bullish cypher, X should be the pattern low and C the pattern high. A bearish cypher makes its high at X and its low at D.
The cypher is a technical wave pattern in which the market is trending but is making sharp reversals along the way.
Will earnings create a new up wave for Amgen?Price has entered the same region its last major up wave started. An earnings surprise could be the catalyst.

Bullish Gartley PatternA clean harmonic trading setup.
Pls wait for furtherconfirmation like candlestick pattern in the blue zone, before executing the trade!


Amgen Announces Positive Topline Phase 2 Results For InvestigatiAMGN: Amgen
2020-10-05 16:30:00
Amgen Announces Positive Topline Phase 2 Results For Investigational KRAS G12C Inhibitor Sotorasib In Advanced Non-Small Cell Lung Cancer

Amgen (AMGN)The company is exploring the efficacy of Otezla as a potential treatment for pulmonary distress associated with COVID-19.

Symmetric Triangle Many Patterns on this one Rising WedgesAMGN had an incomplete breakout from it's cup and handle pattern a few months ago. It was quick to pull back and has struggled ever since. I decided to dissect this chart
I see a Symmetrical triangle as the main pattern right now that may determine what happens to AMGN. I am a pattern trader but we all know that S triangles can go either way. It is a continuation pattern, a period of indecision and consolidation
But whichever way they go, price needs to break the trendline consistently and the trend must be confirmed in that direction. In other words, one candle wick that pops through does not mean the S Triangle is going that way. And even when price clearly breaks through, there is no guarantee the pattern will not fail
Symmetric triangles differ from rising wedges in that a rising wedge has both trendlines sloping up and a triangle does not. A Symmetrical triangle has one line sloping down and one line sloping up
Rising wedges are often bearish and occur during uptrends, and can occur in all sizes. And a stock can break up from a rising wedge. It is not always down, but the break out if not usually a sustainable move up. I have never seen so many stocks in rising wedges since the flu hit the market this year. If a stock breaks up and out of the rising wedge along with a B/O from their C&H pattern, like AMGN did a while back, (so did CRM, and numerous others,) the break out is often weak or does not stick like it should. Very often, a marked downtrend will occur after the incomplete breakout (stock breaks from the cup and handle or whatever pattern it breaks from, but the aftermath is ugly) Best for me to just not trade a stock that is traveling in a rising wedge. It can be a long term pattern as well, very long term. If I post a chart on here, I always try to show the rising wedge that is accompanying the other pattern..because it is a risk. A RW does not mean I can not make money going long. Just gotta be careful
For a downward break out from a rising wedge, you can draw a straight line from the lowest point of the wedge and this is a downward target. Just like anything else, it may not go down that far, but short traders love this pattern because it is easy to calculate the length of the fall. Strong stocks do not do the entire free fall I have noticed. But this year is the first time I have seen so many RWs, so I am still learning. There needs to be 5 touches of the trendlines in both a RW and a S Triangle to validate the pattern. With a bearish rising wedge, there will be a lack of touches on the support trendline. 3 weeks is the minmum duration for a rising wedge to form, otherwise it is a pennant. May be good to compare AMGN's chart with QRVO which has no rising wedges in it' chart this year. News can also break the pattern. Just seems like it is a short lived price move up. Many trade a stock in a RW and you can make a lot of money inside of it. Just beware.
All kinds of patterns in this chart. C&H pattern earlier this year and targets not reached, possibly due to the long term rising wedge in the chart. There are multiple rising wedges in this chart. I put the largest rising wedge on the chart. AMGN has broken the bottom trendline of the large bearish rising wedge
I see a spike of volume at 231ish so may be a key level where buying kicks in but NV has faded.
41% increase in short interest today and price is hovering on the bottom trendline of that S Triangle. Which way will it go? comments welcome (:
Sorry to be so longwinded (long fingered)..lol..not a recommendation


