AXP, BUY, -3.29% LOSSBought NYSE:AXP on 10/19/2023 near market close and closed position on 10/20/2023 at market open. Net -3.29% loss.
AXP trade ideas

AMERICAN EXPRESS BULL / BEAR EARNINGS American Express Earnings
BULL TP 154 SL 149
BEAR TP 145 SL 153
NO Drama Just Trade Execute WIn LOose . get to the next trade !!
Stay Profitable

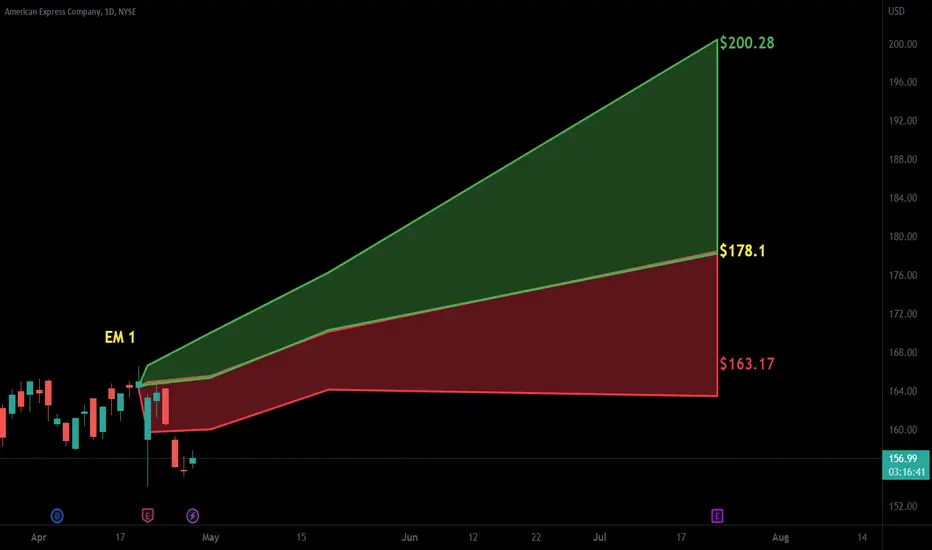
AXP American Express Company Options Ahead of EarningsAnalyzing the options chain and the chart patterns of AXP American Express Company prior to the earnings report this week,
I would consider purchasing the 155usd strike price Calls with
an expiration date of 2024-1-19,
for a premium of approximately $7.05.
If these options prove to be profitable prior to the earnings release, I would sell at least half of them.
Looking forward to read your opinion about it.

AXP ShortRising credit card rates, shrinking savings, possible recession. On the top of that, rising wedge structure broken.

AXP: Confirming Break Below Lead-In Trend at Bearish Crab PCZAmerican Express has broken below the Lead-In trend line and looks to be confirming a lower high below the breakdown zone, all at the PCZ of a Bearish Crab on the Weekly Timeframe.
If we get the desired performance from this we should see AXP go down about 30-60% from the current levels.

#AXP trade plan if stock goes downBIG MONEY likes this plan! This guys use PUT options out-of-money to form safe LONG position. They will not lose money if the market goes in the opposite direction. It's amazing! Let's see.
We do the best research as we can to find new opportunities in the massive amount of information every day to help you make data-driven trading decision.
Please feel free to leave any comments you have and like this idea if you agree with us. Any feedback or comments will be read. We appreciate it all!

AXP - BEARISH SCENARIOAmerican Express experienced a decline in its stock price on Thursday following a rating downgrade by a Wall Street firm. Several analyzers lowered their rating on American Express stock from Outperform to Neutral/high risk. This change comes after maintaining the Outperform rating for over a year. Despite the downgrade, Baird kept its price target for the stock at $185, indicating a minimal gain of 6% based on the previous day's closing price.
The rationale behind the downgrade is partly based on the net interest margin, which represents the difference between the interest income generated and the interest paid by the company to lenders. The expectation is that American Express's net interest margin will be weaker compared to broader estimates for the second quarter. This is primarily attributed to a shift in the funding mix and rising deposit costs.
Risk Disclosure: Trading Foreign Exchange (Forex) and Contracts of Difference (CFD's) carries a high level of risk. By registering and signing up, any client affirms their understanding of their own personal accountability for all transactions performed within their account and recognizes the risks associated with trading on such markets and on such sites. Furthermore, one understands that the company carries zero influence over transactions, markets, and trading signals, therefore, cannot be held liable nor guarantee any profits or losses.

Almost Ready for Next Wave Up1) In an Uptrend - higher highs and higher lows - since early May (along with broader market) but more importantly has done so in the face of downward pressure on banks/financials
2) Retraced 38% of entire move up from May lows. Potentially has a bit further down to 50-61% retracement area before next wave up
3) Longer-term Parabola structure (on weekly chart) sets of for breakout from cup pattern to new highs later this year


American Express ($APX): Elliott Waves Analysis and Sell SetupThe American Express ($AXP) Main Trend is absolutely bullish, therefore we currently consider all descents as simple corrective structures of the trend in play. But why am I saying that? Because when you decide to take a position not following the trend, the risk is high, so logic tells us to use a smaller size, at least initially (...there's always time to increase it!). Having said that, the strategy I want to share with you is very simple: "Try to take a short position on breakout" , with stop loss above the previous swing (don't look at the levels on the chart, they are only indicative at the moment). Of course, a second option (yellow arrow) is also possible, but to do this you would need to be a little more expert. The potential target areas are the first around 119.50 and the second around 106.50 (my favorite).
Looking at the chart above (daily time frame) we can see how the potential short trade also has a good Risk/Reward ratio, and this makes this trade interesting.
I also take the opportunity to thank every Trader who supported me in the last setups on Stocks Market:
$AMAZON BULLISH SETUP
(Click and Play on Chart below)
$TESLA BEARISH SETUP
(Click and Play on Chart below)
Trade with care! 👍 ...and if you think that my analysis is useful, please..."Like, Share and Comment" ...thank you! 💖
Cheers!
N.B.: Support my idea for next updates below 🚀

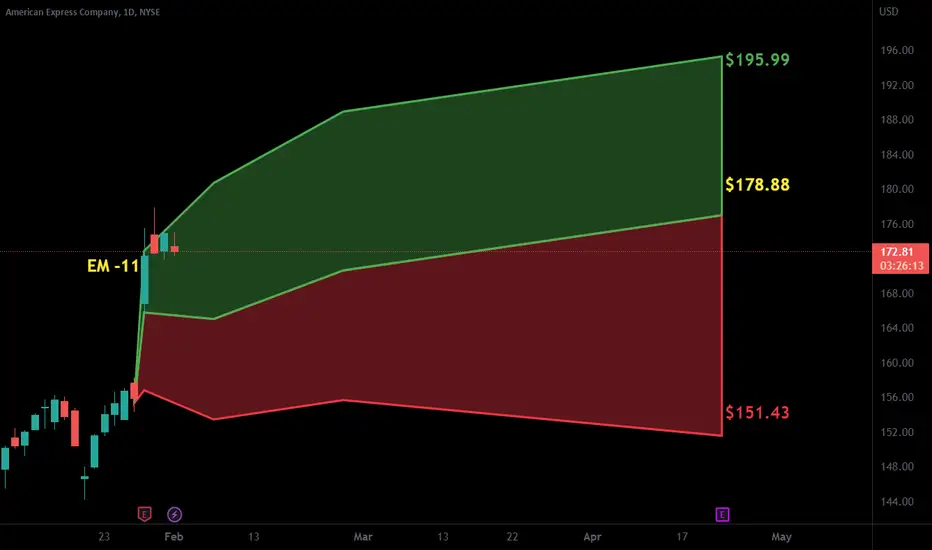
$AXP with a bullish outlook following its earnings #StocksThe PEAD projected a bullish outlook for NYSE:AXP after a negative over reaction following its earnings release placing the stock in drift C .
AXP: Buy ideaAs you see on the chart we have the breakout of vwap and also the breakout of the resistance line so it's mean that we will have a big probability to have an uptrend.Thanks!

AMEX new update: HOLDAmex reported lower-than-expected 1Q earnings, but reading the report, it expects full-year earnings to grow between 10 and 15%. Historically the stock has moved above the indicated moving averages, only during the covid and this increase in interest rates has pushed to lower levels. My forecasts for the year 2023 are a trading range between 128 and 187 dollars, the advice is to wait and gradually increase on further weaknesses. I don't really like entering Fibonacci levels, as the market follows the levels of different ups and downs, ultimately it is impossible to evaluate with certainty. The crossing of the two moving averages is confirming the period of weakness.

Earnings in AMEarnings tomorrow before market opens.
Price is below the .236 and above the .382 of the trend up.
ABC/D pattern that could fail if there is an earnings miss. Analysts appear mixed on earnings results.
Possible stop under C. Target is D.
No recommendation.

$AXP - Long Trade Idea$AXP
This ticker popped up on my screener set based on strength.
As long price is above the swing high point created by the first low in a double bottom, target is $211.
No trade at the moment as I wait for potential pullback to 165/166 zone.
Noticeable pattern: double bottom

Long American ExpressWhy buy American express?
1 - because I said so
2 - It's an American Bank who respects Julius Caesar more then Canadian banks
3 - It's on a clear uptrend
4 - ask Chat GPT to dumb down for you the theory of reflexivity by George no Soros
5 - I said so
6 - the price is holding above the 23.6% Fibonacci (God's math) retracement level
7 - because I said so
8 - it's undervalued from a Fundamentals point of vue and they invest in blockchain companies (most banks don't bother)
9 - They paid for my baller 1st class Lufthansa ticket to Paris with stop in Munich, Hostel Costes with supermodels Sep 2-5 and Hotel du Palais in Biarritz that my grandson once built for his love Princess Eugene

American Express to All-Time Highs?AXP is showing pretty clear signs of all time highs coming by June-ish.

AXP WEEKLY (AMERICAN EXPRESS COMPANY)RULES:
-If price break Point 2, 4, 6, or 8 cancel the setup
-Price needs to break Point 1, 3, 5, or 7 to confirm the setup
When price reach the 100FE(BLUE BOX) it normally does a pullback/retest or reversal
The market can Truncate(fall short)

Neutral on AXP - Watching the levelsThe P&L is for the reference of entry, potential upside and cut loss point. The dates on it have no relevance.

$AXP with a Bullish outlook following its earnings #Stocks The PEAD projected a Bullish outlook for $AXP after a Positive Under reaction following its earnings release placing the stock in drift A with an expected accuracy of 66.67%.

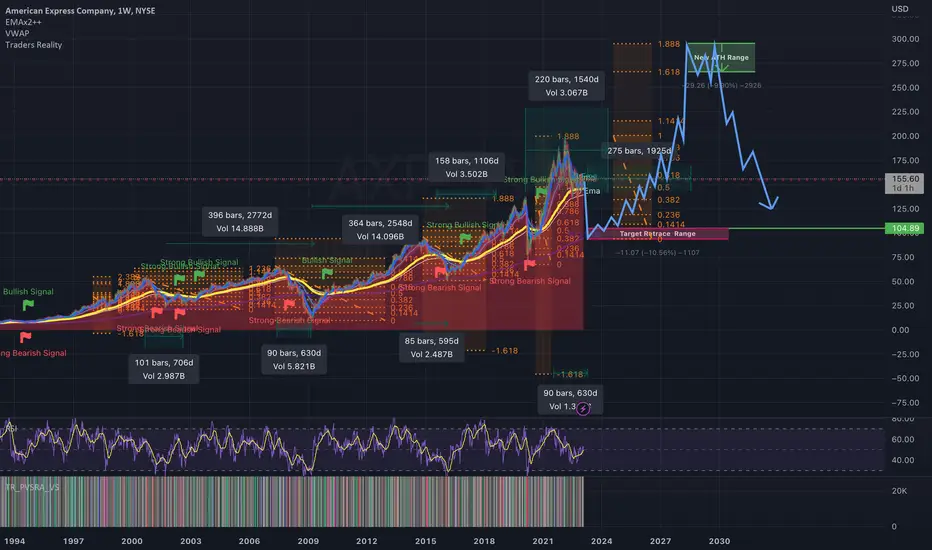
AXP historical cycles and future price projectionsThe peaks and valleys of the AXP chart are extremely consistent over time. Every 7 years we see a cycle where we achieve a new ATH and retrace sharply before repeating the cycle. The time ranges in which the elements of this pattern play out are shown. The time it typically takes from peak to low and the time from low to peak. Based on these consistent time and price patterns, this shows my prediction for upcoming cycle low and the following cycle peak. The 7 year cycle is known as the Shamita. It plays a fundamental part in the ebbs and flows of the global financial markets.
Amex (AXP) bullish scenario:The technical figure Triangle can be found in the daily chart in the US company American Express Company (AXP). American Express is an American multinational financial services corporation specialized in payment cards. It is one of the most valuable companies in the world and one of the 30 components of the Dow Jones Industrial Average. The Triangle broke through the resistance line on 25/01/2023. If the price holds above this level, you can have a possible bullish price movement with a forecast for the next 18 days towards 165.00 USD. Your stop-loss order, according to experts, should be placed at 144.26 USD if you decide to enter this position.
American Express Company AXP is set to report its fourth-quarter 2022 results on Jan 27, before the opening bell.
In the last reported quarter, the diversified financial services company’s adjusted earnings per share of $2.47, primarily due to continued business momentum and a solid revenue stream. American Express also benefited from better volumes and higher Card Member spending, due to a significant increase in Travel and Entertainment spending. However, the positives were partially offset by higher operating costs.
Risk Disclosure: Trading Foreign Exchange (Forex) and Contracts of Difference (CFD's) carries a high level of risk. By registering and signing up, any client affirms their understanding of their own personal accountability for all transactions performed within their account and recognizes the risks associated with trading on such markets and on such sites. Furthermore, one understands that the company carries zero influence over transactions, markets, and trading signals, therefore, cannot be held liable nor guarantee any profits or losses.
