$BE Target 34.78 for 28.58% $BE Target 34.78 for 28.58%
Or next add level is at 19.70
I didn't add here, just charting and organizing my portfolio
—
On the far right of the chart is my Average (Grey) Current Target (Green), and Next Level to add (Red) Percentage to target is from my average.
I start every position with 1% of my account and build from there as needed and as possible.
I am not your financial advisor. Watch my setups first before you jump in… My trade set ups work very well and they are for my personal reference and if you decide to trade them you do so at your own risk. I will gladly answer questions to the best of my knowledge but ultimately the risk is on you. I will update targets as needed.
GL and happy trading.
BE trade ideas

$BE - swing trade$BE has an entry zone of $27.29 - $28.70
I got in yesterday and started to build my position.
In case you are wrong, using 20/40/40 method for taking a full position has proven valuable to me.
My first entry is for 20% of a whole position then I average in ONLY when the stock is going up or on dips if the up trend is strong and formed.
I used volume shelves to determine levels for buying. I do not buy if a day candle wicks into the range, the closing price must be above the target entry zone.
I have good reason for holding the entry zone on close and have been burned when entering intra-day on wicks into the zone (look at JMIA - a close above $68 was my entry, never made and I ended up in a loser).
Earnings come within a couple of weeks, so mind your position with earnings beat or miss in mind and have the appropriate position managed around earnings.
Target 1 is around $32.30, where i expect to run into consolidation and resistance, target 2 is $40.
So you can see the swing trade will result in around 12.5% - 39.4%.

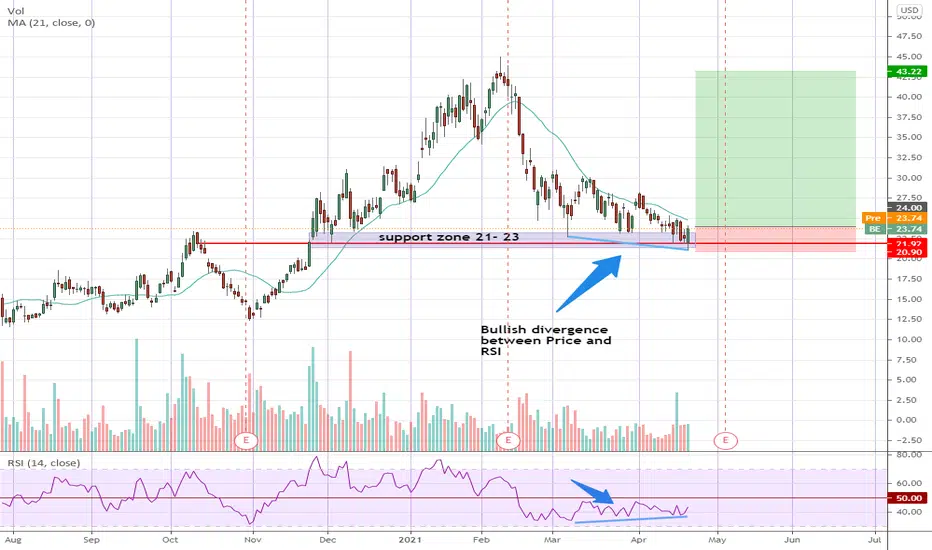
BE - Getting near to a pop soon?BE has been in a frustrating slow grind generally downwards for the past 6 weeks while a Bullish Divergence between Price and RSI has been slowly building.
It tested a possible strong support at 21.90 yesterday and quickly rebounded to close a rather strong candle.
The odds are getting better that the worst could be over. However we might not see real momentum yet until the RSI rises above 50.
Disclaimer: This is just my own analysis and opinion for discussion and is not a trade advice. Kindly do your own due diligence and trade according to your own risk tolerance. Thank you. Feel free to give me your thoughts ! :)
Bloom Energy Update - Important Levels and TrendsHonestly, I don't know exactly what will happen with Bloom in the short term.
Worst case scenario, it taps 18, then bounces hard, which will confirm a full retracement of the over-extension.
The simple trend line I have should bring us to 30 soon.
The 200 Daily EMA has been reclaimed, as of today. It must hold til the end of the week.
I predict Bloom will hit $75, minimum, by the end of 2021.


$BE Target 34.78 for 28.58% - Or next add level at 19.70$BE Target 34.78 for 28.58%
Or next add level at 19.70
I am not your financial advisor. Watch my setups first before you jump in… My trade set ups work very well and they are for my personal reference and if you decide to trade them you do so at your own risk. I will gladly answer questions to the best of my knowledge but ultimately the risk is on you. I will update targets as needed.
GL and happy trading.

BE - Watching the handle completeLooks like we're a day or so away from breaking out of the downward channel formed as part of the cup's handle. There's some resistance around 30, and then we're on our way to breaking out past the cup's top at around $35.
Upside of a cup and handle completing is ~$35 from the point where it breaks the downward channel (so ~$28 + $35). Of course this will happen with some retracing along the way.
Good luck!

How I Calulate the Fibonacci retracement and extensionsThis uses BE as an example of what I do when I calculate the Fibonacci retracements and extensions, which are used to measure corrections and future price targets.
Retracements
I start by finding the location of a correction. I define a correction as anything the closes below the 20 period moving average. The lowest point in that correction becomes the first point of my Fibonacci retracement. Then you need to find the high prior to the next correction - that will become your second point of the Fibonacci retracement. What you have after that will be the Fibonacci scale. Corrections are expected to occur between the values of .5 and .768, with many ending at .618. This is the predicted bottom of the correction.
Fib Extensions
Adding to this we can make predictions as to the next Price Target (or correction point). To so this just add a Fib Extension to your chart, the first two point reuse the two points determined with your Retracement, the third point is the actual low point of the retracement correction.
This will add a positive Fibonacci scale, which you can use to make future Price Target predictions. Typically is your retracement was between .5 and .768, you can expect the PT to be around the 1.618 on the scale.
From my diagram you can see that I have one completed correction/surge cycle which matches nicely with the expectations. There is also the next PT, which is yet to be completed, which lands us at the $77 range.
Hopefully this is helpful, as I think it's a pretty simple yet powerful technical analysis tool!

Long | BE | Swing TradeNYSE:BE
Possible Scenario: LONG
Evidence: Price Action,
TP1 ~40$
*Buy Area: 30-32
This is my idea and could be wrong 100%

Fiboncci retracement and extensions - good upside to $77After a healthly correction, I went back over my charts and review the retracement and extension projections for BE. Looks good up to $77
Good luck!

$BE 4hr Potential Bullish Reversal on OscillatorsNegative momentum slowing down on MACD.
Price touching previous area of congestion established over the past 4 months.
Double bottom on RSI with upside developing.
Do your own DD, not financial advice.

Cup forming over 2 years with the handle now starting to formLooking at BE over the long term and I realized that a cup had been forming over the past couple of years and it looks like the recent pullback might be the handle starting to form.
This is very interesting since the cup itself has a depth of ~$35. Rule of thumb says that the after the reversal out of the downtrend of the handle - the breakout would climb to the depth of the cup. So there's a $35 upside potential.
A strategy would be to set a stop loss buy just above the top support/resistance line ~42.50. That is where a breakout should occur.
As always do your own research and let me know what you think.

💡$BE ♻️$2 trillion total addressable market💰+48%🏌️♂️NYSE:BE 📚Bloom Energy provides clean, cost-effective, AlwaysON electricity for organizations and communities. The Bloom Energy Server is an advanced distributed energy generation platform that operates 24x7 with the highest efficiency of any power solution available in the world today.In layman's terms, it provides buildings with power during grid outages and shortages. Preliminary outlooks for 2021 show 25% YoY revenue growth. Costs associated with fuel cell production have reduced by 60% in 2015, which will benefit Bloom in the long term - they predict costs to fall 10% to 15% annually. Bloom is operating in a $2 trillion total addressable market. Bloom claims that a solar PV facility, to provide 1MW of electricity, requires 12,500% more space than Bloom Energy's terminal. Blooms terminals produce 50% less CO2 and at a lower cost than grid energy. Fuel cell companies such as Bloom Energy have rallied significantly since Biden’s inauguration after his $2 trillion pledge to clean energy. Bloom Energy stock is down 25% over the past few trading days, possibly due to profit taken after the massive rcerecentnet rally, overall market weakness and the announcement that Norway is building its first large-scale fuel cell production facility.
📈Price has recently gapped up above a strong resistance zone it had previously fallen below. Price has recently bounced from the support line of its bullish price channel it has been trading in since November - this occurred with a hammer candlestick which is a reversal candlestick. Price has also completed a 0.5 Fib retracement. Finally, there is some hidden bullish divergence, with the RSI making lower lows, but price making higher lows. If price continues its bullish trend to $47, this could see 48% upside.
🔎This is not financial advice. Always do your own research and due diligence. Always wait for directional confirmation before entering a trade.


a couple outcomes as always friends :)a couple outcomes here, like with most charts! :) we can expect a dip entry around 27 if top resistance keeps it from breakout out to new highs, but... if it actually breaks out with big buying volume and we 45-50! goodluck either way trades, lets get that bag next week!

BEInvestment position in accumulation and retention from 1 year. The energy sector is one of the drivers of the coming decade. The paper went public in August 2018 and underwent the usual correction for such cases. After that, having reached a minimum in October 2019, the price of $ 2.45 began to rise, and since then has grown by an impressive 1350% and reached an all-time high of $ 38. The growth of the paper was accompanied by the formation of many patterns of the continuation of the growing, which gives confidence that the paper tends to follow the patterns being formed, and not break them. Today, the security is corrected to $ 37, the resistance level is tested, after which the security is expected to move as indicated by the lilac arrow (see the upper yellow circle) to the level of $ 72, an increase of 93%. Trading without stops - it is not needed here. There is a likelihood of the security going into a deep retest of the resistance level with the formation of the C&H pattern, but this does not cancel the indicated growth targets. There is a well-traded option board with IV = 100%, which makes it possible to increase income by using option instruments - selling puts, credit spreads on puts. Buying calls in this case is not profitable due to the high IV.


BE, RSI Indicator left the overbought zone on January 07, 2021This is a signal that BE's price could be shifting from an uptrend to a downtrend. Traders may consider selling the stock or exploring put options. Tickeron's A.I.dvisor looked back and found 21 similar cases where BE's RSI Indicator left the overbought zone, and in 19 of them led to a successful outcome. Odds of Success: 90%. Current price $35.08 is above $26.33 the highest resistance line found by Tickeron A.I. Throughout the month of 12/04/20 - 01/07/21, the price experienced a +20% Uptrend. During the week of 12/30/20 - 01/07/21, the stock enjoyed a +18% Uptrend growth.
Bearish Trend Analysis
The RSI Indicator demonstrated that the stock has entered the overbought zone. This may point to a price pull-back soon.
The Stochastic Indicator may be shifting from an upward trend to a downward trend. Tickeron A.I. detected that in 23 of 26 cases where BE's Stochastic Oscillator exited the overbought zone, the price fell further within the following month. The odds of a continued downward trend are 88%.
Following a 3-day decline, the stock is projected to fall further. Considering past instances where BE declined for three days, the price rose further, Tickeron A.I. shows that in 50 of 62 cases within the following month. The odds of a continued downward trend are 83%.
BE broke above its upper Bollinger Band on January 07, 2021. This could be a sign that the stock is set to drop as the stock moves back below the upper band and toward the middle band. You may want to consider selling the stock or exploring put options.

$BE Ascending triangle breakout!Just follow the common-sense rules. Safe to add to the position if we see an increase in volume. The move should last for some time in that case

BE rally. Cramer approveHad a big Double bottom break out today with the alt energy sector but pulled back with the riot BS. Got stamped with FCEL and PLUG on Cramer. resistance is at 31.15 but if aftermarket gains hold it should blow pass it with the first fib target(Green line) at 36.50.
RSI has room and MFI is great
