THE WEEK AHEAD: BIDU EARNINGS; GDXJ, EEM, VIX/VXX/UVXYEARNINGS
BIDU (97/55) announces earnings on Monday after market close, so look to put on a play in the waning hours of the New York session ... .
Pictured here is a September 80/120 short strangle paying 1.65 as of Friday close with delta/theta metrics of 1.57/8.07. You can naturally go defined risk, but you'll have to go in a smidge tighter with the shorts to collect one-third the width of the wings and being surgical with your strikes will be tough with 5-wides in that expiry. The September 20th 80/85/110/115 is paying 1.62 with delta/theta metrics of .26/3.20.
EXCHANGE-TRADED FUNDS
Precious metals keep on grinding in a high implied volatility state for yet another week, with the ideal rank/implied metrics remaining in GDXJ and nearly ideal ones in GDX:
GLD (80/16)
GDXJ (77/38)
SLV (77/25)
TLT (76/17)
GDX (72/33)
BROAD MARKET
EFA (53/17)
EEM (52/22)
IWM (36/22)
SPY (35/18)
QQQ (27/22)
Since I don't have anything on in EEM, I may consider putting on something longer-dated there. Using the delta neutral at-the-money short straddle test and looking for a setup that pays greater than 10% of the value of the underlying, it looks like I would have to go out to January where the 40 short straddle is paying 4.54 versus 39.54 the shares were trading at as of Friday close.
The January 17th 40 short straddle pays 4.54 with break evens at 35.46/44.54 and has delta/theta metrics of 1.96/1.13 and a 25 max of 1.13; the 16 delta 34/44 short strangle pays 1.05 (.52 at 50 max) with break evens of 32.05/45.05 and delta/theta metrics of -.15/.86. I'm fine with either, but there's something to be said for having room to adjust without going inverted with the short strangle.
VIX/VIX DERIVATIVES
VIX finished Friday at 18.47 with the /VX term structure still in backwardation from September to December, with the August contract settling next week.
I will continue to look to add at-the-money bearish assumption setups (short call verticals or long put verticals) in VIX in the front month (September) should we get additional pops to >20 and/or the same type of setup in UVXY and VXX using VIX levels as a guide. As of Friday close, the VIX September 18th 18/21 short call vertical was paying 1.10 at the mid with a break even of 19.10 versus 18.47 spot, but will probably wait for another pop to >20 to put on a similar setup.*
* -- Short call verticals: short in the money, long out of the money, paying one-third the width of the spread. Long put verticals: short out of the money, long in the money, paying less than one-third the width in debit. Short call verticals with the same strikes as a long put vertical have the same risk, so it's a matter of taste and/or the practicalities of having a bunch of different plays on in the same expiry as to which you use. For example, you can layer on same strike long put verticals over short call verticals without inadvertently "stepping on" the short call verticals you have on. As compared to VIX options -- which settle to cash, with UVXY and VXX, there's naturally some assignment risk, so I lean toward short call verticals in those particular instruments, since I'd rather be short shares if assigned.
BIDU/N trade ideas

BIDU CALLS for 07-30-19 earningsBIDU CALLS for 07-30-19 earnings
Bought calls:
$114 strike, 08-02-19 Expiration, cost 1.13
$117 strike, 08-02-19 Expiration, cost 0.36


New uptrend from here?I might be over-interpreting this chart, but MACD since to back me.
I´m long until this gets back to 127 or so...then we´ll see

Gap Filling and all thatI don't believe in coincidences. Do you? There is one more gap to fill (see the lower green horizontal line). Are you feeling lucky? Well, are you?

Is Baidu a Buy?China's leading search engine is trading at levels we haven't seen since the summer of 2013.
It's fair to say that Baidu is this cheap for a reason, and its latest financial results are problematic. However, if analysts are right about its fundamentals starting to show signs of life in a few quarters, it's also easy to see the stock beating the market at this point. Baidu is not looking pretty right now, but it does look like an opportunistic buy at current levels.
Read more:
www.fool.com

Baidu (BIDU) like china google search engine = From bottom>MoonBaidu (BIDU) like china google search engine = From bottom >>> Moon
Good price for buy china stock Baidu.
S&P tested new Moon targets
Price Baidu good for long term.
Two targets:
Short-term = $149.00 - $174.00
Long-term = $234.00 - $244.00


BIDU - DECLINING TREND SET UP ?Applying Wyckoffian Logic to chart of BIDU. Look for failure to reach median line on Andrew's Pitchfork for possible confirmation of furture decline in price?

BIDU BAIDU Buy at support signalWhat can I say - I like to buy at support and sell at resistance...also to buy breakouts.
The case for BIDU - a sharp fall, 50% retracement from recent highs and a bounce off the low confirms a bottom.
A low risk entry with a stop below the low offers a good risk reward ratio.
Using CBL - count back line analysis, we can draw a line (green) from the height of the 3rd lowest daily candle and buy when price moves above this line.

Far-fetched idea for BIDU in the coming weeksBIDU bounces off bottom of short-term channel to test 50DMA then drop towards earnings around 8/2 if that fails.

BIDU: Obsolete and NotoriousBIDU has dived sharply because of its bad Q1 report which sparked several managers to quit.
This notorious giant is far behind another two giant, Alibaba and Tencent.
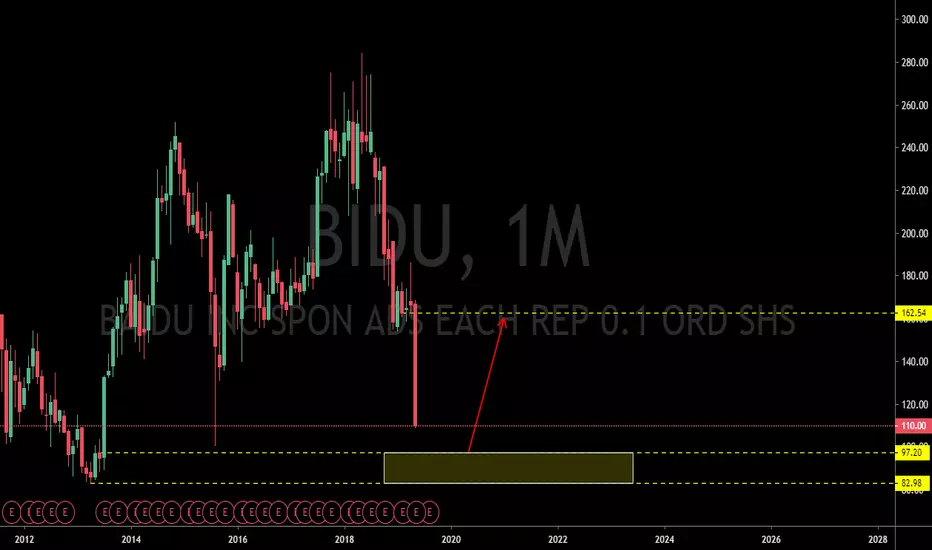
Although its future looks dim, a good demand zone may support the price from descending further.
Buy at 83-97
SL: below 83
TP: 162
BIDU must have a revolution as soon as possible, otherwise, more disasters are waiting for it.
BIDU BAIDU entering in to the Long Zone LBLS analysis" BAIDU Analysis in 4H timeframe:based on trading view script LongBuyLongSellIndicator (LBLS indicator in short).
Analysis as : Long:
To understand completely about the LBLS indicator ,the script link is given below at the bottom.Simply click the LBLS image below that will take you the latest revision.
I was going through all the time frame chart of BAIDU to identify the right entry.Here is my view and the fact about this BAIDU .
Currently I think BAIDU will have a minor retracement here to retest the level before taking off to our predicted move.
There is no myth to use several indicator to be good trader ,Use simple and effective Indicator of your choice which can help getting the right spot to trade and invest.Whatever it may let it be very simple to use.
with the help of LBLS indicator , i check three basic yet effective rules for Entry.
Long:
Make sure the candle color transitioned from Black to Blue / Red to Green .
The Strength-meters Here is the example of Strengthmeters with Open Pine code ,it is nothing but group of top performing indicators,Used 7 indicators to predict this.Minimum 4 or above showing in charts in the current candle or within two candles in Green Color (Red for Short).
Background Color changing from Red to Green is the added advantage.
Short:
Opposite of the Long Logic's.
In General in chart we have to see a pattern the price is moving HH for Long or LL for short.
Please study the price action techniques to understand the HHHL,LLLH for predicting the market.
This is key to success in market.
Remember :
The LBLS indicator analysis is one of the easiest methods to recognize the price moves and usually quite reliable.
In General no trade occurs the way we want it to touch 100% right. if we can predict entry 6 out of 10 correctly ,we will win the Game whatever be the indicator used.
If you are winning an average of 60% of your trades with strict money management, you are going to win the Trading Game for Sure! Take out the emotion ,Practice disciplined trades.
with the rules of the indicator and price action ,This looks to be a good short at this point of time. Share your views in comments section.
Remember for right entry point
Remember for Stop Loss
Remember for partial take profit
Remember for closing the remaining profit
The Main Script behind the Analysis:
I would be happy if you give me a like ,that way you get updates without miss as I post :)
Please don't forget to like if you appreciate this :) ;You can follow me to get updates.
"

BIDU: Trade talks speculations playGood chances we may hit 117.xx today or tomorrow the least. We can go higher if conditions permit.
Prices marked

Short term Bullish to $176BIDU Short term bullish to around $176 represents a possible short term trading opportunity. Looks to bounce off the trendline. Note that earnings report on May 17.

BIDU - looking for a bounce next weekNASDAQ:BIDU appears to be oversold and there is a possibility of one leg up in anticipation of Trump-Xi Meeting. Risky trade. Sell on a bounce. Keep a very tight stop loss

Baidu will be a fantastic reversal trade if Trump makes peace.The G20 summit really can not come quick enough as the Nasdaq and DOW hang on by their fingertips to the ATH level, technology stocks in particular need a positive outcome from the Trump Xi meeting whether it be sincere or not. Baidu has fallen victim like many Chinese stocks to investors not willing to risk their cash in battleground stocks used as a pawns in a very complexe game of trade. If there is a agreement or trade peace treaty BAIDU is a must have stock to benefit from a huge reversal, keep it close to mind as the weekend approaches, despite its weak chart, technicals will not matter if fundamental change.


As BIDU Goes, So Goes the Chinese EconomyBIDU is a huge bellwether of China. It has collapsed to a new low, indicating that the economy of China may be worse off than the official reports claim. This new low created a temporary bounce due to a severely steep selling trendline pattern.

BIDU 2019.6.11Strong Pressure from pass at 117
Break 111 bearish trend
long at 113 stop loss 111, TP 125

