BX : First Attempt at Silent StockBlackstone has now decided to invest in Europe.
The stock is technically above the 50 and 200 period moving averages.
After leveling the trend line, an increase in volume was also observed.
In that case, holding a short-medium term or opening a long position with a reasonable risk/reward ratio in a small position size will not hurt us.
I have kept the stop-loss a little tighter now because even if the stop level comes in a sudden drop, it can be tried again. If that happens, I will share it as a new idea.
Risk/Reward Ratio : 3.00
Stop-Loss : 132.53
Take-Profit : 141.73
BX trade ideas

Black Stone Stock Chart Fibonacci Analysis 050925Trading Idea
1) Find a FIBO slingshot
2) Check FIBO 61.80% level
3) Entry Point > 129/61.80%
Chart time frame: D
A) 15 min(1W-3M)
B) 1 hr(3M-6M)
C) 4 hr(6M-1year)
D) 1 day(1-3years)
Stock progress: A
A) Keep rising over 61.80% resistance
B) 61.80% resistance
C) 61.80% support
D) Hit the bottom
E) Hit the top
Stocks rise as they rise from support and fall from resistance. Our goal is to find a low support point and enter. It can be referred to as buying at the pullback point. The pullback point can be found with a Fibonacci extension of 61.80%. This is a step to find entry level. 1) Find a triangle (Fibonacci Speed Fan Line) that connects the high (resistance) and low (support) points of the stock in progress, where it is continuously expressed as a Slingshot, 2) and create a Fibonacci extension level for the first rising wave from the start point of slingshot pattern.
When the current price goes over 61.80% level , that can be a good entry point, especially if the SMA 100 and 200 curves are gathered together at 61.80%, it is a very good entry point.
As a great help, tradingview provides these Fibonacci speed fan lines and extension levels with ease. So if you use the Fibonacci fan line, the extension level, and the SMA 100/200 curve well, you can find an entry point for the stock market. At least you have to enter at this low point to avoid trading failure, and if you are skilled at entering this low point, with fibonacci6180 technique, your reading skill to chart will be greatly improved.
If you want to do day trading, please set the time frame to 5 minutes or 15 minutes, and you will see many of the low point of rising stocks.
If want to prefer long term range trading, you can set the time frame to 1 hr or 1 day.

What is a war chest and lessons we can learn from Blackstone...In case you haven't heard, NYSE:BX is hogging over $100 billion of dry powder that is ready for deployment at the snap of a finger. Now, just because we cant get our hands on hundreds of billions of dollars doesn't mean that we shouldn't have a war chest of our own.
Why a war chest is a must have
Firstly, having dry powder ready for the next trading day could be the determining factor of a make or break trade. Specifically think back to when the current market downturn started. If I had to guess, many of you reading were far too exposed to the market and got scared from the "red wave" that shocked the market heatmaps. I would also like to bet that many of you sold positions for a loss to stop the bleeding and are now looking for a better entry. However, consider what would have happened if you had spare cash on your side to keep your positions alive.
Here is an example of over exposure.
And here's an example of keeping about a 20% war chest by your side...
I understand that it seems like a small amount of money, but trading is a game of pennies and a winning position of pennies is much better than a losing position of $140. This is the same tactic that firms like Blackstone use to protect large positions from poisonous events such as this recent downturn in the market. So in order to make money like a bank, we need to learn to think like a bank...

BX, double bottomBlackstone has recorded a double bottom at $119 and a fake bullish crossover lately.
Now it is approaching a new bullish crossover and is working to create a new relative high that would create a good positive price action.

BX - Liking it Under 120I've been nibbling on BX as it is continuing to maintain in a possible upward channel. Looking for an eventual move above 200 once this minor cleansing shakes out. They can do Real Estate much better than I.

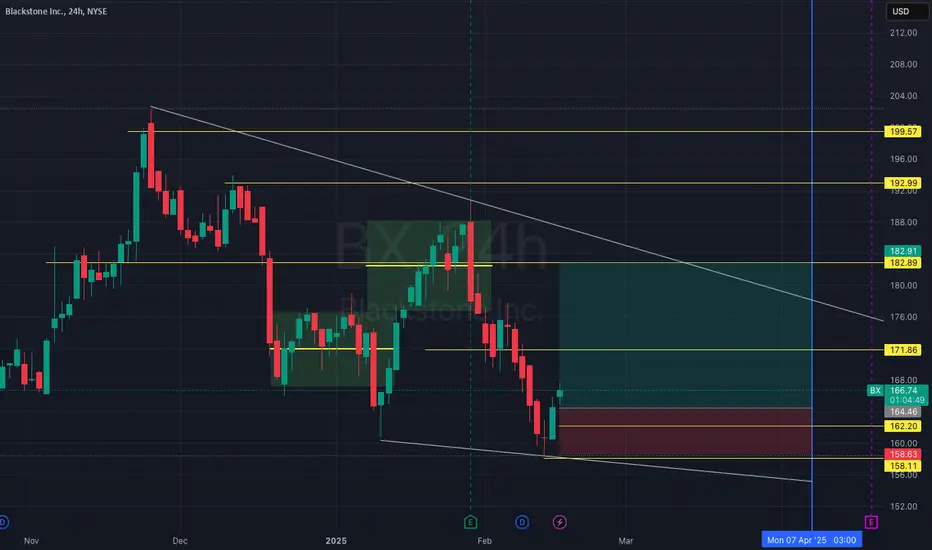
BX BounceLooks like BX just found support 158. There's an upper trend line that seems to be drawing price back up to. 180 price target looks reasonable to reach. GL!
Speculative Madness: The Market’s Bubble Stocks Some stocks areSpeculative Madness: The Market’s Bubble Stocks
Some stocks aren't just overvalued—they're in full speculative bubble mode. Fundamentals? Irrelevant. When euphoria takes over, rationality disappears.
Here’s my list of bubble stocks that scream unsustainable pricing:
SBUX, T, PLTR, BMY, PYPL, NFLX, GS, ISRG, ARM, C, SHOP, BSX, SPOT, UBS, IBKR, RELX, CEG, CRWD, MSTR, MMM, DASH, COF...
And let’s not forget the obvious: TSLA, META, AMZN, AVGO, GOOGL, JPM, MA, V, WMT.
Honestly, the entire banking sector, brokers, and tech are in bubble territory.
What the hell is going on with this market? Why are algos just buying, buying, buying, squeezing all the shorts?! Unbelievable.
The dump will be insannnnnnnne!!! 🚨
$BX LONGThis is a weekly for BX. In the Fibonacci framework I use to determine discount vs premium, it just hit the 71% retracement level indicating a good discount in the uptrend. Also of note is the 2 bar bullish engulfing reversal formation, indicated by the green oval. I hold this as a long-term investment in my IRA and would add now based on this price action.

Blackstone Inc. Targets $256: Strong Momentum Backed by Volume Blackstone Inc. (BX) highlights a strong bullish structure, with the price targeting the key resistance zone at $256.10, as indicated by the arrow projection. The significant volume accumulation in the range of $90-$150, shown in the volume profile on the right, suggests robust buying interest and a strong foundation for the upward trend. The price is maintaining its trajectory well above the previous consolidation zones, reflecting buyer strength and momentum. Additionally, the lower momentum oscillator shows a positive divergence, reinforcing the possibility of continued price appreciation. With the trend supported by historical levels and strong volume, the stock appears well-positioned to test and potentially break through the $256 resistance.

How I look for entryKeep in mind that all of what you see is not what I draw up when looking for an entry. With a little practice you can just see the lines without the drawings. All text, colors, drawings are to explain what I see.
Keep your charts clean. Blk & Wht, using as little as possible to see the chart clearly.
Using BX, 15m, today as an example. Once you see it in the algo it can not be unseen. Support and resistance is the same on any timeline on any chart.

Long entry $BXFriday on the rebound I got an alert that NYSE:BX had reached a discount level, based on my Fibonacci Retracement methodology. I waited until later in the session when it became likely that it would have a strong close/candle and entered, adding to my holdings in my IRA. This is a long term investment and I considered it a great place to add the premier alternative asset manager at a great price. If you like these ideas look for me on MrJosephTrades on X (formerly Twitter). Great trading, everyone...

BX Blackstone Options Ahead of EarningsIf you haven`t bought BX before the previous earnings:
Now analyzing the options chain and the chart patterns of BX Blackstone prior to the earnings report this week,
I would consider purchasing the 160usd strike price Calls with
an expiration date of 2025-6-20,
for a premium of approximately $13.90.
If these options prove to be profitable prior to the earnings release, I would sell at least half of them.

Lower OpeningWithin an short term overbought market it becomes clearer that there will be a downward correction. The short candle body of the past 4 hours could not stop the dwindling corrective bias. The new 4h-periode has opened lower.

$BX Breaking out BX looks to be breaking out from a trendline.
RSI breaking over 60, rising 55D SMA.
Stop Loss: 131.82
Target: 160.91
Note: This analysis is strictly for educational purposes only and is not a buy/sell recommendation.

BX Blackstone Options Ahead of EarningsAnalyzing the options chain and the chart patterns of BX Blackstone prior to the earnings report this week,
I would consider purchasing the 140usd strike price Calls with
an expiration date of 2024-10-18,
for a premium of approximately $6.70.
If these options prove to be profitable prior to the earnings release, I would sell at least half of them.

Median Lines and Finding the Right Path When it comes to learning about markets and trading, finding the right path and committing to it is the hardest part. The right path has little to do with any technical analysis method. It has to do with structuring our mental framework so that we fundamentally change how we experience markets, trading, and loss.
In the video, I show some Median Line and Action/Reaction work but this work is useless by itself. No tool is good or bad, they are just tools we use to comprehend markets. The problem arises when the tools start using us and we think there is some kind of magic to them.
The essence of our strategy should be to structure our methods and mindset towards functionality. The journey we should commit to is one marked by fostering accountability and responsibility in all our actions. The swing trade Idea I show, takes method and structures it into function.
Shane

Time to comeback on BlackstoneCrossing up several moving averages, RSI moving up, Relative Volume up, all after a double bottom. Looking good.

Blackstone CALLThe price settled on the demand zone appears to confirm the trend reversal with current jump in price. Expecting the price to test $125, and if successful, to test $131

Blackstone BX 3d Chart, Q1 2024Looking at Blackstone - recovered from it's drop in 2023 and showing strength going into the 3d pivot.
This reminds me of the SPX chart before it ran to ath. With earnings behind it, if can go through 132-135 range and hold it, that it goes to ath. Otherwise, look for the 118-120 range for some consolidation.

Blackstone Could Be BouncingPrivate-equity firm Blackstone pulled back in early 2024 after rallying in November and December. Now it could be bouncing.
The first pattern on today’s chart is the price zone around $116 where BX peaked in mid-September and early December. It marked the approximate low last week. Has old resistance has become new support?
The 50-day simple moving average (SMA) is in the same area. That represents potential confluence and confirmation of a bullish intermediate-term trend.
Next, you have the weekly close of $119.34 on January 12. The stock reclaimed that level on Monday and has remained there since.
Stochastics are rebounding from an oversold level, as well.
Additionally, BX’s fundamentals may interest traders after earnings beat estimates and inflows increased.
TradeStation has, for decades, advanced the trading industry, providing access to stocks, options and futures. See our Overview for more.
Important Information
Past performance, whether actual or indicated by historical tests of strategies, is no guarantee of future performance or success. There is a possibility that you may sustain a loss equal to or greater than your entire investment regardless of which asset class you trade (equities, options, futures or cryptocurrencies); therefore, you should not invest or risk money that you cannot afford to lose. Online trading is not suitable for all investors. View the document titled Characteristics and Risks of Standardized Options at www.TradeStation.com . Before trading any asset class, customers must read the relevant risk disclosure statements on www.TradeStation.com . System access and trade placement and execution may be delayed or fail due to market volatility and volume, quote delays, system and software errors, Internet traffic, outages and other factors.
Securities and futures trading is offered to self-directed customers by TradeStation Securities, Inc., a broker-dealer registered with the Securities and Exchange Commission (“SEC”) and a futures commission merchant licensed with the Commodity Futures Trading Commission (“CFTC”). TradeStation Securities is a member of the Financial Industry Regulatory Authority, the National Futures Association (“NFA”), and a number of exchanges. TradeStation Crypto, Inc. offers to self-directed investors and traders cryptocurrency brokerage services under federal and state money services business/money-transmitter and similar registrations and licenses.
TradeStation Securities, Inc., TradeStation Crypto, Inc., and TradeStation Technologies, Inc. are each wholly owned subsidiaries of TradeStation Group, Inc., all operating, and providing products and services, under the TradeStation brand and trademark. TradeStation Crypto, Inc. offers to self-directed investors and traders cryptocurrency brokerage services. It is neither licensed with the SEC or the CFTC nor is it a member of NFA. When applying for, or purchasing, accounts, subscriptions, products and services, it is important that you know which company you will be dealing with. Visit www.TradeStation.com for further important information explaining what this means.

BX: Potential Sell AreasI don't like the company. Align the market for better results and do your own DD.

Black stone (BX)Weekly ended with gravestone doji at trendline resistance
Macd, CCI and RSI all losing momentum and rolling over
Looking for a reversal here back to 95$
1st tgt 107 gap close

Blackstone Inc is forming a Symmetrical Triangle PatternBX is forming a Symmetrical Triangle Pattern from a previous downtrend. Expect the consolidation start to break down between now and by June 16th, 2023.
