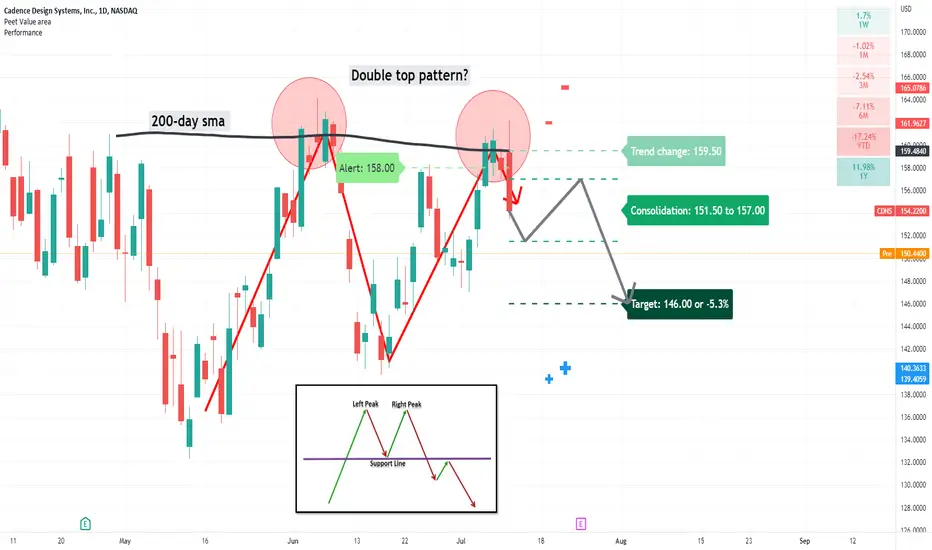
CDNS: double top pattern?The 200-day simple moving average acted as some major resistance.
A price action below 159.50 supports a bearish trend direction.
Further bearish trend support below 158.00.
Consolidation price range from 151.50 to 157.00
Crossing below 151.50 might target 146.00.
Crossing above 157.00 will be the first sign of pending strength.
CDNS trade ideas
$CDNS under accumulation, approaching buy point$CDNS showing classic signs of being under accumulation, with a six month base, multiple pocket pivots and an up/down ratio of 1.43 - it has an acc/dis rating of A- on IBD and features in the top 50, with a composite rating of 96. Definitely worth keeping on watch for a break over $168.83

RectangleThere is also an ABC bullish pattern inside the rectangle. The target for this pattern is D. As a rule, price will reverse when it hits D if the pattern makes it to D.
There is resistance from the upper trendline of the rectangle. In order for price to see full realization of the ABC bullish pattern, the upper trendline of the rectangle will need to be broken.
Rectangles are neutral patterns without a break of a trendline.
Retests of the trendline are common.
The top and bottom trendlines are marked.
No recommendation

WATCH $CDNSBearish
Fundamental
- High PE
- Negative PEG ratio
- Weak industry group
TA
- Bearish momentum divergence
- Momentum diving
- Broke down trend line
- Rejected retest
- Rejected fibo
- Strong supper / resistance at POC level

CDNS High-risk Initial LongCDNS High-risk Initial Long. SL and TP on the chart. If CFD 10-20x leverage. Move SL on TP.

Cadence Design Syst | Short to SupportCadence Design Systems ( NASDAQ:CDNS ) doesn't look very strong and is starting to regain downward momentum. If it doesn't break through the resistance line ($156-$158) in the coming weeks, I anticipate it will close the tiny gap between $136.96 and $137.11 and then test support near $125-$126 (if not lower to $120 - dotted blue line). Death cross started in early March with the 50 EMA crossing below to the 200 EMA.
P/E 59.8 and insiders continue to sell.

CDNS - Another Tech is Approaching Deep Correction?Is it time for overpriced tech stocks like Cadence Design Systems , specialising in software and hardware, to go into considerable correction to let some steam out?
Fundamental indicators:
Revenue and Profits - demonstrated consistent long-term earnings growth over the past 10 years
Profit margin - 23% in 2021 but dropped from 42% in 2020
P/E - extremely overpriced with 56x ratio
Liabilities - no problems with debt
Technically:
An impulse like correction in March 2020 has completed Running Flat (ABC) wave 4 as part of bull trend that lasted since 2016
Since then the final wave 5 has commenced with 2 impulses that formed a zig-zag of wave 1
This choppy movement suggests that it is not a rapid impulse developing but an Ending Diagonal with 3-3-3-3-3 structure
Hence two more zig-zags can be expected to reach and slightly update historic maximum of $192
Once the global wave is completed a deeper correction can be expected to the levels of $95-$120 which represent 0.382 and 0.5 Fibonacci retracement levels respectively
What do you think about this scenario for Cadence Design Systems ?
Please share your thoughts in the comments and like this idea if you would like to see more stocks analysed using Elliott Waves.
Thanks

Potential Head & Shoulders forming? Cadence is meeting its resistance on daily chart. right shoulder is forming and potentially may go down to 148 levels! If it breaks it can touch its previous highs at 180s

Bearish div on 4H and 1D for CDNS StockBearish divergence on 4H and Daily. Daily stoch RSI turning down after overbought condition, stoch RSI already declining on 4H. Divergence on MACD-H and EFI as well.
Entry: 158.85
Stop: 164,13
TP1: 148.1
TP 2: 145,6

cdnstp 8 %
tp 13 at 167
buy 1 at 154
risk 9 at 145 ( 1 : 1,4 )
risk 6 %
Financial Strength 7
Profitability Rank 9
Valuation Rank 1
Last Report 2021.06
Trend from 2011.08
Pattern_m -
Pattern_w -
Pattern_d -
EMA_m (trend) -
EMA_w (trend) -
EMA_d (trend) -
MACD_gist_m (divergence) -
MACD_gist_w (divergence) -
MACD_gist_d (divergence) -
EIS_w (green/blue/red) -
EIS_d (green/blue/red) -
EFI_w (up/down) -
EFI_d (up/down) -

CDNS: Breakout of the range up.The range resistance level could be broken upwards with the minimum target level around 180.

CDNS BreakoutBreaking out of 4 Month Long Rectangle
200 DMA Holding dips
Want to see volumes on a higher side


Long CDNS (Cadence Design Systems) on daily close break of $129A daily close above $129 should bring CDNS up to at least close the gap.

CDNS gap downEarnings beating + good news and good growth mean that some firm cashed in on their investment which drove the price down. stop-loss before the next resistance 2:1 return long

$CDNS with a slight bullish outlook after its earnings #Stocks The PEAD projected a slight bullish outlook after positive over reaction following its earnings release placing the stock in drift B
If you would like to see the Drift for another stock please message us. Also click on the Like Button if this was useful and follow us or join us.

Cup and HandleCDNS fell from a bearish rising wedge and changed the handle low in the process.
Hoping fall is complete
HL (handle low) is now very close to mid cup which is 107.5
Possible Stop under Handle low or mid cup..if you plan to handg on to this long term, I would place stop somewhere below 107.5 considering possible market volatility until election
Earnings over for this quarter and looks like CDNS did well
NV is high
Short interest is low
Not a recommendation

$CDNS could retest $105I see a rising wedge inside of a much larger upwards sloping trend line. Stock may have gotten ahead of itself and could retest $105 (trendline from March).
The pink box shows that price has been rejected at the highs. See the wicks.
Dropping to $105 would not be bearish. Bearish if breaking below that.

AllTimeHigh + Moving Averages$CDNS is again testing its ATH, after price broke up all its moving average.

2Q Earnings CUP AND HIGH VOLUM BUY CDNS 103.70$Cadence Design Systems, Inc. (Nasdaq: CDNS) today announced results for the second quarter of 2020.
Cadence reported second quarter 2020 revenue of $638 million, compared to revenue of $580 million reported for the same period in 2019. On a GAAP basis, Cadence achieved operating margin of 24 percent and recognized net income of $131 million, or $0.47 per share on a diluted basis, in the second quarter of 2020, compared to operating margin of 23 percent and net income of $107 million, or $0.38 per share on a diluted basis, for the same period in 2019.
1% CAPITAL

BIG Pontential For CADENCE DESIGN SYSTEMSHey guys, CADENCE DESIGN SYSTEMS is on a strong trend support bullish movement, rejection of buyers at the end of the session we are at the top of the stabilization zone and the possibility of breaking it.
Please LIKE & FOLLOW, thank you!

Signals For 23/06/2020Hi guys, me again. Let’s get on with some more signals.
EURUSD – the price is in a resistance at 1.13. If the price holds above – long with a target at 1.1340, but if it’s a false breakout, short with a target at 1.1260
GBPUSD – the price got a bounce for the level at 1.25, I recommend a short with a target at 1.2430
USDCAD – the price is in a range between 1.36 and 1.35and tried to get a bounce from the bottom, so you can long with a target at 1.36, if the price impulses out the bottom and forms and entry, you can short with a target at 1.34
Oil- the price tried to hold above 40.50, so I expect a bounce from 41/50. If a reversal pattern forms – you can long with a target at 41.50. If it breaks out and holds below, you can short with a target at 39.
AMD - the price is in a consolidation between 55.50 and 54. I’m feeling bullish, so I expect a breakout follow by an entry pattern, after which you can long with a target at 57.50
BIIB - the price is in a range between 270 and 260, so we once again have to wait for a reaction. If it impulses out the top, you can long with a target at 285. If it impulses out the bottom, you can short with a target at 240.
CDNS - the price tried to break an all-time high last session, but holding above 94, I recommend you long with a target at 97.
That’s about it, I hope you found this useful, have a good day.

