CELH trade ideas
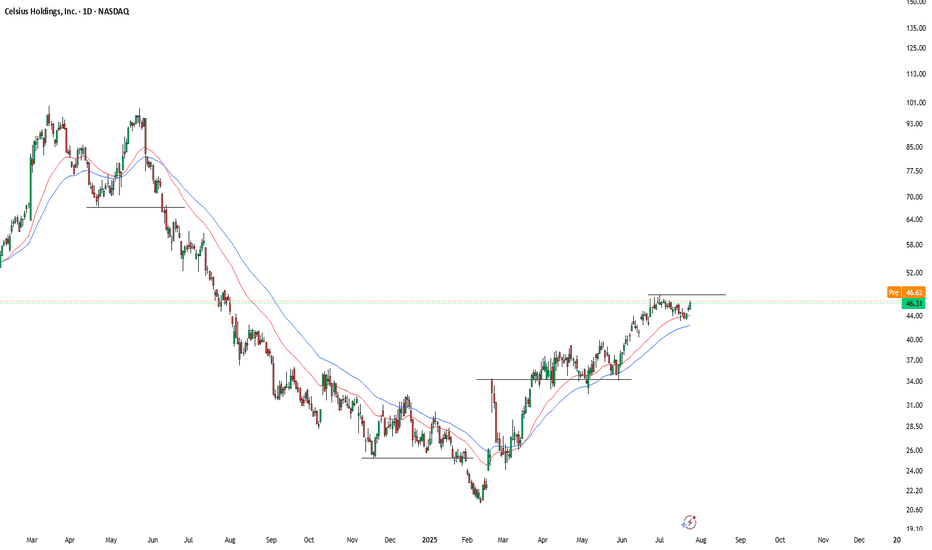
CELH Eyes Upside Momentum as Consolidation TightensCelsius Holdings, Inc. ( NASDAQ:CELH ) has shown a notable recovery from its early 2025 lows, steadily climbing and recently consolidating around the $46 level. The stock is currently trading above both the short-term (red) and mid-term (blue) moving averages, which are sloping upward—indicating bullish momentum.
The recent price action reveals a tight consolidation just below the previous local highs around $47–$48. If CELH can decisively break above this resistance zone with increased volume, it may trigger a short-term breakout and open room toward the $52–$55 range, even $60.
Conversely, if the stock fails to break above resistance and falls below the $43–$44 support area (near the moving averages), it could trigger a short pullback toward the $40 level.
Key Levels to Watch:
Resistance: $47.50–$48.00
Support: $43.00–$44.00
Breakout Target: $52.00–$55.00 / extended $60
Momentum remains positive, but confirmation through volume and follow-through price action is essential for any breakout to sustain.
CELH UpdateAs mentioned in my old CELH post, I'm still holding.
On my new projections, assuming CELH is done for now due to it now testing the golden ratio 50.00% - 61.80% , a famous POI which more often than not results in a change in trend, and basing off of CELH's history, this area is respected.
So with this knowledge I have trimmed here, and I soon expect an ABC correction moving down to my level of support sitting at $38 , the 38.20% also sits here, which has also been proven to be a strong support level. If we find this level being tested, I will add back to my position and hold firm up toward $68.
push pass 40 is coming, i can smell it.boost and follow for more 🔥 CELH has clearly been in a uptrend for months, I also noticed when spy tanks CELH does not pullback much. But when the market rallies CELH follows.
This shows clear strength and sign investors aren't scared, and expect much higher and soon! this continues to be one of my favorite stocks of this year. push past 40+ should come by end of April in my opinion. time will tell, see you all soon with more!
CELH | Triple Digit Gains IncomingCelsius Holdings, Inc. engages in the development, marketing, sale, and distribution of functional drinks and liquid supplements. It also offers post-workout functional energy drinks and protein bars. The company was founded in April 2004 and is headquartered in Boca Raton, FL.
Celsius Stock Chart Fibonacci Analysis 051525Trading Idea
1) Find a FIBO slingshot
2) Check FIBO 61.80% level
3) Entry Point > 35/61.80%
Chart time frame: D
A) 15 min(1W-3M)
B) 1 hr(3M-6M)
C) 4 hr(6M-1year)
D) 1 day(1-3years)
Stock progress: A
A) Keep rising over 61.80% resistance
B) 61.80% resistance
C) 61.80% support
D) Hit the bottom
E) Hit the top
Stocks rise as they rise from support and fall from resistance. Our goal is to find a low support point and enter. It can be referred to as buying at the pullback point. The pullback point can be found with a Fibonacci extension of 61.80%. This is a step to find entry level. 1) Find a triangle (Fibonacci Speed Fan Line) that connects the high (resistance) and low (support) points of the stock in progress, where it is continuously expressed as a Slingshot, 2) and create a Fibonacci extension level for the first rising wave from the start point of slingshot pattern.
When the current price goes over 61.80% level , that can be a good entry point, especially if the SMA 100 and 200 curves are gathered together at 61.80%, it is a very good entry point.
As a great help, tradingview provides these Fibonacci speed fan lines and extension levels with ease. So if you use the Fibonacci fan line, the extension level, and the SMA 100/200 curve well, you can find an entry point for the stock market. At least you have to enter at this low point to avoid trading failure, and if you are skilled at entering this low point, with fibonacci6180 technique, your reading skill to chart will be greatly improved.
If you want to do day trading, please set the time frame to 5 minutes or 15 minutes, and you will see many of the low point of rising stocks.
If want to prefer long term range trading, you can set the time frame to 1 hr or 1 day.
Celsius Holdings Outperforms Market with Strong YTD GainsCelsius Holdings Inc. (CELH) continues to attract significant investor attention, closing at $37.24 on April 17, up $0.58 (1.58%). The functional energy drink maker has delivered impressive year-to-date returns of 41.38%, substantially outpacing the S&P 500's 10.18% gain during the same period.
For the current quarter, analysts expect earnings of $0.20 per share, representing a 25.9% year-over-year decline. However, consensus estimates have improved dramatically with a 32.8% upward revision over the last 30 days. The full-year outlook appears more favorable, with projected earnings of $0.99 per share indicating a 41.4% annual increase, followed by 15.1% growth to $1.14 per share next fiscal year.
Current quarter sales are expected to decline slightly to $345.26 million (-2.9%), but full-year revenue estimates show robust growth of 55.3% to $2.1 billion, followed by 19.4% growth next fiscal year. Celsius has demonstrated strong execution recently, beating earnings estimates in three of the last four quarters.
Technical Analysis
Technically, the chart shows a strong recovery from its $21.10 low. Price has recently broken above the 50-day moving average but remains below the 200-day moving average, suggesting improving momentum within a longer-term downtrend. Key resistance appears around $47-49, marked by a horizontal level that previously acted as support.
Volume has increased during recent price advances, adding credibility to the current uptrend. The next major challenge will be overcoming the $49 resistance zone before potentially continuing toward higher targets as indicated in the chart projection. If price faces rejection, it is likely to drop back to support at around $25.
Celsius Holdings (CELH) – Fueling the Wellness Energy RevolutionCompany Snapshot:
Celsius NASDAQ:CELH is a top-tier functional beverage brand, capitalizing on the explosive growth of health-conscious energy drinks. Known for its clean-label, metabolism-boosting formulas, CELH is a favorite among fitness enthusiasts and wellness-driven consumers.
Key Catalysts:
Strategic Acquisition – Alani Nu 🎯
Expands CELH’s reach into the women-centric energy drink market
Enhances brand diversity and strengthens product portfolio
Accelerates penetration into lifestyle & wellness channels
PepsiCo Distribution Partnership 📦
Unlocks massive scale and global shelf visibility
Boosts velocity in convenience, grocery, and fitness retail
Strategic alignment continues to fuel international expansion
Clean Energy Demand on the Rise 🌱
Consumers are actively shifting from sugary and synthetic brands to low-calorie, functional alternatives
Celsius delivers on performance + wellness—a powerful consumer value prop
Brand Loyalty & Community 👟
Strong digital engagement with a cult-like following
Supported by fitness influencers, events, and brand ambassadors
Investment Outlook:
✅ Bullish Above: $30.00–$31.00
🚀 Upside Target: $52.00–$53.00
📈 Growth Drivers: New market segments, global scaling via Pepsi, clean-energy trend momentum
📢 CELH: Redefining energy drinks with purpose, performance, and wellness.
#CELH #FunctionalBeverages #CleanEnergy #WellnessTrend
CELH Building a Base Before Next Move? CELH Building a Base Before Next Move? Key Gamma & SMC Zones in Play
1. Market Structure & Price Action:
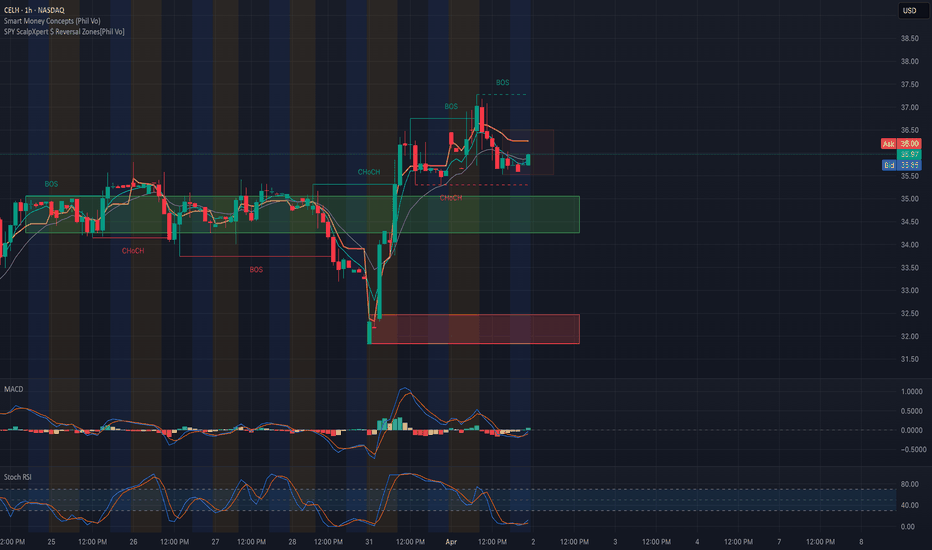
CELH has printed two Break of Structure (BOS) signals after reclaiming demand near $32.50. After the CHoCH on March 28, price flipped bullish with a strong impulse, then consolidated near the $36–$37 zone, forming a new BOS.
Price is currently trading inside a newly defined bearish FVG (Fair Value Gap) and liquidity sweep zone from $35.80–$36.50. Support is building at the $35 level, and a higher low has been maintained after retesting the previous BOS origin.
2. Smart Money Concepts (SMC):
* CHoCH: Flipped bullish on March 28 after prolonged compression.
* BOS x2: Signals were clean near the $33 and $36 pivots — continuation possible if $36.50 breaks.
* Liquidity Zones:
* Demand block near $34.50–$33.50
* Supply/FVG region: $36–$37.50
* Trendline Support: Holding higher lows on the short-term channel.
3. Indicators (1H Chart):
* MACD: Bearish crossover but flattening — potential for reversal.
* Stoch RSI: Oversold and beginning to curve up, signaling a possible bullish push.
* 9/21 EMA: Slightly squeezed, with price hovering just above both — waiting for confirmation breakout.
4. Options GEX Analysis:
* Gamma Walls:
* $36: High open interest wall (GEX resistance)
* $40: Strongest positive GEX zone — price magnet if bulls break $36.50
* Put Support Walls:
* $35 & $34.50: Layered support from -9% to -25.7% Put GEX levels
* HVL at $36 (04/04 expiry): Key battle zone
Sentiment & Flow:
* IVR: 27.1
* IVx Avg: 68.5
* CALLs Flow: 48.4% (highly bullish skew)
* GEX Sentiment: 🔴🟢🟢 (Neutral–Bullish)
* Time to Expiry: 4h 16m (likely driving gamma pinning around $36)
5. Trade Scenarios:
🔹 Bullish Scenario:
* Break and hold above $36.50 confirms momentum toward $38–$40
* Entry: $36.20+
* Stop Loss: $35.20
* Target 1: $38
* Target 2: $40 (gamma wall)
🔻 Bearish Scenario:
* Break below $35 support triggers downside to retest demand at $34.50
* Entry: $34.90
* Stop Loss: $36.10
* Target: $33.50–$33
Final Thoughts:
CELH is coiling within a tight zone between strong supply and demand. If bulls can hold $35 and break the $36.50 gamma wall, the price has room to magnet toward $38–$40. A break below $34.50 opens the downside path back to $33. Watch volume around $36 and flows as expiry nears.
This analysis is for educational purposes only and does not constitute financial advice. Always do your own research and trade responsibly.
Celsius Holdings, Inc. (CELH) – 30-Min Long Trade Setup!📈 🚀
🔹 Asset: CELH – NASDAQ
🔹 Timeframe: 30-Min Chart
🔹 Setup Type: Rising Wedge Breakout (Bullish Bias)
📊 Trade Plan (Long Position)
✅ Entry Zone: Above $34.89 (Breakout Confirmation)
✅ Stop-Loss (SL): Below $33.42 (Trendline & Previous Candle Support)
🎯 Take Profit Targets:
📌 TP1: $36.80 (Key Resistance Level)
📌 TP2: $38.91 (Extended Target / Measured Move)
📊 Risk-Reward Ratio Calculation:
📉 Risk (SL Distance):
$34.89 - $33.42 = $1.47 risk per share
📈 Reward to TP1:
$36.80 - $34.89 = $1.91 (1.29:1 R/R)
📈 Reward to TP2:
$38.91 - $34.89 = $4.02 (2.73:1 R/R)
🔍 Technical Analysis & Strategy
📌 Bullish Breakout of Wedge: Price is pressing against wedge resistance, signaling possible continuation.
📌 Strong Bullish Momentum: Clear uptrend since mid-March, supported by rising volume.
📌 Candle Confirmation Needed: Look for a bullish 30-min close above $34.89 to validate the move.
📌 Support at $33.42: Ideal place to define risk, as it represents the lower wedge trendline.
⚙️ Trade Execution & Risk Management
📊 Volume Confirmation: Strong green volume on breakout is essential.
📉 Trailing Stop Strategy: Once TP1 is hit, move SL to break-even ($34.89) or higher.
💰 Partial Profit Booking Strategy:
✔ Take 50% profits at TP1 ($36.80), and let the rest run toward TP2 ($38.91).
✔ Lock profits by moving SL after TP1 is reached.
⚠️ Breakout Failure Risk
❌ Avoid premature entry – wait for clear breakout candle.
❌ Break below $33.42 invalidates the setup.
🚀 Final Thoughts
✔ Strong bullish structure with clear R/R up to 2.73:1
✔ Textbook breakout setup from a rising wedge
✔ Ride the trend with proper volume confirmation and disciplined risk
🔗 #CELH #NASDAQ #LongTrade #BreakoutStrategy #SwingTrading #ProfittoPath 📈🔥
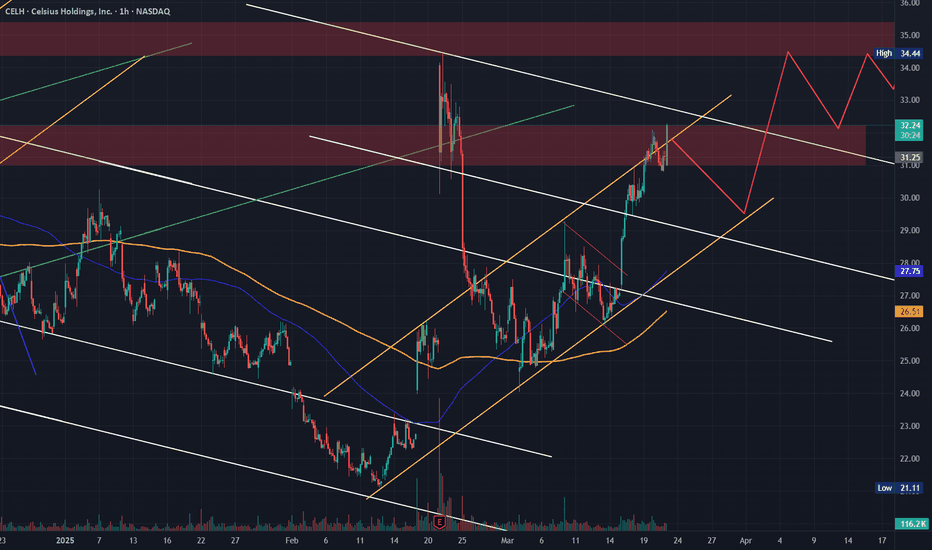
CELH - I Digress! Still very bullish on this chartAs you see from all my linked CELH videos below, I've been watching this and playing this name for the past few months considering the PA and strength of this company (in relation to where it's being valued atm).
Could have kept this video much shorter by simply showing the supply & demand battle that's been going on above us. Mainly the supply levels at $34 (HTF) and $31 (LTF). Love the flow and natural market movements that we've been seeing on this undervalued name and I will be continuing to add to my position in the $28/$29 range if given the opportunity.
Breakout of our LTF supply highlighted in this video is huge for our push to break the HTF $34 supply.
Happy Trading :)
my favorite setup at the moment!boost and follow for more 🔥
CELH looks ready for a parabolic squeeze in my opinion, the short trap below support then trend breakout, retest and resistance flipped to support. 🚀
RSI also showing at extremely oversold levels, I added shares at 27 last week but I'm adding calls to my position today. the rally to 40-62 targets is very likely in my opinion. 🎯
this may be my only chart for today but I will be back later this week with some more, see you soon! ✌️
CELH pattern recognition Celsius Holdings Inc. (CELH) has exhibited the cup pattern multiple times over the past few years, consistently completing this formation before moving higher. The stock has demonstrated a tendency to round out a bottom, regain strength, and break out to new highs, making this one of its most reliable technical patterns.
CELH’s Historical Cup Patterns
• CELH has formed and completed the cup pattern on several occasions, where the stock experiences a prolonged decline followed by a steady recovery that rounds out into a U-shape.
• This pattern has repeatedly resulted in a breakout to new highs, as seen in previous years, such as 2020, 2021, and 2023.
Current Formation & Potential for Its Biggest Cup Yet
• CELH appears to be halfway through another major cup formation, with price action suggesting the stock is building toward another potential breakout.
• The stock is recovering from a rounded bottom, setting up what could be its largest cup formation yet if it continues its upward momentum.
• If CELH completes this current cup and breaks above key resistance levels, it could signal another major rally, similar to past cycles.
CELH Bottoms in. A Bullish Case CELH is showing every sign of hitting the bottom. Ripe for a rise in price
CELH is now showing signs of a reversal.
A bullish divergence from the RSI , A sign of accumulation (trend lines placed to emphasis)
Only positive reaction to earnings since the price decline
And greatest of all the volume after earning, 4X that of average (confirmation of reversal) and sitting now on key support level.
CELH raised in 2022 when most stocks were falling, and now again in 2025 is looking to repeat history. CELH is not aligned with the S&P 500.
I am not a financial advisor ..........


