COP - EOM UpdateMonthly candle closed so here is an update.
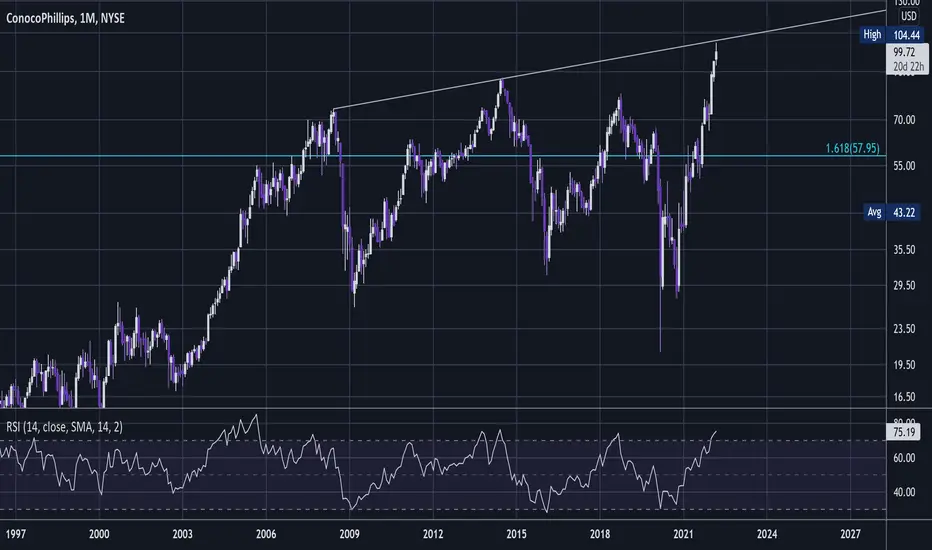
COP having tagged the upper trendline of this long expanding pattern with an upper wicked candle has now slumped back to print a double wicked candle with bearish body through the 1.618 projection taken from the previous 3 pivots which will most likely prove to be a shakeout reversal top to collapse back down.
RSI is now very close to crossing back down below the upper band which would show bearish momentum.
I currently hold a 2024 ATM LEAP put bought when COP was @ $100 and the two 0.618 Fibonacci targets are a band from $39 to $44 that I would like to buy back my puts should price get there in time. There is also support in that area and with also the Fibonacci confluence it would be an area that will likely see a bounce.
A big collapse should be coming as this trend since the lows is a very overextended 416% move from the previous low also with USOIL overextended and overlaid on the chart. Arithmetic view gives a better perspective of just how wild this trend has been.
If it comes crashing down then the very low implied volatility at time of purchase should expand which will add value to my put.
COP is being written about as being one of the best buys in oil and energy currently as it appears to be topping out.
I would be surprised if there are m any monthly candles with bullish bodies from herein.
Just to add, this 1.618 @ $58 is a long term 3 pivot projection taken from the lows, which I think will prove the entire price action above to be Distribution.
Not advice.
COP trade ideas

COP breakout soonCOP has been in an ascending channel for the last 6 months. Its at the bottom of the channel and a symmetrical triangle has formed. Breakout this week. To 115.

COP - Round Number Short 🐻COP hit $104 this weak with RSI hitting 75 - highest monthly reading since 2005 with divergence in this expanding topping pattern.
Retraced back up to 0.618 @ $100 today.
Not advice.
COP Shorting This Great Company With Leap PutsOn a tip from my friend @dRends35 I looked at this very overextended chart and shorted it this morning. Not advice Take a look.

ConocoPhillips found its peak. COPShorting divergent upgoing zigzag. Fib on Wave C first as targets.
Immediate targets 86, 83,79. Invalidation at 94.
We are not in the business of getting every prediction right, no one ever does and that is not the aim of the game. The Fibonacci targets are highlighted in purple with invalidation in red. Fibonacci goals, it is prudent to suggest, are nothing more than mere fractally evident and therefore statistically likely levels that the market will go to. Having said that, the market will always do what it wants and always has a mind of its own. Therefore, none of this is financial advice, so do your own research and rely only on your own analysis. Trading is a true one man sport. Good luck out there and stay safe

$COP with a Neutral outlook following its earnings #Stocks The PEAD projected a Neutral outlook for $COP after a Positive over reaction following its earnings release placing the stock in drift B with an expected accuracy of 100%.

ConocoPhillips had 6 crashes since 1974One of the simplest way to invest/trade Oil Companies is to study the Brent/WTI price movements because they are very correlated.
Every oil price crashes, oil companies will follow as well. Commodities is very volatile and for that comes an opportunity to profit.
In the last 50 years, every time the stock drops more than 50%, it follows by a rally. For this stock, it crashed 6 times in the last 50 years the stock crashed every 8 years however that average is skewed by a massive bull run on the stock from its recovery of 1985-86 crash until it reached its peak in 2008 (a whopping 2783% rally!!)
Before that massive ridiculous rally, the stock crashed on average every 4 years. In the most recent 3 crashes is within the last 13 years.. on average roughly, the stock crashed more or less every 4 years
The last two crashes were followed by a rally with an average of 180% bull run. Currently the stock is on a 274% bull run!
Actionable : It's hard to trade/invest in oil companies using the normal valuation method i.e DCF due to its tight correlation with oil prices. I let the price movemet of oil to decide for me if its time for me to buy this stock. Currently I am on the sideline and wait for a correction.

$COP with a Bullish outlook following its earnings #Stocks The PEAD projected a Bullish outlook for $COP after a Negative Under reaction following its earnings release placing the stock in drift D with an expected accuracy of 33.33%.
If you would like to see the Drift for another stock please message us. Also click on the Like Button if this was useful and follow us or join us.

ConocoPhillips (COP) bearish scenario:The technical figure Triangle can be found in the US company ConocoPhillips (COP) at daily chart. ConocoPhillips is an American multinational corporation engaged in hydrocarbon exploration. The Triangle has broken through the support line on 11/11/2021, if the price holds below this level you can have a possible bearish price movement with a forecast for the next 12 days towards 67.35 USD. Your stop loss order according to experts should be placed at 77.15 USD if you decide to enter this position.
Risk Disclosure: Trading Foreign Exchange (Forex) and Contracts of Difference (CFD's) carries a high level of risk. By registering and signing up, any client affirms their understanding of their own personal accountability for all transactions performed within their account and recognizes the risks associated with trading on such markets and on such sites. Furthermore, one understands that the company carries zero influence over transactions, markets, and trading signals, therefore, cannot be held liable nor guarantee any profits or losses.

CONOCO Phillips, COP SHORT, LONG PUTCareful as this trade correlates with oil market and oil market is very volatile. Respect Rules, THAT'S ALL.
STOP 79, Target 1 68, Target 2 60, Entry 76.50

COP 45m Wolfe Wave bullish 11/3A Wolfe Wave is a chart pattern composed of five wave patterns in price that imply an underlying equilibrium price. Investors who use this system time their trades based upon the resistance and support lines indicated by the pattern.

#COP RSI divergence Daily
NYSE:COP
-Rsi divergence confirmed
-Volumes divergence with price
-Sector in huge uptrend this year ( >100% ) but sector -0.17% last week
-Price away from 50MA

COP: Ascending Triangle (95%)Ascending Triangle, not confirmed yet.
Will need volume to break the 65$ resistance.
If confirmed:
Price target = 128$
Stay humble, have fun, make money!

COP LONG opportunity, counter trend line breakoutFundamentally supported by the possible shortage causing the "IDA" hurrican. Also a good Risk Reward opportunity, and the dividents as well.

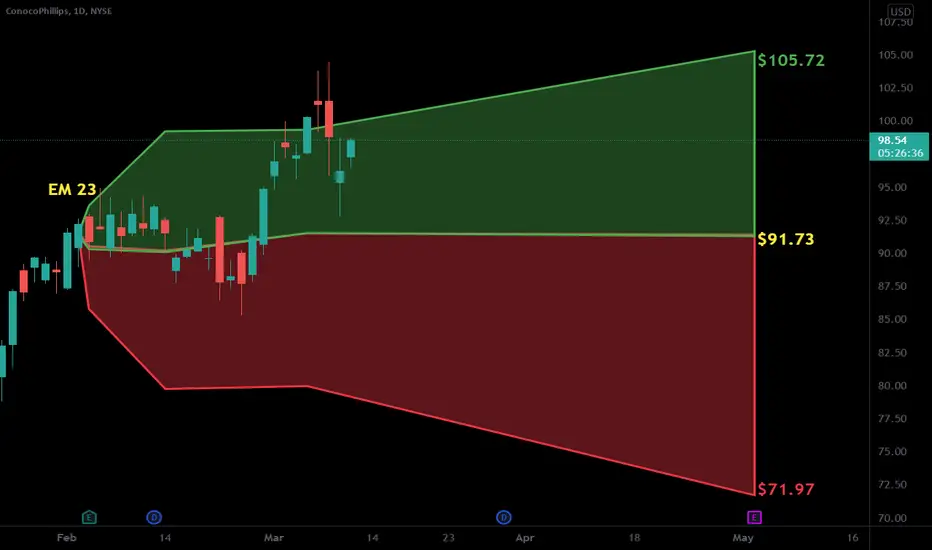
Time for ConocoPhillips to end the skid?Based on historical movement, the trough could occur anywhere in the larger red box. The final targets are in the green boxes. The pending top should occur within the larger green box as has been the historical case. Half of all movement has ended in the smaller green box. In this instance, the signal indicated BUY on August 16, 2021 with a closing price of 54.82.
If this instance is successful, that means the stock should rise to at least 55.17 which is the bottom of the larger green box. Three-quarters of all successful signals have the stock rise 2.337% from the signal closing price. This percentage is the bottom of the smaller green box. Half of all successful signals have the stock rise 4.213% which is the end point of the black dotted arrow. One-quarter of all successful signals have the stock rise 8.049% from the signal closing price which is the top of the smaller green box. The maximum rise on record would see a move to the top of the larger green box. These are the same concepts for the levels in the red boxes as well.
The ends/vertical sides of the boxes are determined in a similar fashion. The peak of the rise can occur as soon as the next trading bar after signal close, while the max rise occurs within the limit of study at 40 trading bars after the signal. A 0.5% rise must occur over the next 40 trading bars in order to be considered a success. Three-quarters of successful movement occur after at least 7 trading bars; half occur within 21 trading bars, and one-quarter require at least 34 trading bars.
The black dotted arrow represents median historical movement. Medians are a good metric, but they are just one of many I use when forecasting future movement.
As always, the stock could decline the very next bar after the signal without looking back (therefore the red boxes would not come into play) or the stock may never decline (and the green boxes may never come into play).


COP Multiple Timeframe LevelNYSE:COP pulled back this morning to a Daily timeframe 50% Retracement Level. This level goes back on the Weekly many years.
I like this for a long term hold play for dividends as well as a short term options play for the run up to earnings.
Check out my video idea for more thoughts on combining timeframes for Multiple Timeframe Analysis...

Conocophillips approaches powerful resistance level 61.06Conocophillips ($COP) continues to rise inside the clear daily upward impulse with started earlier with the daily Piercing Line candlestick reversal pattern back in April. The price is currently aiming at the major resistance level 61.06 (which stopped the sharp uptrend in March). Given the fact that the price has the freedom of only 0.36 ATR (Average True Range) to rise from the current levels – the intraday correction is not ruled out when Conocophillips approaches the resistance level 61.06. Strongly overbought daily Stochastic at 91.13 adds to the probability of the downward correction from resistance level 61.06.

ready to break resistanceThe stock is holding EMA50 as its support area with the price of $51. The stock looks ready to break above the resistance level $55. Our target to reach $59 -$60. Now it's standing in a good price to open a long position. Good risk/reward ratio.

COP - Oil and gas company is set for an impulseWith recent USOIL strength, oil companies have been doing well. I'm expecting a breakout in the world's biggest commodity and also on this stock.


COPMID-TERM: Bounce off support, backtest of supply line breakout, classic bullish divergence on 4hr, hidden bullish divergence on daily. (not financial advice)
