$COSTCostco's persistent trading range presents a favorable risk-reward trade opportunity for option traders and equity investors.
COST trade ideas

COST- another candle to confirm a reversal patter, On 3 March 2023, COST appears a reversal patter which we need to confirm it on Monday. Anyway, there is a very attractive reward and loss ratio. Stop loss should be $465.

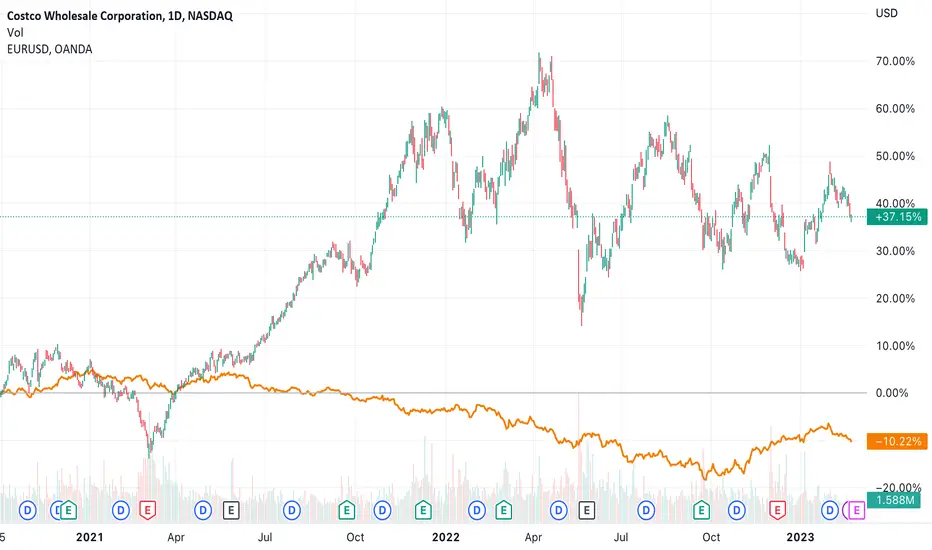
$COST Opportunity after earningsSince the ATH last April NASDAQ:COST has been beaten up after earnings. It has dropped 5-10% from the close prior to earnings to hit a post earnings low within 3-4 weeks before recovering to resistance at the descending trendline. The green upward trendline aligns to the bottom of the overall trend for the past few years. Consolidation patterns like these typically end with a larger move up/down. The longer-term outcome will likely be dependent on how the market feels about the consumer staples and discretionary sectors. In the short-term, this chart highlights an opportunity to build/accumulate toward a position within the near term trend, assuming that this behavior continues until there is an overall change in sentiment. Adding ~$462, targeting $488-500 for resistance, and a stop at $442, and reaccumulation $390-400.

EW analysis - Can Costco double?As long as Costco doesn't fall below 447.9 it looks like it is in a big wave 4 of Supercycle degree. A Supercycle that started in October 1987.
This wave 4 is developing as a triangle.
Wave e of that triangle should reach approxemately 465 - 468 Dollar.
From there a reverse fibonacci would indicate a target for wave 5 at about 1100 USD.
This is all in log scale.

Costco price trading in a technical formation
Shares in Costco Wholesale Corporation (symbol ‘COST’) have gone through a very turbulent year with the share price ranging from high $610 to low $405. The company’s earnings report for the fiscal quarter ending February 2023 is set to be released on Thursday 2nd of March, after market close. The consensus EPS for Q1 is $3,21 compared to Q1 2022’s $2,92.
‘Costco generated just 2% of its revenue from membership fees, however, those $4.2 billion in membership fees accounted for most of its $7.8 billion in operating profits. This clever “formula” of generating revenue with a very high profit margin has helped the company get through a hard year.’ said Antreas Themistokleous, an analyst at Exness.
On the technical side the price has been trading in a descending triangle formation for the last 6 months. Currently the price is facing resistance at a point on the chart where is the crossing of the 20 day simple moving average line with the 50% of the daily Fibonacci retracement level. Given that there will be no big surprise percentage on the EPS at the date of the release the price most probably will continue to trade within the boundaries of the triangle formation in the short term.
In the case of upward movement ( supported also by the oversold levels on the Stochastic oscillator) we might see some resistance around the $520 price area which consists of the upper band of the Bollinger bands and the 61.8% of the Fibonacci, whereas in the case of a downward continuation the first point of support would probably be found around the $490 area which is made up of the 50 & 100 moving averages, the lower band of Bollinger bands and is also just below the 38.2% of the Fibonacci.

COST - Can we use it as an indicator? Costco..... As a retailor it's hard to argue. They have a good thing going!
If we can use this as an indicator..... the health of the consumer economy going forward looks grim.
The longer term pattern displayed on the chart is clearly a topping pattern. How it plays out is of course, what we're interested in .
This is how I see it.

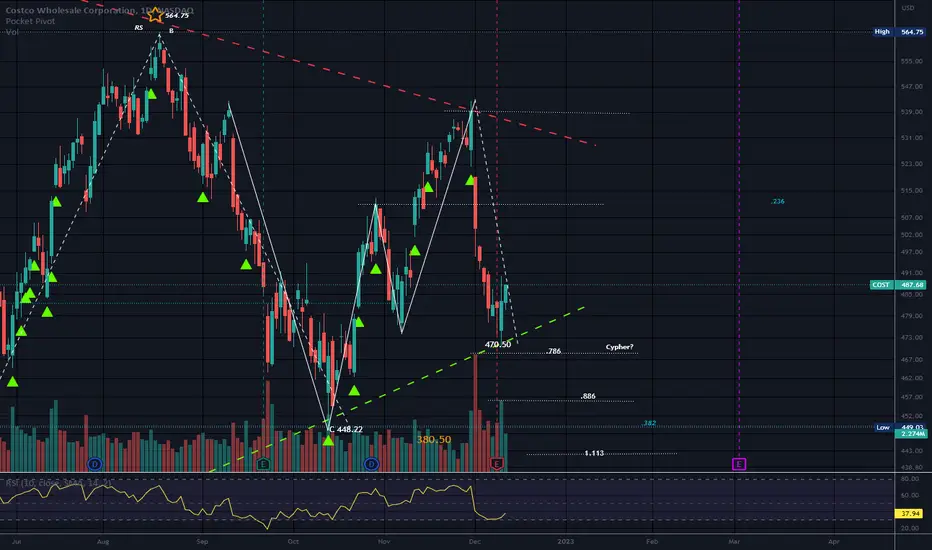
Symmetrical TriangleThere is also an M structure that touched the .786.
This was also at the support line of the triangle.
Peak 2 is higher than peak 1.
No recommendation.
COST D1 - nice volume"You can never make the same mistake twice. The second time you make it, it’s no longer a mistake, it’s throwing money away."

COST - Who doesn't love costco?Costco is probably one of my favorite places to shop and I think the stock price over the last 14 years has proven that to be the case for a lot of people.
The main issue I have with buying this stock is valuation and growth of the company. I don't see how they will be able to grow fast enough to support a 35+ PE ratio.
Taking the fib from the 08 lows to the 2022 highs, we get targets around 395, 327, and 258 for the 38.2, 50.0, and 61.8 retracement levels. If you think about it, 258 from a valuation perspective only starts to make the stock a reasonable price at about a PE of 20 assuming 13.23 EPS.
It looks beautiful from a long term trend perspective and I think it has many more years to grow, but I wouldn't touch it unless it was 308 or less purely from a fundamental perspective. Might look to short this one this year.
This is not financial advice. Good Luck!

Costco under 300 by 2025Horrible place to invest in this stock....
Won't be a decent enough dip in my opinion until late 2024.
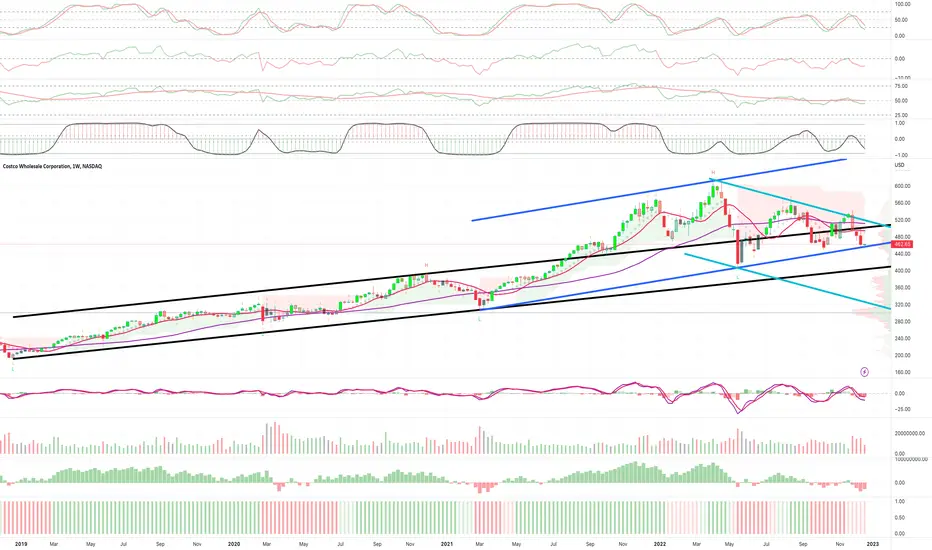
White - Super uptrend
Yellow line - primary uptrend
Currently - Distributing phase
The crazy thing about the decline e to come is that as long as the yellow uptrend holds , this stock is consider bullish 😆

No one is going to believe meHuge triangle breakdown and double head and shoulder breakdown on the horizon. I would like to react at the break of the grey dotted neckline for conformation. Going down the first major stop and pullback will occur at the weekly 200sma. In the long run I believe we could see this triangle hit its full target of around 265.

COST testing meaningful supportCOST testing meaningful support at the BLUE channel structure.
The overall bias remains to the downside.
A break below the BLUE structure could allow price to slip into the lower $400 handle.

Costco ... Cleanup in aisle #7 (an update)Well I obviously bailed too early on this; which should be a lesson to me
S.

#COST 2-2 reversal in monthly chartHello dear Traders,
Here is my idea for #COST
Price closed below yellow line (previous month low)
Targets marked in the chart (green lines)
Invalidation level marked with red line
Good luck!
❤️Please feel free to ask any question in comments. I will try to answer all! Thank you.
Please, support my work with like, thank you!❤️

COSTCO Bye Bye!COST under 460=420.
Short it if we break and retest that level.
Trading at a 35 P/E, it needs to come down.

$COST Costco 2-2 Reversal Month$COST took the 2-2 reversal Month and is headed to the target 1 of $449.03
$COST also has triggered the Inside Quarter down with magnitude to $406.91 but the Q ends 12/31
Currently $COST is FTFC down

COSTHigher lows are being formed on Costco although it seems that this one could continue to fall, not much was able to be done above 533 on it which was a major resistance.

$COST CALLS$COST has broken structure on the daily and has tapped into a OB on friday might have missed the initial entry but is still looking good for a big move up.

$COST with a Bullish outlook following its earnings #Stocks The PEAD projected a Bullish outlook for $COST after a Negative over reaction following its earnings release placing the stock in drift C with an expected accuracy of 66.67%.

COST New Trade > Naked Put
New Trade $COST
Naked Put
Strike $370
Premium $1.16 x 2 contract = $232.00

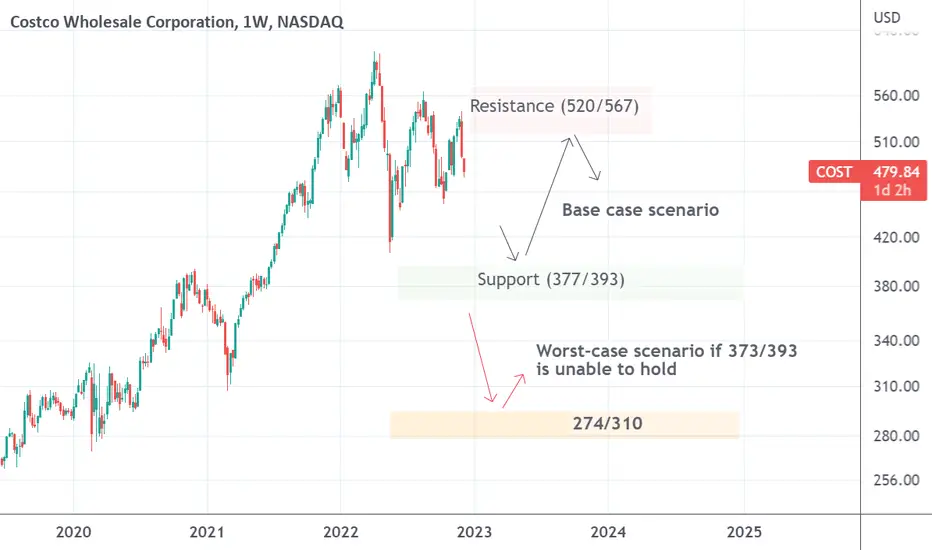
Costco’s shares have topped out Given historical data since 1987, Costco stock has performed quite well except during extreme events such as recessions and the market turmoil. Although stock kept its bullish momentum since 2009, it finally topped out at 612.27 in April 2022.
The top pattern made during 2022 poses a threat to the long-term secular trend. The rising trend that stock has enjoyed over the past 12 years is clearly faded away after making a series of failed upward moves since Dec of 2021. The top formation suggests that price may slip to a supporting area between 377 and 394 followed by a rebound toward a range between 520 and 567.
Base case scenario implies that Costco’s shares might be trading within a wide range between 377 and 567 (Average price of 472) throughout 2023. If price is unable to hold above 377, it is likely a worst-case scenario is in play. Worst case scenario points to a decline toward 290 level.