COST trade ideas


Cost - head and shoulders pattern played out, ER run up?Friday, We closed below the pivot point and 50 sma. Bullish note - backtested the previous breakout point from July 10-30 consolidation area. The next level of support is $321.12. On Friday, over 7000 $340 calls were bought. 5% implied earning move, play the run up to ER. Good Luck!

IRON TARIHi guys!
For this Iron Condor we have 3 weeks at 5% strike, so our short legs are 327.5 and 362.5, probability to win 69%, so Rew/risk = 100-69/69= 0.44
With a 2.5$ spread we can collect 100$ to sell IC, so
Max profit=100
Max loss = 150
RR= 0.66, 50% more than 0.44!
Enjoy your wallet!
Tari.


Bullish. Upcoming Earnings. Target: $385Greetings.
I'm bullish on COST after analyzing the monthly, weekly, and daily charges. COST is in a strong bullish trend, and while the indicators show signals that security is on the brink of "overbought," I anticipate more upside with a target of $385. The line that previously acted as resistance, now offers support for COST. The options activity surrounding COST indicate a bullish sentiment. In addition, analysts estimate a bullish earnings report.
Happy Trading!
Disclaimer. My ideas are for informational purposes only. My ideas do not constitute solicitation, recommendation, endorsement, or offer to buy or sell any securities or other financial instruments. You should not construe any such information or other comments as legal, tax, investment, financial, or other advice. There are risks associated with investing in securities. Investing in stocks, bonds, exchange traded funds, mutual funds, options and money market funds involve risk of loss. Loss of principal is possible. Please exercise your own due diligence.

costco buy the dip upcoming dip followed by a move to 351. not a huge move but maybe a good bottoming to go in with some options on
happy trading


$COST Looking bullishAgain reaching the resistance level around 315$
I see three scenarios IMO:
1. It will form a small cup and handle pattern and move higher.
2. It will break through resistance level, move higher and use the old resistance as new support.
3. It will be rejected by the resistance and will go back to re-test support level at 295$

$COST staying in the channelBouncing off nicely again from the lower channel.
Hopefully will see some breakthrough above 315$ in the next month or so!
$COST

COST Can we get a break plox?Been watching this sucker and have calls i bought at 341. Lord give me that sweet break.

COST : Inverse Head & ShouldersInverse Head & Shoulders
TP 1 = 344.78
TP 2 = 348.86
TP 3 = 353.42
Please don't forget to FOLLOW , LIKE and COMMENT ...
If you like my analysis:)
Thank you and Good Luck!


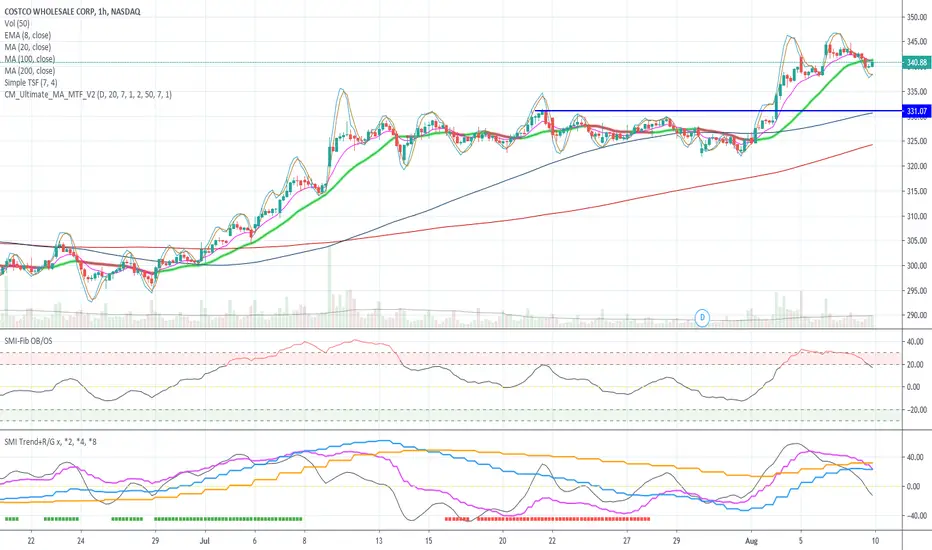
COST over-extended and weakening momentum (60-min chart)COST probably due for moderate pullback to 330-335 area.
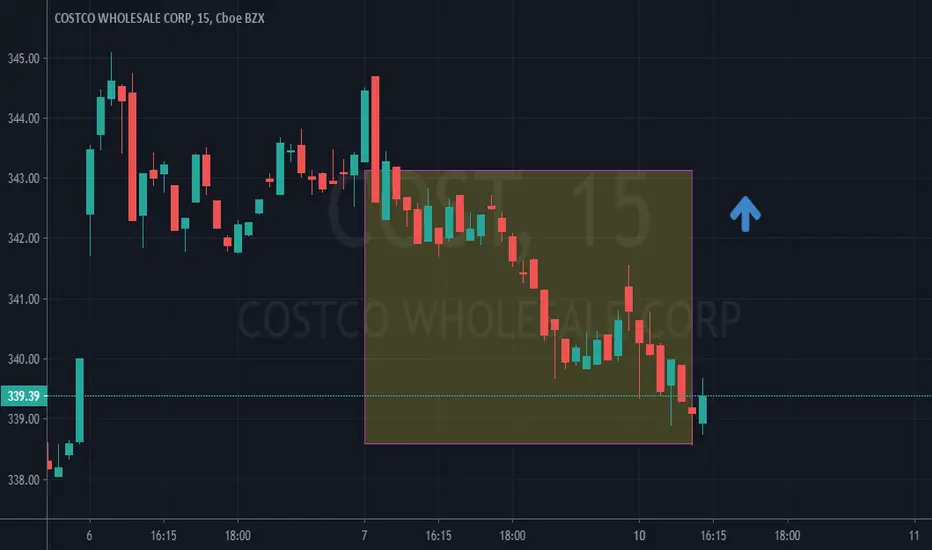
THE MARKET IS GOING UP AS I SAID ON THE 15MWe are taking a great BUY TRADE and it is still going up as the bulls have strongly decided to buy the market. Wait for my signal to exit with a great win!

Now a great buy opportunity on the 15MAs i said before, i waited for the formation of a gret configuration to confirm a buy signal on the 15M. Please go long now and waitt for my signal for the exit.

Get ready for a long position trade on the 15MAfter the bear taking the market down for a while, the bulls have finally decided to take the market up creating a great chance to go long. so get ready and wait for my signal!
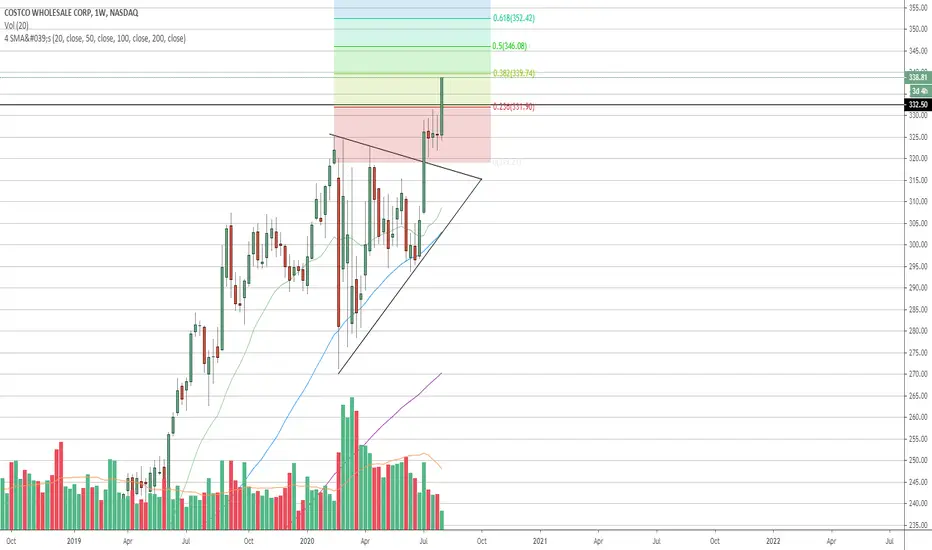

COST: Ascending triangleAscending Triangle
Pros
Descending volume
R/R ratio above 11
PPS above 50MA and 200MA
250RSI above 50
200MA ascending
Cons
ATR descending
If confirmed
PT1 = 377,54

