COST trade ideas


$cost oversoldOversold territory for a stock like Costco.
Another falling wedge.
Bullish divergence on RSI.
Increasing Volume.
Might see a dip to 291 first, but this will see ATH soon


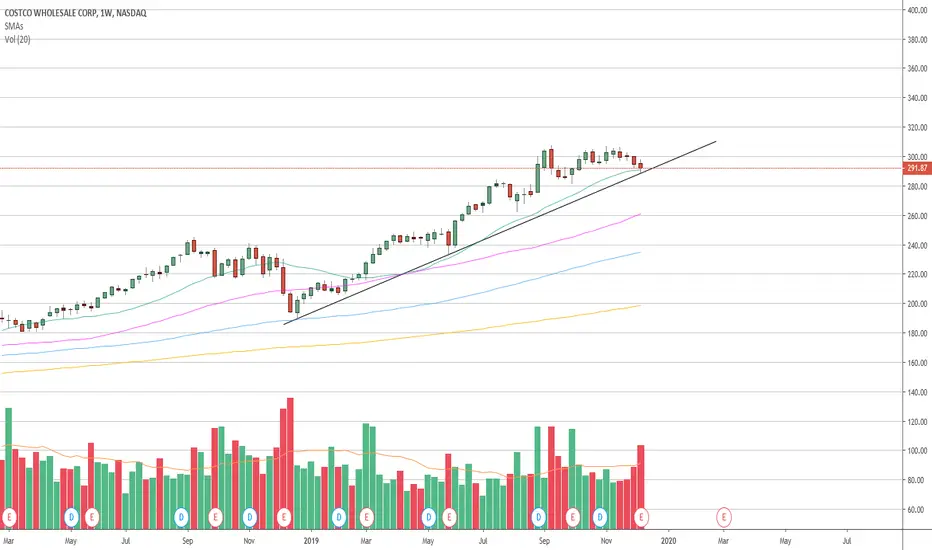
Weekly inside candle on 20smaIf this breaks over last weeks high, Im thinking it can make a new ATH. 305c for Jan 17 closed around 1.20, will try those. Puts under trendline.


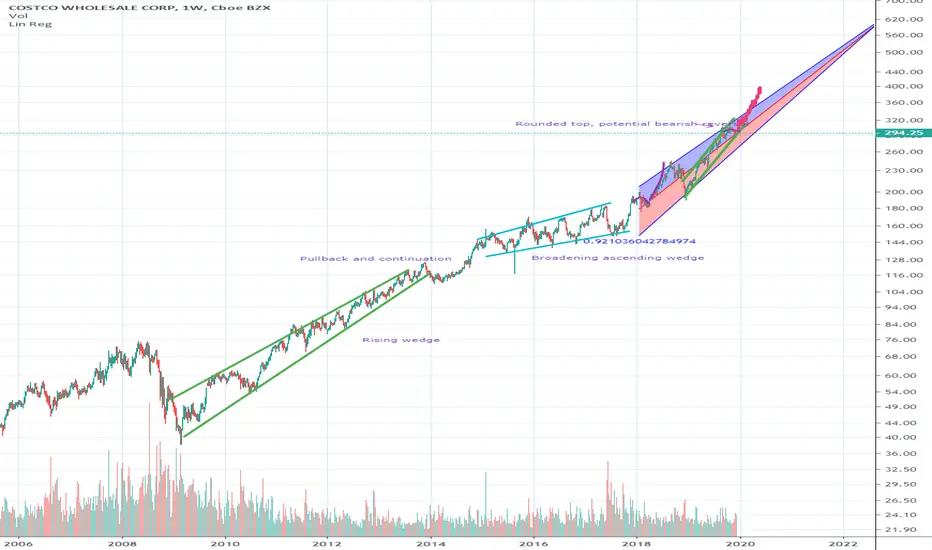
COST Regression analysisPresence of a rising wedge, broadening ascending wedge, Costco has been on a massive bull run. Rounded top also present which may be indicative of a bearish move, but with the strong rising channel and regression trend of 0.92 (strong regression trend according to Pearson's R value) the chart appears definitely more bullish rather than bearish.

$COST ~ COSTCO~ SHORT SETUP USING PUT SPREAD~ #OptionsTradingMETHOD: Short COSTCO {price at entry ~ 292} via:
+2 VERTICAL COST 100 (Weeklys) 27 DEC 19 300/292.5 PUT @5.00 ;
Trading @ low IV after the earnings dump;
Decay helps if price < 294;
Sold high extrinsic put to buy high intrinsic put
STRATEGIES: Using COST day chart:
The 20/50 Mean looks set to make a big pink cloud after a long chart runup.
The Fisher Transform line signaling a continuation short.
The last earnings bailing of stock price turned out to last a few days.
TACTICS: The plan in terms of stock price:
STOP is price > 295 (MUST OBEY, Upside down R:R trade)
TGT1 288 to scale; TGT2 286.25 to exit (NO EARLY EXIT, Upside down R:R trade)
Consider scaling as pink cloud becomes large
We may let the Fisher Transform and 20/50 mean together take us out technically for whatever we get win or lose.
Will update in comments,
B3
d^.^b


Similar to year ago, -15% during 2 weeksCOST seems parabolic now. Hard to believe repeating history but there are some similarities with 2018 december earnings. With negative surprise COST can drop 15% during 2 weeks. But good news that 250§per share is good entry point!

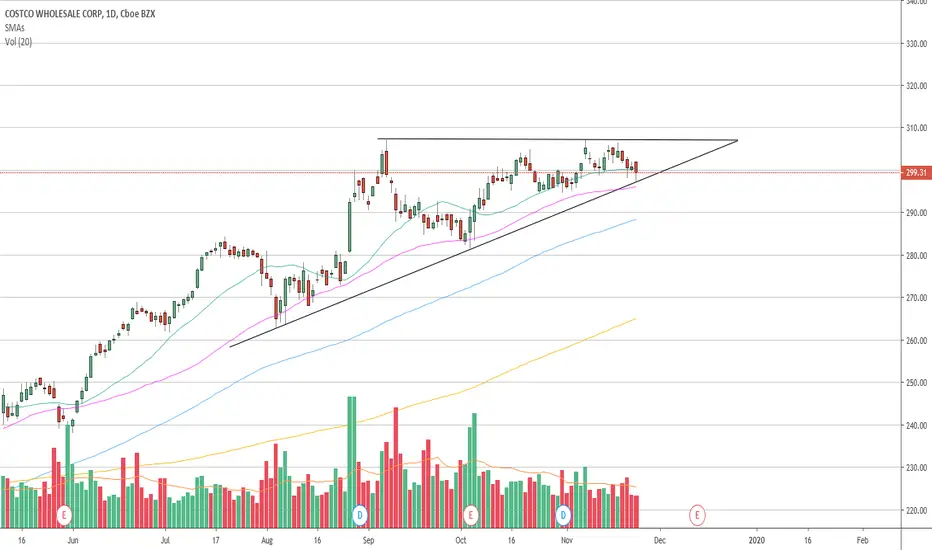
Where is COST headedSome have asked about shorting this one. For now its still and ascending triangle. You can either try calls off this support or wait to short on the bounce back up or at the trendline crack.
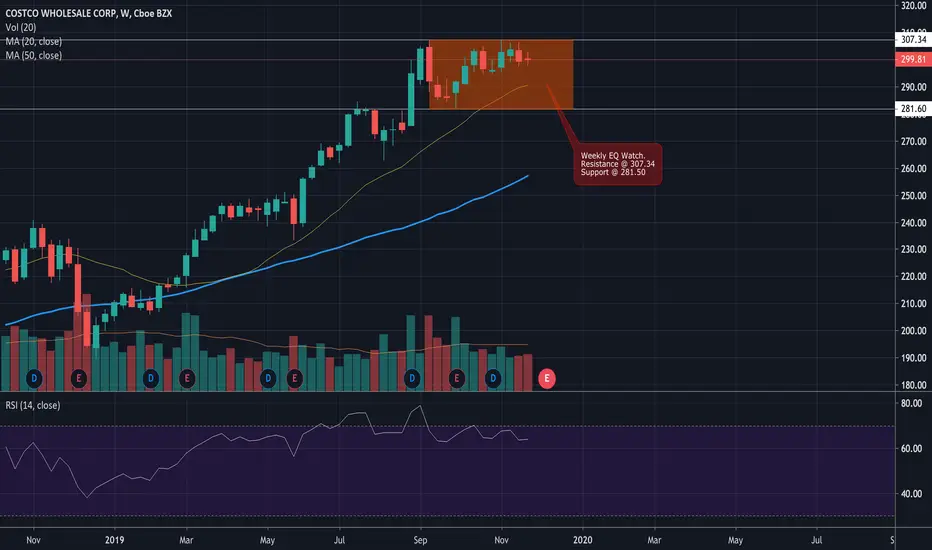
COST Weekly EQWeekly EQ on watch.
12/12/2019 is earnings and that could fuel the bulls or the bears to break this pattern.
$COST Looks Poised to Move Higher@Costco - rising trend channel support, ascending triangle support, already broke out & retested 161.8 Fib. I am still targeting $338. $COST
On a side note, still impossible for me to find parking at my Costco. Always packed.


$COST / CostcoI waiting for price to hit this trend line. Beautiful stock, $COST is one of my favorites to trade when it pulls back.


$COST coming to the end of a parabolic runIs this it for Costco? - consolidation for several weeks/months is what I'm expecting.

COST is tough to readIn one hand, its seems like its in an ascending wedge; accumulation is occurring more. However, a clear triple top can be seen, and bearish MACD divergence is clearly seen. 297 seems like a great value/low-risk area, but if a triple top is confirmed, we could see it dip to 270.
