COST long ideaI like COSTCO COST here. I see the 200ma on the 3hr chart as a nice support. Looks to be setting up for a new move higher. It's one you can buy and hold IF history is a lesson. 8/crossed the 13 on the 3 hr chart which looks like a buy. Good volume
COST trade ideas


Costco investors starting to ring the register. Caution. High flyer for 2019 NASDAQ:COST enters earnings tomorrows earnings pre-market, with huge expectations that it must fulfill considering the crowed trade that is has become.
The main danger for Costco is that if the market begins to rotate back towards the Technology sector, Costco will be a source of capital to do so.
If the selling persists post earnings a very healthy retrace tot he $230 level is more than possible.
Average analysts price target $293
Average analysts recommendation OVERWEIGHT
Short interest 1.07%
P/E ratio 34 (CONSIDERED HIGH IN RETAIL)
Company profile
Costco Wholesale Corp. engages in the operation of membership warehouses. Its product categories include groceries, candy, appliances, television and media, automotive supplies, tires, toys, hardware, sporting goods, jewelry, watches, cameras, books, housewares, apparel, health and beauty aids, tobacco, furniture, office supplies, and office equipment. It operates through the following segments: Unites States Operations, Canadian Operations, and Other International Operations. The company was founded by James D. Sinegal and Jeffrey H. Brotman in 1983 and is headquartered in Issaquah, WA.

Going long on $COST calls before earnings Costco recently introduced their stores over seas which has brought alot of attention to the company recently.

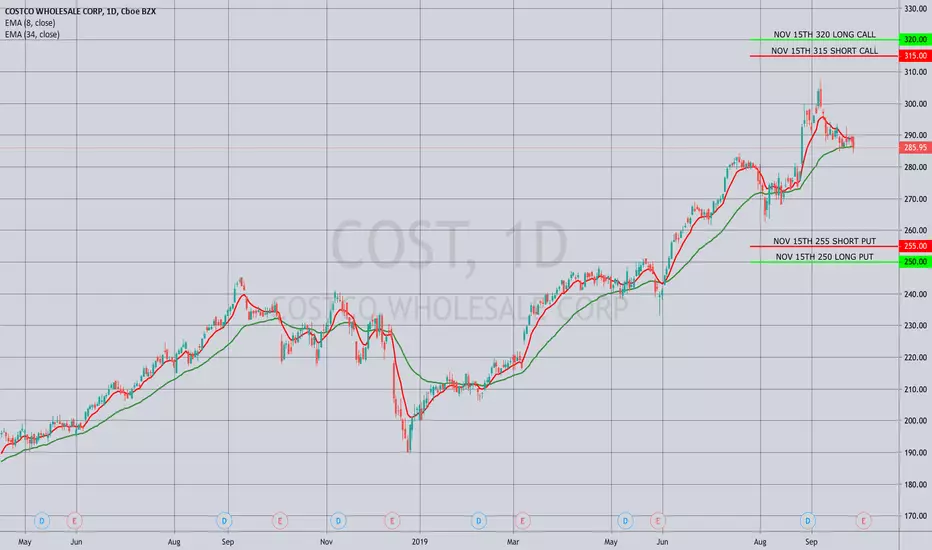
THE WEEK AHEAD: COST, GDXJ, IWM, CL1!EARNINGS:
COST (71/29) announces earnings this week, along with THO (89/66), PEP (32/21), and LEN (26/35).
Pictured here is a directionally neutral iron condor camped out around the 14 delta strikes for the shorties paying 1.04 (.52 at 50 max) with break evens at 253.96/316.04, which are slightly wide of one standard deviation. The correspondent short strangle at 215/315 pays 3.74, although you can certainly tighten that up to get a surgical 2x expected move setup at the 260/310, which is paying 5.15.
They're scheduled to announce on Thursday, October 3rd after market close, so look to put on a play in the waning hours of the New York session on Thursday.
Although THO has more ideal volatility metrics, you'll face problems there with 5-wides in the November cycle, and PEP metrics are too low for my tastes to bother with, with 30-day background at 21.
EXCHANGE-TRADED FUNDS
GDX (74/34)
SLV (73/27)
GDXJ (70/38)
GLD (61/15)
TLT (58/15)
XOP (44/41)
I don't know if there's every been a longer period of time in which precious metals have been at the top of the premium stack for such an extended period of time.
GDXJ has the most ideal metrics, with rank >50%, and implied >35%: the November 15th 34/43 delta neutral short strange with the short strikes at the 20 delta's paying 1.22 at the mid.
If you're tired of playing gold, consider a play in XOP: the November 15th 22/23* almost a short straddle short strangle, is paying 2.08.
* -- XOP finished Friday's trading session at 22.51, which is why I'd split the straddle a tad here in the absence of a directional assumption.
BROAD MARKET
Last week saw a bump in volatility, but it still isn't great short to medium term to sell premium in broad market exchange-traded funds.
Running the 10% short straddle test on the highest implied volatility broad market exchange-traded fund -- IWM, shows that you'd have to go all the way out to February (145 days 'til expiration) to get the at-the-money short straddle to pay greater than 10% of the value of the stock; the IWM February 21st 151 short straddle is paying 15.11 versus Friday's closing price of 151.16. Not everyone likes to go out that far out in time, since it takes longer for those types of plays to come in, but would consider something in that cycle if I don't want to play earnings, I have substantial buying power sitting idle, or I'm inclined to a slower, less attention-intensive type of trading.
The IWM February 21st 1 x 2 ratio'd 130/174 short strangle is paying 3.03/1.51 at 50% max, with 1x contracts at the 15 delta on the put side, 2x contracts at the 7 delta on the call side to accommodate skew, with the February 21st 120/130/2x172/2x175 "double double" paying 1.74. Setting up a double double in that expiry is a bit pesky at the moment, since the put side is limited to 5-wides.
FUTURES
/ZF (75/4)
/SI (73/25)
/6B (61/11)
/GC (61/14)
/UB (58/5)
/ZB (58/10)
/ZS (51/22)
/ZN (44/5)
/CL (37/40)
Friskiness in precious metals (/SI, /GC), friskiness in treasuries (/ZF, /UB, /ZB, /ZN), with some volatility left in beans (/ZS) and oil (/CL).
10% Short Straddle Tests:
/SI January 28th 17.5 short straddle: 1.93 versus 17.59.
/CL December 16th 56 short straddle: 7.10 versus 56.18.
I've got /CL setups on in both the November and December cycles, but this implies that it may not be worth initiating premium selling in /CL in the November cycle.
Honorable Mention: /NG (25/44). I pulled the trigger on a UNG play at seasonal lows, after which /NG popped temporarily. It has receded back from mid-September highs around 2.70 and closed Friday around 2.40. Ideally, I'd want in at 2016 lows (<1.75), but that may be asking for a bit much ... .
VIX/VIX DERIVATIVES
VIX ended the week above 17. While an exciting development for short volatility traders, I would keep my pistol in my holster for the time being, waiting for VIX pops to greater than 20 to start legging into bearish assumption positions in either the VIX itself or derivative products like VXX or UVXY.

Costco Long - trend tunnel low pointTaking Costco to the long side. Got to know about the downgrade from Cramer's Mad Money, so thought to do technical analysis.
Cramer suggested buy at this level and technicals are supporting partially.
I prefer to see divergence in RSI but thats not there. So taking this trade by giving more weightage to fundamentals shared by analysts as Costco is least affected by Trade war of all retailers and usually in economic slowdown Costco do well good.
MACD is crossing above red
Target price is 300
Entry price is 288
Risk:Reward is 1:2


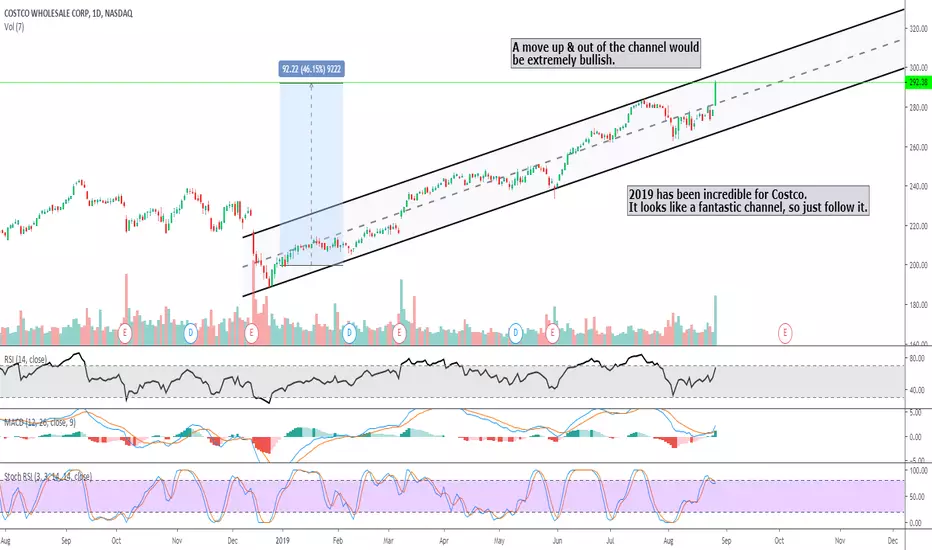
Close Up Of Previous Idea and LevelsCOST Ideas are attached, had opportunities to get in and ride this ride on up while everyone else thought it had ran too far too fast. Now sitting at an inner resistance area of its lifetime channel. Break above and hold here then opens up 370's-380's next, knocking on the door of 400. Make sure you look at this chart through the correct lens, and don't just take anyone's word for it that its "overbought" or "exhausted" or "parabolic" and has to come down. It isn't and it doesn't. Congrats if you've been in here a while, or if you bought just a few weeks ago. For now just watch price action around this trend line, and trade accordingly. Happy hunting and GLTA!!

Like I Said, Think Again...As mentioned in previous idea about COST (linked) if you think this has run too far too fast, think again. As mentioned then, the critical level is this inner resistance near 300, which if broken can open the floodgates for COST. If it closes 305 convincingly, this thing can feasibly hit 400 without much trouble. Just because a chart looks straight up in "Auto" charting mode doesn't mean it's overextended. Take another look from the right perspective and things become much clearer. Congrats if you bought then. Happy hunting and GLTA!!

COSTCO hits all time high again.Just like they Big Tech Companies Costco was quick to harness the power of a subscription based business, membership is cheap but the recurring income adds greatly to the bottom line.
As of today Costco opened its first store in China and such was the popularity it had to temporarily close due to overcrowding concerns, a fantastic problem to have.
Costco is somewhat resilient to recession, the demand for bulk value grocery increases as times get tough.

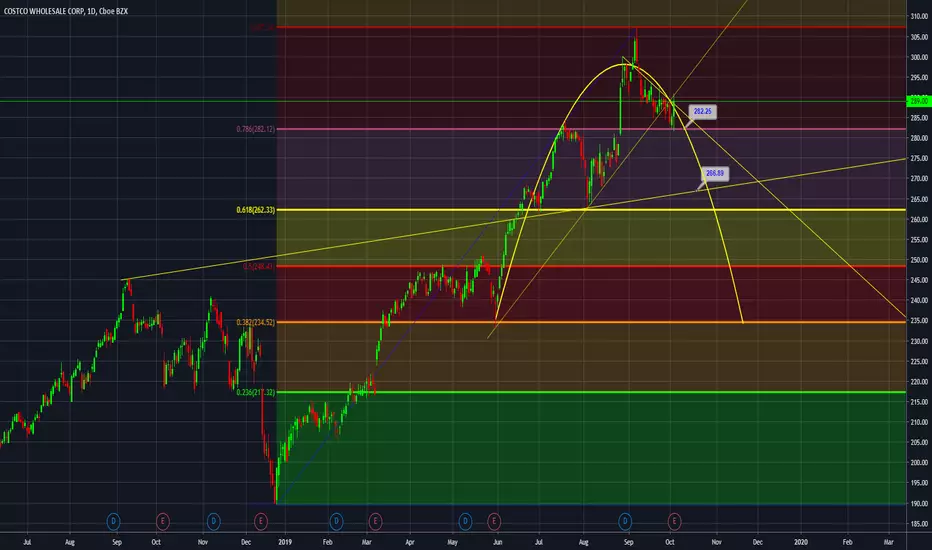
Costco retracement and bounceLooks like it retraced a small amount and will continue to bounce upward towards original Fib price target $289. RSI had sharp downward adjustment and has room to increase along with MACD. Looks setup to at least retest previous highs as resistance and go towards $289.


I guess we'll go down for today on $COSTI guess we'll go down for today on $COST to 278 at least to make more support to run up again

Think $COST has run too far? Think again...NASDAQ:COST It really pays to understand the "log" button on your chart and when to use it. Because looking at COST monthly chart in this way shows a very clearly defined channel and midpoint line. So, instead of looking like an unchartable stock that looks as if it has to be out of gas, it becomes much clearer that in fact, it could have much further to go. This is further evidenced by the Stochastic Indicator, which is nowhere near a point of exhaustion. So COST will likely rise up to the 297-300 mark which is resistance in this smaller, inner channel currently being ridden. Then comes the decision point, and if COST is able to break past 300 convincingly, it is very possible--even likely--that it could be sitting 370-380 by the end of 2019 without too much fuss. Beautiful, strong chart here. Below is an example of what this exact same chart and trend lines look like if you keep the monthly chart in linear mode. Good luck charting that thing. Happy hunting, hope we all make it out alive!!

Congrats to Subscribers: Costco Up Over 26% After Alert!It is very easy to read price action if you have a reference point. These support/resistance lines are there to help you read where the buyers and sellers are likely to make a stand.
MasterChartsTrading Price Action Indicators show good price levels to enter or exit a trade.
The Blue indicator line serves as a Bullish Trend setter.
If your instrument closes above the Blue line, we think about going Long (buying).
For commodities and Forex, when your trading instrument closes below the Red line, we think about Shorting (selling).
For Stocks, I prefer to use the Yellow line as my Bearish Trend setter (on Daily charts ).
Be sure to hit that Follow button! Please find me on social networks via the link on my profile page for more ideas from MasterCharts!

COST: All indicators are goThis is at all time high and 288 is what I see can happen in a month or two. Sales numbers are due tomorrow and Amazon Prime day is coming too. Let's see. Look at ADX...big time bullish
Added a good size call (Aug 23rd).

Cost overbought?Ok I don't know but Cost is up so much recently and its so overvalue
Do you think it is going back to the trend line?
Tell me in the comment xd

COSTCOAll time highs have been broken, MN & WK is trending up. We have 2 nested demand zones on daily for longs 1 at trend line break and 1 at the extreme.

