COSTCO... another Amazon's victim? Last reporting data was ok, net sales for the quarter increased 10.8 percent, to $32.28 billion from $29.13 billion last year. Net sales for the first 24 weeks of fiscal 2018 increased 12.0 percent, to $63.40 billion from $56.60 billion last year.
The Company gained an incremental sales day in the quarter due to the shift of Thanksgiving, however pre-Thanksgiving and Black Friday holiday weekend sales fell in the first quarter this year, versus the second quarter last year. This negatively impacted this year’s second quarter sales by approximately 1.4% in the U.S., and slightly less worldwide and negatively impacted E-commerce sales by approximately 7-8%.
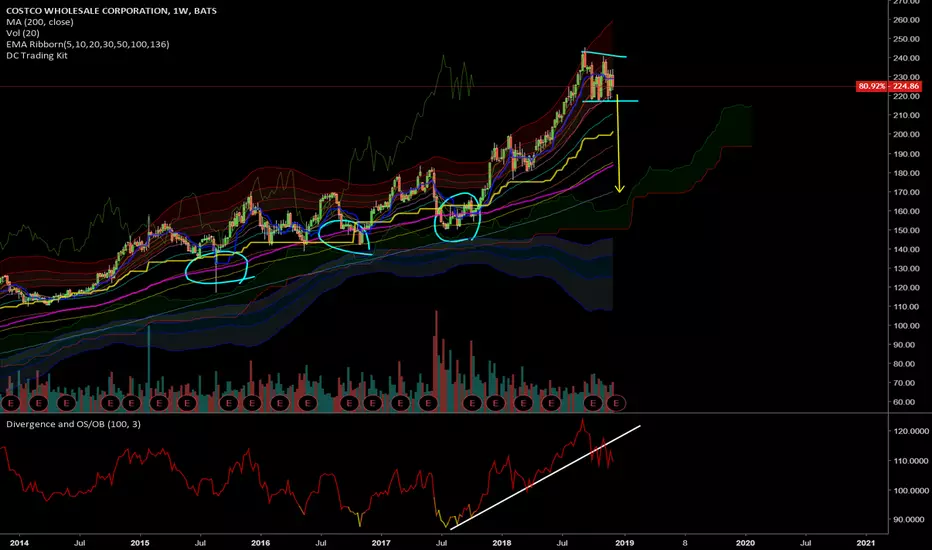
However, my expectation for COST is around $220.00, even after rose $170 per share at the end of 2018.
Have a Good Trading Week,
Learn how to beat the market as Professional Trader with an ex-insider!
Cream Live Trading, Best Regards!
COST trade ideas

COST Inverted H&SNot real bullish on Costco, but charts don't lie. Inverted H&S like the rest of retail (see XRT).
Long on calls for a day.

COST long on the 15 minute scale reverse H&S shoulder. expect the stock to close the gap on the left side of the chart. that being said, do not stay to long.

Costco 12 RRR shortTrading Methodology:
1. An asymmetric bullish/bearish pennant is drawn using ascending and descending curved trend lines with a minimum of three price action touche points per line. The direction is determined by the previous trend.
2. The angle tool is applied from the earliest two trend touch points, beginning at the earliest touch point.
3. A trend-based Fibonacci retracement triangle is drawn starting from the earliest trend touch point and ending at the earliest touch point of the opposite trend line .
4. Based on the degree, of the earlier defined angle, the appropriate (and secret) levels are selected for the fibonacci retracement ; two levels for stop-loss and two levels for take-profit. The closest stop-loss level to the current price level is the top priority stop-loss. Though the secondary stop-loss level is often chosen for some markets such as FX and some equities in order to account for seldom unexpected resistance breaks. The greater target level is the top priority, and where majority of the shares are sold, though some may choose to close part of the position at the first target level or set it to be the stop-loss once price exceeds it. Entries should be laddered in around the levels closest of the yellow line.
This trading strategy can be applied to any market and time frame, and positions most often garner the greatest risk-to-reward ratio with the highest success rate. What more can you ask for? I will only be posting my unique trading strategy until EOY. I work solely with price action to identify pennants and apply unique trend-based fibonacci retracement levels for SL and TP levels. Reach out to me if you have any questions.

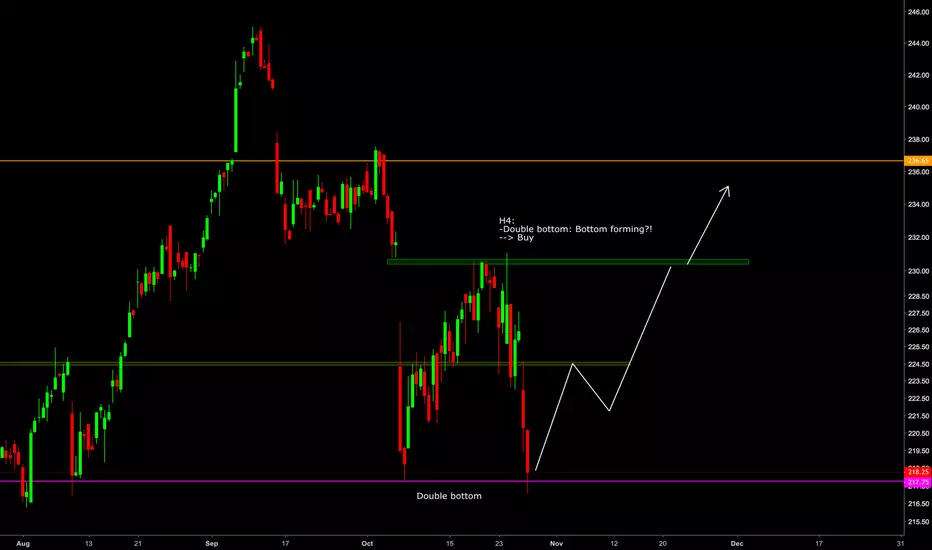
$COST Costco at Key Support Level$COST Costco tagging key $200 support level today looking very oversold. Expecting a price recovery into the 1st quarter of 2019. Note there is an un-filled gap below $200 from June of this year - could see us dipping as low as $198 this week. A close this week below $198 would be bearish - ideally we stay above $200.
Targeting mid-December overhead gap-fill of ~$226.50 by mid to late February leading up to March earnings release.
Note: Informational analysis, not investment advice.

COST OverpricedSurprised that COST hasn't fallen farther AH, revenue growth is nice but gross income actually went down Y/Y. Net income increase is strictly from the tax cut and one time events.
31x P/E
1% dividend
When the recession hits, this will get cut in half easily. P/E ratio is way too high, dividend yield too low.
No active position yet, let's see where it opens tomorrow. Holding XRT puts though, expect a retail reaction to Costco earnings, we'll find out tomorrow morning.

Short COST (Ready to get "Targeted"?)Weekly indicator trendline support broke, divergence, will drop on ER big move.
TP at least 183
COST: Sell Short Potential but Strong Support at 200The Daily Chart of COSTCO Stock shows that there is some sell short potential on the short-term trend IF the stock breaks to the downside below the low of around 216. At this time, it appears that is more likely given the lack of large lot buyers in the chart patterns. Support levels show the point gain potential moving down from the current range-bound pattern.
However, COST is less likely to collapse all the way down to 50% from its all-time high. Why? Because it was never speculated to extreme highs, far from a strong support level. The furthest it can go before reaching strong support is around 200 for a bounce and 190 for serious support and risk of rebound price action.

COST - Costco Stock SpeculationHere we have Costco stock charts. Bigger picture is suggesting we are bearish with more room to the downside. As we move to the lower time frames we can see were approaching fresh supply. I will look for an entry into the bearish move here.
*
*
*
Like and follow!

$COST - Lol. Dopest thing you'll read A while back, I remember wanting to get into algorithmic trading. I love math & all, but once one thing led to another & eventually I found myself trying to understand mechanics & quantum physics & computer learning - there was no way lmao. I tried, & it ultimately did help come up with my own strategy that I've gotten accustomed to. But since then, the most helpful & my favorite recollection of all things math & stocks is the bubble report. Chances are if you've seen bitcoin - you could tell it was a bubble, but probably didn't know when it'd pop, how long it'd take to recover (if ever), & where the top of it would be. Whether it's stocks, forex, bitcoin, commodities, etc., a bubble is a bubble. The best way (might be the only.?) to describe a 'bubble' is when exponential growth exceeds linear growth; historical growth (x) surpasses the equilibrium rate of growth (y) over time, & instead of a linear graph - you need a logarithmic graph just to make fit. A new bubble report is released each month & I remember seeing Costco on it w/ a 98% "bubble" score. Kept it on watch, but seeing as implied volatility is in it's top 25 percentile - better late than never lmao. I made this layout back during my experimenting on producing actual results to use moving averages as a "bubble" finder - bitcoin was my original start & I saved it since then. Although you can only see one (red) moving average, there's two. The 2nd is a weighted moving average for a half a year longer, while the red is a shorter, exponential moving average based off lows. I made the 2nd the same color as the background w/ thicker width that way whenever the (red) crosses over it - both moving averages disappear in an indication of faster exponential growth without an equilibrium. Although you can't see the 2nd moving average - click on any one of the yellow rectangles & you'll get an idea. I was supposed to make a comment about how this chart reminds me of Venezuela's inflation rate but, yeah. Better late than never. If you wana check out that bubble report,
Link - www.ethz.ch

COST holding above 100dmaCOST has been impressive in performance for 2018. it is showing relative strength in a weak tape. This another long-term dividend grower.
Disclosure: long COST

[COST] It's starting phase 3Despite the price is over the 30MM, I think it's starting a phase 3. RSI is going down and the strong fall 3 weeks ago is felt.

COST is a BuyCostco is undervalued and oversold at the moment. Hanging on the bottom bollinger band. look for a 235 price target

$COSTDone or just getting started?
A few outcome potentials.
Fractal has been full of consecutive extensions, are we ending Primary extended Wave 5, and retracing, or starting a terminal extended wave? or should I just go back to bed

Costco long when stochastic confirmsLooking at stochastic, Costco is out of overbought area. When stoch will turn up, then it is moment to buy

COST: High Risk for Long Term BuyConsidering your risk is something that all investors and traders should do before trading or investing in any stock. Often when a stock displays this much risk on the long- and intermediate-term time frames, it also warns of risk for short-term trading as well. The Weekly Chart provides better perspective of the risk of buying the stock at this new all-time high price. There is no support nearby. See how many points are at risk if a correction occurs?
Trade Wisely,
Martha Stokes, CMT

$COST very likely to rise 10/3$COST 5 sma crossed up 10 sma on daily, about to also cross up 20 sma 236.45 on daily.
MACD, Stoch and RSI all pointing upward /crossed.
Overall trend is up. Recent consolidation on both daily and weekly look great.
Let us see.


COST Long - Low RSI - Gap FillCOST is poised to bound off trend support and refill it's previous gap-down.

Costco Possible Target at 280There is a Fibonacci cluster at 280. Also resistance at 50 for RSI in the bull market suggest there will be another all time high coming


COST one of the man chart that hit it's expected moveBack to earth COST goes. Be careful holding stocks that hit their expected move. This market isn't that strong right now. Some more down side but hard to say how much.
