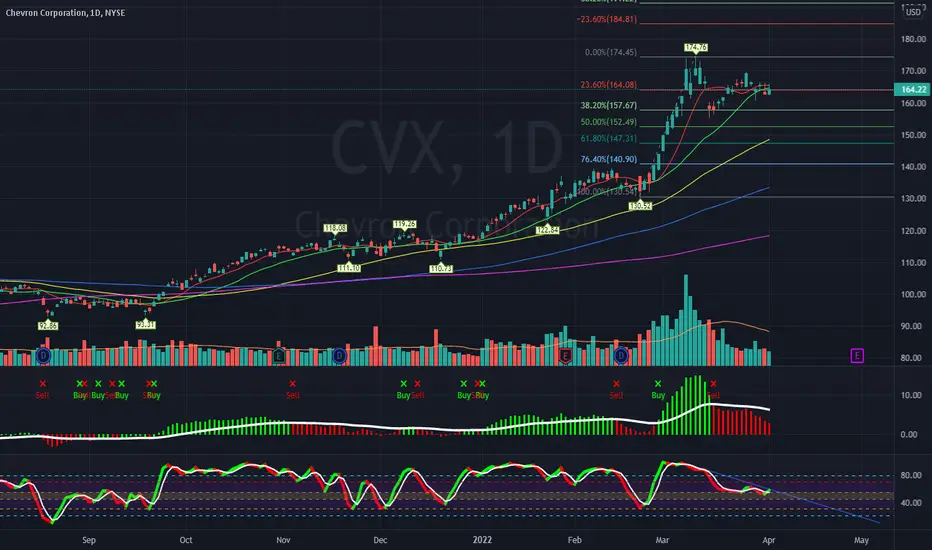
$CVX Bull Pennant?$CVX seems to have a nice pattern here. Looks like it got ahead of it's self on that last major upside move but, has now slowed and putting in a pennant base. I'll be looking to go long on ANY high volume up day from here. Today? TBD. Ideas, not investing / trading advice.
CVX trade ideas

$CVX GET READY FOR TAKE OFF!!!! BreakOut Bull Flag?
Is Chevron (CVX) a Solid Growth Stock? 3 Reasons to Think " Yes "
Zacks Equity Research April 13, 2022
CVX
Trades from $1
Hide Full Article
Growth stocks are attractive to many investors, as above-average financial growth helps these stocks easily grab the market's attention and produce exceptional returns. But finding a growth stock that can live up to its true potential can be a tough task.
In addition to volatility, these stocks carry above-average risk by their very nature. Also, one could end up losing from a stock whose growth story is actually over or nearing its end.
However, the task of finding cutting-edge growth stocks is made easy with the help of the Zacks Growth Style Score (part of the Zacks Style Scores system), which looks beyond the traditional growth attributes to analyze a company's real growth prospects.
Chevron (
CVX - Free Report) is on the list of such stocks currently recommended by our proprietary system. In addition to a favorable Growth Score, it carries a top Zacks Rank.
Studies have shown that stocks with the best growth features consistently outperform the market. And for stocks that have a combination of a Growth Score of A or B and a Zacks Rank #1 (Strong Buy) or 2 (Buy), returns are even better.
Here are three of the most important factors that make the stock of this oil company a great growth pick right now.
Earnings Growth
Arguably nothing is more important than earnings growth, as surging profit levels is what most investors are after. And for growth investors, double-digit earnings growth is definitely preferable, and often an indication of strong prospects (and stock price gains) for the company under consideration.
While the historical EPS growth rate for Chevron is 2.7%, investors should actually focus on the projected growth. The company's EPS is expected to grow 82.5% this year, crushing the industry average, which calls for EPS growth of 71.7%.
Cash Flow Growth
Cash is the lifeblood of any business, but higher-than-average cash flow growth is more beneficial and important for growth-oriented companies than for mature companies. That's because, high cash accumulation enables these companies to undertake new projects without raising expensive outside funds.
Right now, year-over-year cash flow growth for Chevron is 75.2%, which is higher than many of its peers. In fact, the rate compares to the industry average of 47.7%.
While investors should actually consider the current cash flow growth, it's worth taking a look at the historical rate too for putting the current reading into proper perspective. The company's annualized cash flow growth rate has been 9.5% over the past 3-5 years versus the industry average of 7.9%.
Promising Earnings Estimate Revisions
Superiority of a stock in terms of the metrics outlined above can be further validated by looking at the trend in earnings estimate revisions. A positive trend is of course favorable here. Empirical research shows that there is a strong correlation between trends in earnings estimate revisions and near-term stock price movements.
There have been upward revisions in current-year earnings estimates for Chevron. The Zacks Consensus Estimate for the current year has surged 15.9% over the past month.
Bottom Line
Chevron has not only earned a Growth Score of A based on a number of factors, including the ones discussed above, but it also carries a Zacks Rank #2 because of the positive earnings estimate revisions.
You can see the complete list of today's Zacks #1 Rank (Strong Buy) stocks here.
This combination positions Chevron well for outperformance, so growth investors may want to bet on it.


CVV - pennant-like pattern CVV shows a very clear pennant-like pattern where the first target price is 206 USD which gives 21% profit.
OBV is positive, Stochastic does not show over bought.
TradingView Technicals and Analyst show Buy.

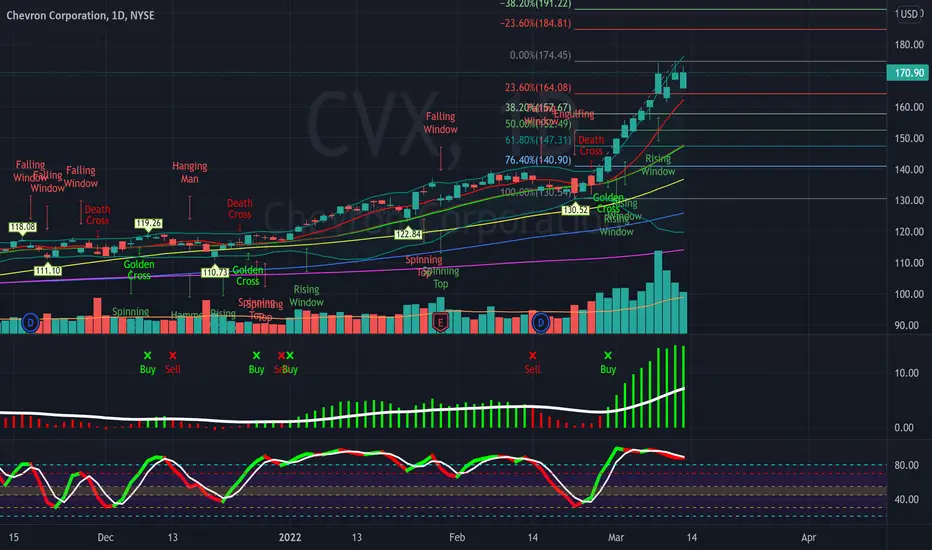
CVX breaking out After days of tight price action, CVX finally breaking upwards to ATH. Watching cross of 175 with relative volume to see if rally can continue. Keep in mind, we are getting closer to travel season (summer) where demand for gas will be at its highest. CVX can keep staging massive strength rallies.


CVX Found its ResistanceAs the government is opening its oil reserve to bring the oil price down. CVX tries to break the $175 level which was not possible last week and we might see a pullback to around the $150 level.
cvx/tsla and tsla/spxLooking at oil v tsla and tsla v spx
Just an observation, CVX/TLSA (top) had a double bottom at .10 - during this time, tsla made new highs relative to SPX(bottom)
Interestingly tslaspx is headed towards new highs it looks like while CVX/TSLA is hovering around 0.15
The fact TSLA was 9% higher due to a stock split is laughable, and shows just how absurd these markets are.
I think the trend of CVX/TSLA is just getting started...from a longterm perspective it really cant get much more exhausted and finally people are waking up to how important oil still is in context of global energy.


CVX Found its ResistanceOn daily charts, CVX found its resistance around $170, and volume is decreasing. So we could see stock price will pull down around $140.
GO DOWNLooks to be exhausted, if nothing beyond the chart keeps pumping she will see a downwards trend at the break of the pennant.

Chevron Co-corporation Bullish trendChevron cooperation is in a Bullish trend naturally because of the rising energy prices. You can take an immediate short term profit to break even and hold the remaining till the trend reverses.

CVX IDEA - Entertainment onlyRetrace of pump (61%), gap filled at 162, and return to the lower of the upper trend line. ENTERTAINMENT ONLY. Potential gain 6.2%
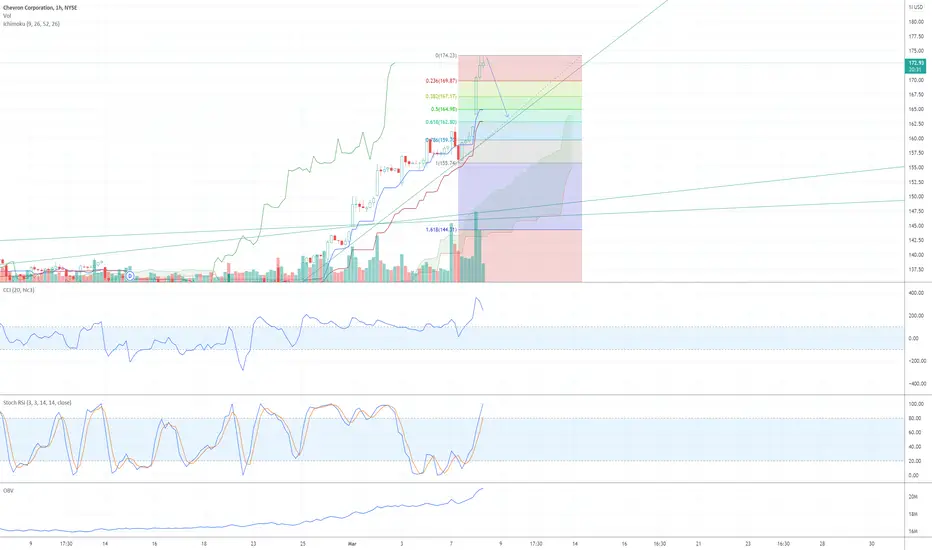
Chevron CVX BullishI bought Call Options in Chevron (CVX). Yellow line marks stock price at time of position entry. No estimated Resistance price or area target.
I am not certified or licensed by any individual, institution, or corporation to give financial or investment advice.

$CVX with a Neutral outlook following its earnings #Stocks The PEAD projected a Neutral outlook for $CVX after a Negative over reaction following its earnings release placing the stock in drift C with an expected accuracy of 33.33%.
A midterm trade with 30% opportunity..!Entry: at the market opening price
Stop loss: 10%
Reward/Risk: 3
Target range: 30%
Time Frame: 4-12 wks
Possible gain: 30%
Possible loss:10 %
Position size: 5% of trading capital
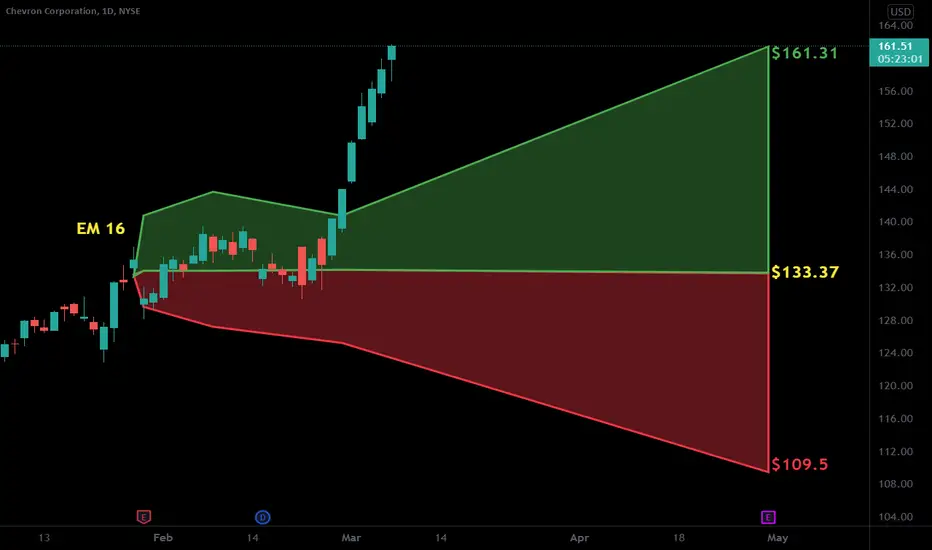
You can see the most important support(green line) and resistance (red line) levels.
Best,
Dr. Moshkelgosha M.D
DISCLAIMER
I’m not a certified financial planner/advisor, a certified financial analyst, an economist, a CPA, an accountant, or a lawyer. I’m not a finance professional through formal education. The contents on this site are for informational purposes only and do not constitute financial, accounting, or legal advice. I can’t promise that the information shared on my posts is appropriate for you or anyone else. By using this site, you agree to hold me harmless from any ramifications, financial or otherwise, that occur to you as a result of acting on information found on this site.

CVXStrong positive trend of oil giant. Index = +2740, Share of portfilio = 16,9%, Stopp Loss = 133,4


We nailed the Chevron long trade....Now we'll be shopping for the reversal (See prior trade below) Keep in mind, we're Neutral right now....nothing to see here....... Yet.
Also, pay attention to the DXY.

CVX/AAPLMarket leader of old and one of the leaders this year in $CVX - this shows the ratio of CVX/AAPL - I put a rectangle around some candles I found interesting.
- pink circle shows the breakout
-blue arrows shows the RSI trend
CVX right now is trading at a multi-year high, I don't know how much higher it can go - what I do know, is every chart I am looking at on Oil on a multi-year level is screaming buy

Chevron USA Sun Storm Investment Trading Desk & NexGen Wealth Management Service Present's: SSITD & NexGen Portfolio of the Week Series
Focus: Worldwide
By Sun Storm Investment Research & NexGen Wealth Management Service
A Profit & Solutions Strategy & Research
Trading | Investment | Stocks | ETF | Mutual Funds | Crypto | Bonds | Options | Dividend | Futures |
USA | Canada | UK | Germany | France | Italy | Rest of Europe | Mexico | India
Disclaimer: Sun Storm Investment and NexGen are not registered financial advisors, so please do your own research before trading & investing anything. This is information is for only research purposes not for actual trading & investing decision.
#debadipb #profitsolutions

CVX - Entering resistance zoneEVERYONE including me are bullish with Oil sector but I think the sector is facing a significant resistance zone ahead and I am locking in my profit.

CVX - Breakout on all timeframesChart shows upside range of 100% from here.
Everything is bullish here...clearly defined stop loss to manage the risk...textbook stuff.
