Head & Shoulders in Chevron - Sell1. After a rally, Chevron completed a figure wich I find like a head & shoulders pattern. Two lower highs after the high of the head.
2. Oil is in a strong downtrend.
So I expect $CVX to go down in the next days.
Enter tomorrow at market.
Target: 164.50
SL: problem, too far. Maybe, put it slightly above the neckline at 176.00.
CVX trade ideas

CVX dropSince I sold this counter, the share price drops a lot.
I am still monitor it, but the indicator show it still far away from support level, and another indicator Fortune Crown shows the weekly chart start to drop, so it is not recommend to buy.

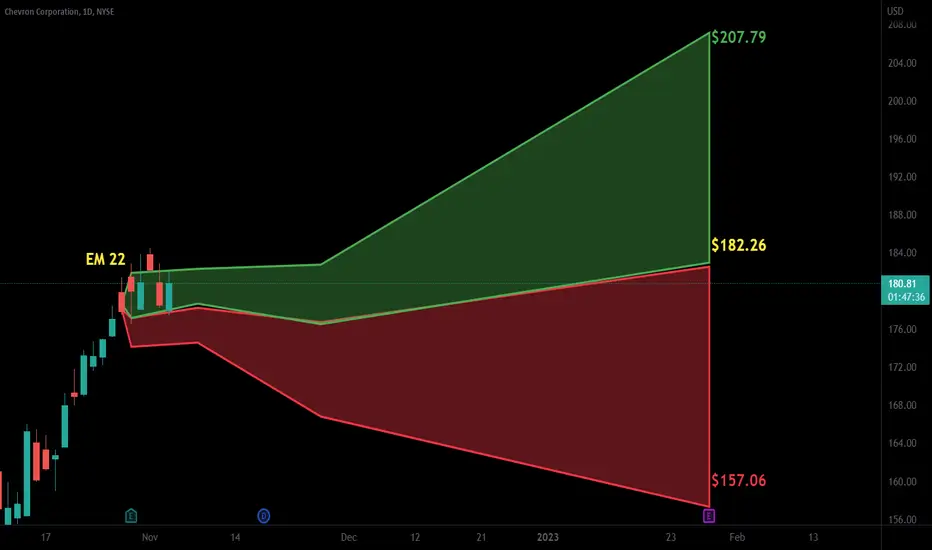
Chevron - Oil decreasing & CVX rising?Dear all,
this Chart tries to show the interaction between Oil Price WTI & Chevron.
As you all know, Mr. Warren Buffett invested lot of money during last two years in this company.
As you also know, CVX sells also gaz, not only oil, and for shure - gaz still very high, but NOT on Top.
CVX only is near to top.
Then: Look at the indicators. Negative Divergence all over all, OBV not amazing(bad).
So, several reasons for one conclusion.
In my option CVX is overvalued by 25% during the next monthes
let me know YOUR opinion!
Regards, Dan 19.11.22

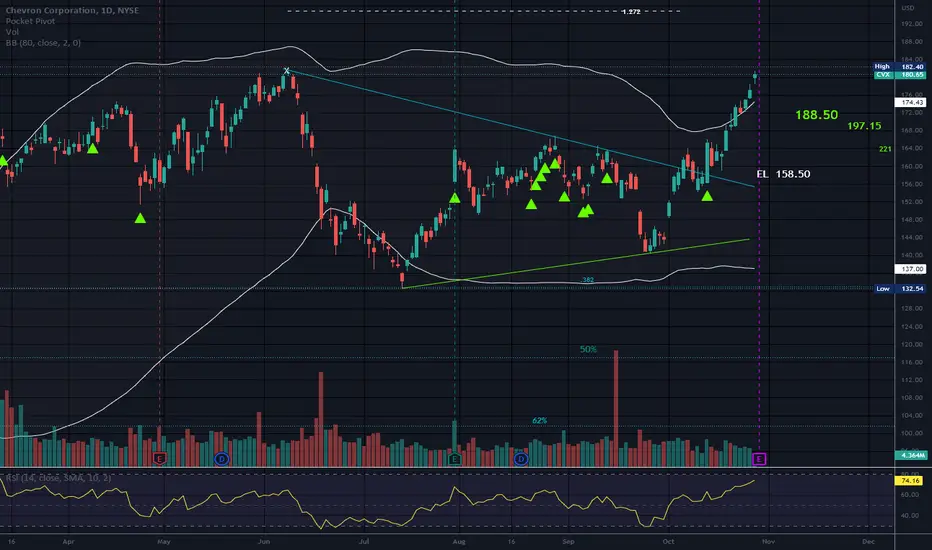
Symmetrical TrianglePrice has broken up from a triangle.
Price is above the bands.
74ish on RSI. Some use 70 as an Overbought signal on RSI. When a security is super bullish, some use 80.
Earnings tomorrow BMO
No recommendation.
Possible pull back soon if profit taking kicks in.
Security is borderline overbought going in to earnings.
Candle of indecision so far today.
Wyckoff Market Structure This signal is called Up thrust After Distribution which indicate the end of the up trend and strong signal of down trend!!! don't miss out this signal

Chevron Corporation
Small trade within Parallel Channel (Consolidation)
Trade with Stop Loss Until Channel top
Further Entry can be taken after Parallel Channel Breakout


CVX - Short term support and resistance1. Fortune_TD, Fortune Banker trend, Fortune Crown stage:
28 Sep 2022, Fortune TD 9 and Force 9 show the trend exhaustion range, the green bar on the previous day shows this is a potential share pull back. .
03 Oct 2022, Fortune Crown red dot reverse from bottom
03 Oct 2022, Fortune Banker trend, green line shows the banker chips flow in from 26 Sep 2022, then short money cross its 5 days average on 03 Oct 2022, potentially a reversal at the bottom.
2. Support and resistance:
the support is the lower price of share pull back signal (green bar), at 140.46.
The 1st resistance is the gap down on 10 Jun 2022, at 173.65.
4. Summary:
Based on above analysis, if the share price hit the resistance 173, and the buy point is 152, short term profit is approximate 11%. If there is no sell signal at the resistance level , then it will develop into main wave.
Disclaimer : no recommendation of buy/sell, purely for TA learning and sharing.


HD shortHome Depot closed between EMA's this week. After strong earnings they can not perform upside. I think it could be related with IV. for that reason HD need to consolidation. I think we could test november low's

Chevron Redux - Price Line Test AheadChevron MONTHLY Linear Scale
This 30 year price line has been breached 4 times since it's origin in 1992. Each time there has been a subsequent sharp reversal greater than 40%.
Earlier this summer there was a breach that resulted in a sharp and dramatic sell off. Thatwas a fantastic no brainer trade.
As you can see we are approaching this level again.
Short Set-up.....Wait for confirmation. I can't imagine it will be as straight forward as it was in June.
Will this pattern repeat... Does it pierce the line again or fail below it? Or..."Is it different this time"

CVX ShortCVX Long🚀📊
It is not financial advice. This is my opinion. Please check yourselves and invest in the symbols that you think have a huge potential to reach the best results.
Please leave us your opinion and reviews.🙏

CVX Simple Chart AnalysisCVX. New high after a positive QR was reported. Next potential resistance area will be at 201 area. Those red line are my support area.

$CVX with a Bullish outlook following its earnings #Stocks The PEAD projected a Bullish outlook for $CVX after a Positive over reaction following its earnings release placing the stock in drift B with an expected accuracy of 60%.
CVX - Uptrend - DailyCVX has crossed its recent resistance, also making HH and HL on the daily timeframe. Long trades can be taken in near future.

LNG Is needed in EU after pipeline sabotage Chevron's fleet of specialized ships link worldwide LNG production and regasification facilities.
Germany.....

CVX shows bullish hammer under MA 100 on dailyShorted after a nice bearish hammer at high.
Needed to move my stop closer since got bullish hammer after clearing MA 100 which is concerning.
A lot of room to go down but have to mitigate my risks. Ready to renter if stopped out after downward movement resumes.

CVX: Crude Oil blues?Chevron Corporation
Short Term - We look to Sell at 162.55 (stop at 167.91)
Our outlook is bearish. The trend of lower highs is located at 166.80. A firmer opening is expected to challenge bearish resolve. Preferred trade is to sell into rallies. Further downside is expected.
Our profit targets will be 148.94 and 144.00
Resistance: 165.00 / 182.00 / 200.00
Support: 148.50 / 134.00 / 111.00
Please be advised that the information presented on TradingView is provided to Vantage (‘Vantage Global Limited’, ‘we’) by a third-party provider (‘Signal Centre’) . Please be reminded that you are solely responsible for the trading decisions on your account. There is a very high degree of risk involved in trading. Any information and/or content is intended entirely for research, educational and informational purposes only and does not constitute investment or consultation advice or investment strategy. The information is not tailored to the investment needs of any specific person and therefore does not involve a consideration of any of the investment objectives, financial situation or needs of any viewer that may receive it. Kindly also note that past performance is not a reliable indicator of future results. Actual results may differ materially from those anticipated in forward-looking or past performance statements. We assume no liability as to the accuracy or completeness of any of the information and/or content provided herein and the Company cannot be held responsible for any omission, mistake nor for any loss or damage including without limitation to any loss of profit which may arise from reliance on any information supplied by Signal Centre.


Chevron USA SSI Live Trading Series
Sun Storm Investment Trading Desk & NexGen Wealth Management Service Present's
Focus: Worldwide
By Sun Storm Investment Research & NexGen Wealth Management Service
A Profit & Solutions Strategy & Research
Trading | Investment | Stocks | ETF | Mutual Funds | Crypto | Bonds | Options | Dividend | Futures |
USA | Canada | UK | Germany | France | Italy | Rest of Europe | Mexico | India
Disclaimer: Sun Storm Investment and NexGen are not registered financial advisors, so please do your own research before trading & investing anything. This is information is for only research purposes not for actual trading & investing decision.
#debadipb #profitsolutions

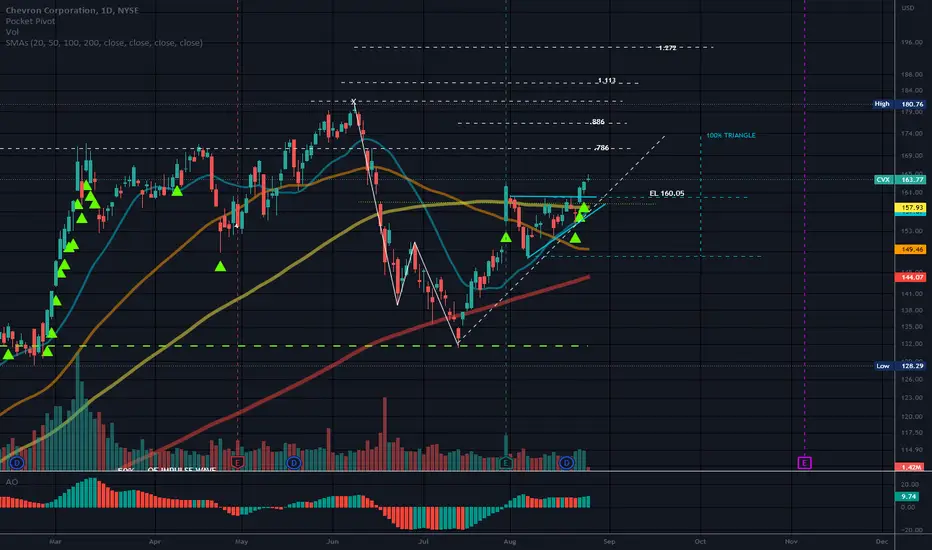
Ascending TriangleOIL stocks are still pumping!
Price is above the upper trendline of the triangle.
You can take the width of a triangle and project it upward to get possible targets.
No recommendation.
Possible W forming with room to tun.
8/24/22 CVXChevron Corporation ( NYSE:CVX )
Sector: Energy Minerals (Integrated Oil )
Market Capitalization: 319.434B
Current Price: $163.19
Breakout price: $164.35
Buy Zone (Top/Bottom Range): $156.20-$146.90
Price Target: $180.00-$182.70
Estimated Duration to Target: 48-50d
Contract of Interest: $CVX 10/21/22 170c
Trade price as of publish date: $5.60/contract
