$DDOG- Raising wedge with RSI bearish divergence - puts ?$DDOG- Raising wedge with RSI bearish divergence - watch for puts after break down trend line
DDOG trade ideas


DDOG$DDOG – momentum weakening. Daily RSI trending lower; fell below the RSI uptrend line but at support at 61.8.If RSI falls below 61.8, there could be additional weakness ahead. Initial support is at the daily 20 EMA, around $128, then around $120.

DDOG Decision Time!DDOG is forming an ascending triangle on the 4H chart.
Price has been sideways ever since the bullish earnings that landed it above 130.
Price can be seen making attempts at higher highs and lower lowers during every impulsive move up and down.
OBV is rising
Price is tightening, volume dropping
I believe this can break out to 140+ by the end of the month as long as SPY and QQQ do not crash.

DDOG - Optimal R/R (8/23/2021)Buyers still in control after the PEG. Volume is drying up and although landed lower for the week still in a uptrend.
Risk is that the 5EMA is now declining but positively other MA has caught up to the price. Price is also still extended from 23EMA but is still trading in the PEG range.

Nice setup for $DDOGVery nice setup for $DDOG.
We took a position 2 days earlier, well positionned for the coming weeks.


Earning in AM BMO Cup and HandleNot quite to long entry levels.
FYI: Zack says this is a sell. Hard to know as market reaction and not only the earnings have to be factored in.
No recommendation
support and handle low and mid cup.

DDOGWeekly chart of DDOG. RSI cleared the 61.8 level which was a problem area in the past. Weekly MACD is still moving higher and looking strong. Looks high the stock wants to go higher.


$DDOG off to the races on very strong volume.NASDAQ:DDOG I will be adding more on any dips in this name.
My strategy is to keep adding on the dips until the trend breaks.

Wyckoff daily reaccumulation for $DDOG PT: $199.33Price target: used horizontal count method on point and figure chart
Suggested entry area indicated on chart.

DDOG starting to retrace Similar to PTON, DDOG is coming off the 200 day MA. It is also on an uptrend so I would play the short side close/quick. I like the $88ps for this week if we can get some momentum downward.


Clear RSI divergence on the 4h DDOG LONG ENTRYRSI divergence shows support has reached + Trend reversal confirmation.
Target 1: 100$
Target 2: 110$ (resistance)
Target 3: 120$ (strong resistance)

Dead Cat Bounce on DDOGDouble top on DDOG is playing out.
Recent bounce failed to reclaim the lower support levels. And with tech / growth dying across the board, I am not expecting any macro force to save doggo here.

DDOG looking weakLooking pretty weak, chart reminds me of PTON. I'm not really seeing signs of a reversal yet so I'll be looking for a slight run-up for an entry short. Around Friday's high will be where I'll be looking for potential entry.

DDOG Analysis $DDOG | #Analysis | #StockMarket
Price Target 102.58 🎯
3 Inside Up ✅
Inverse Head & Shoulders ✅
Break above Golden Zone with Strong Momentum ✅
Higher Low being Made with Bullish Hidden Divergence ✅
Trend Line Confluence from March 2020 Lows ✅
Entry on Break of 92.07 with Confirmation ✅
Invalidated below 82.24 ❌


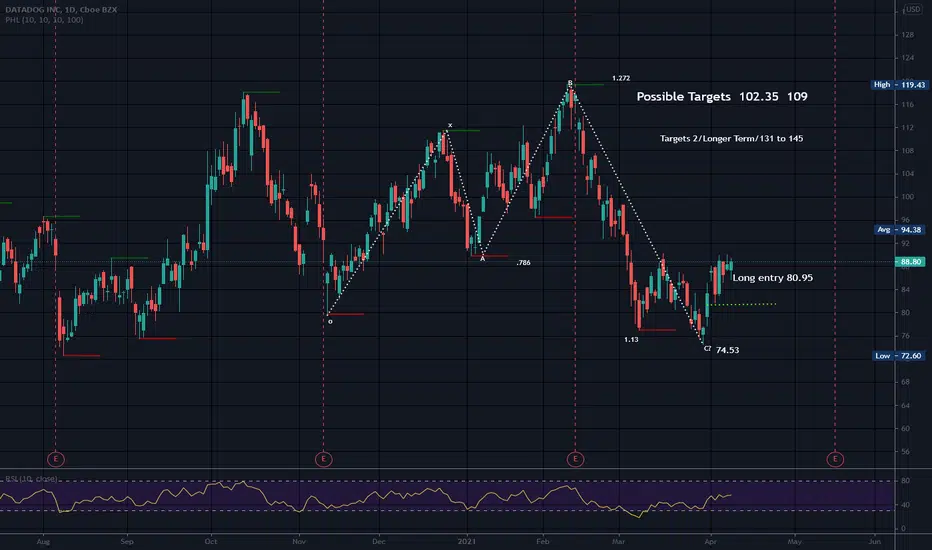
Cypher Pattern Verses the Shark PatternDDOG appears to be trading in a bullish shark pattern and D is the target. It is labeled O, X, A, B, C verses X, A, B, C, D like other harmonic patterns. I am not sure why the Shark is labeled differently than the other harmonic patterns, but maybe to differentiate it from the Cypher pattern as they are similar.
As with other harmonic patterns, the Shark pattern exhibits Fibonacci relationships within its structure. Shark pattern is a five point formation with four primary legs. The shark is often confused with the Cypher pattern as both have a second peak that is above the first peak. In theory, the Cypher's final leg (CD) pulls back only to the 0.786 of XA (1st leg). The Cyper is labeled XABCD verses OXABC like the shark (confusing) The final leg(BC) of a shark pulls back to the .886 or to the 1.13 fib level of OX (1st leg).
The cypher, in theory, can only have it's AB leg (2nd leg) retrace 38 to 61% of it's first leg (impulse leg). The shark pattern has no designated area of retracement (that I know of) by the 2nd leg except it can not go deeper than point O.
The second leg is where you can start eliminaing other harmonic patterns. The third leg is where you can eliminate even more. IE, if the 3rd leg's peak is lower than the first peak in the pattern, you are not looking at a cypher pattern or a shark pattern. This is for bullish harmonic patterns only as there are also bearish versions of these patterns. It seems possible that in some cases (not all), the shark and the cypher could really not be totally differentiated until the Potential Reversal Zone is reached (PRZ). In this particular chart, the 2nd leg pulled back too far to be a cypher pattern.
The hyperextended moves of a shark pattern causes price exhaustion. The supply and demand is interrupted due to the rather extreme price moves, which can trigger a strong reaction when the price reaches the potential reversal zone, especially if that level corresponds with a previously established support level for the bullish shark pattern.
Possible stop below last pivot low.
No recommendation