Short Walt DisneyLiquidity took upside, clear breaker done, bearish P03, I m expecting the price to go down, Sell limit in place, waiting to be triggered
DIS trade ideas

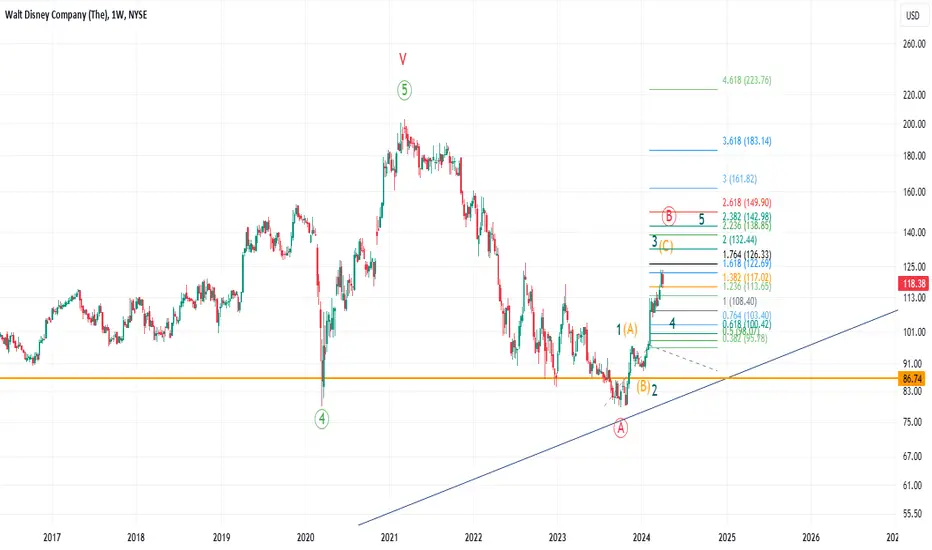
Don't f*** with the mouse they said ($DIS)Could this be an impulse from inception to all time high?
Certainly looks like it could be an impulse finished or close to finishing starting at all time high, which would just be an A-wave in that case.
An alternative would be to have this impulse as the C-wave of a flat only finishing wave 4.

$DIS-Walt Disney could dive further after breaking $111 -UpdateNYSE:DIS -Walt Disney could dive further after breaking $111 -Update
It looks like the DIS broke out of a major support zone located near $111.
During the previous days NYSE:DIS was showing some strength but couldn't manage to rise more
and today we can see the price below the structure zone again.
On the 4-hour chart, we can expect a deeper correction as a swing trade.
If we also consider the daily time frame a major resistance zone was already tested.
This zone dates back to August 2022 thus adding more value to this analysis.
The first support zone will be found near 107.40, where the GAP also begins.
It may be possible for Disney to fill the GAP created earlier in early February 2024 as well.
You may find more details in the chart!
Thank you and Good Luck!
❤️PS: Please support with a like or comment if you find this analysis useful for your trading day❤️

DIS The Walt Disney Company Options Ahead of EarningsIf you haven`t bought the dip on DIS:
Then analyzing the options chain and the chart patterns of DIS The Walt Disney Company prior to the earnings report this week,
I would consider purchasing the 112usd strike price Puts with
an expiration date of 2024-5-10,
for a premium of approximately $2.82.
If these options prove to be profitable prior to the earnings release, I would sell at least half of them.

Walt Disney UpdateIf the price comes back to 107 price level support and has bullish signs, I might want to add a bit more into this company.

Strategic Entry and Exit Points for Optimal Trading Performance.As of the latest trading session, Walt Disney Company (DIS) is exhibiting significant volatility with a current price of $104.54, marking a notable decline. The recent price action brings into focus several technical indicators and market sentiments that can influence future price movements.
Moving Averages: DIS is currently trading below several key moving averages including the 10-day ($111.77), 20-day ($112.87), and 50-day ($111.99) Exponential Moving Averages (EMAs), indicating bearish momentum in the short to mid-term. However, it remains above the 200-day Simple Moving Average (SMA) at $95.82, which can act as a support level in a broader view.
MACD (Moving Average Convergence Divergence): The MACD is below zero and the signal line, suggesting bearish momentum and possibly more downside in the near term.
RSI (Relative Strength Index): The RSI is currently at 32.82, nearing the oversold territory, which might signal a potential reversal or stabilization, although caution is advised as further decline is still possible.
Fibonacci Retracement: From the recent highs and lows, the Fibonacci retracement levels indicate immediate resistance near $106.55 (38.2% retracement) and support at $101.24 (61.8% retracement).
Volume and Volatility: Recent trading sessions show increased volume on down days, indicating strong selling pressure. This is corroborated by the significant market range observed, which suggests that volatility is heightened.
Given the current technical setup, I would adopt a cautious approach with a potential speculative target of $127.21 in the long term, acknowledging a 21.69% increase from current levels as forecasted by analyst consensus. However, short-term trades may involve considerable risk due to current market volatility.
Short Position: If considering a short position, one might initiate this near the $106.55 resistance level, setting a tight stop loss around the $108 mark to minimize potential losses from a rebound or unexpected bullish turnaround.
Long Position: A long position could be considered if the price shows significant reversal signals near the $101.24 support level. A stop loss should be placed just below $100 to manage risks, aiming for a conservative target near the $110 range initially.
In conclusion, Walt Disney Company shows a bearish trend in the short term with potential for further declines. Investors and traders should monitor the key levels mentioned for entry and exit points, ensuring that stop losses are appropriately placed to manage risks. As always, it's crucial to consider broader market conditions and news that could impact stock performance. For long-term investors, current levels might provide a buying opportunity, but caution and gradual entry are advised considering the ongoing volatility and downward pressure.


$DISNot financial advice.
NYSE:DIS trying to fill the gap in the purple box at the same time inside this broadening formation. will see if bulls recover or will go to retest the bottom of the formation.
Subscribe for more ideas.
thanks!

Disney H&S Developing could fill the gap NYSE:DIS Disney is developing a head and shoulder pattern it could fill the gap if support doesn't step in after earnings. Look for 105-100 as a target if volume doesn't buy in expected Gap Down and gap fill below it couldn't break upper resistance at 124 level either

Disney Reports Surprise Profit in StreamingWalt Disney's ( NYSE:DIS ) streaming entertainment unit posted its first profit on Tuesday, two quarters ahead of schedule, and the company raised its annual earnings per share outlook as it said turnaround efforts were yielding results. Shares of the company were down 1.4% in premarket trading. Disney ( NYSE:DIS ) now expects adjusted earnings per share to rise by 25% this fiscal year, up from the 20% it previously forecast. The company attributed the change to strong results at theme parks and improvements in the streaming business.
The direct-to-consumer entertainment division, which includes the Disney+ and Hulu streaming services, reported operating income of $47 million from January through March. Disney ( NYSE:DIS ) had promised Wall Street that the streaming operation would become profitable by September. The division had been losing money since Disney+ debuted in 2019 in the company's major push to compete with Netflix.
Chair Executive Bob Iger, who defeated board challenges from activist investors last month, said in a statement that "our strong performance this past quarter demonstrates we have turned the corner and entered a new era for our company." The steps Disney is taking today lend themselves to solidifying Disney's place as the preeminent creator of global content.
Like other media companies, Disney ( NYSE:DIS ) has been trying to adapt to consumer migration from cable television to streaming entertainment. Iger, who came out of retirement to revamp Disney in November 2022, instituted cost cuts that are expected to reach at least $7.5 billion by the end of September. He also unveiled a 10-year, $60 billion investment in theme parks and announced plans for a stand-alone ESPN streaming app, among other efforts.
The earlier-than-expected profit from streaming entertainment was driven by aggressive cost management, according to Chief Financial Officer Hugh Johnston. A year ago, the streaming unit lost $587 million. Disney+ added more than 6 million customers during the quarter, and average revenue per user rose 44 cents, outside of India. Disney ( NYSE:DIS ) offers a lower-priced plan in India that it counts separately.
Disney ( NYSE:DIS ) also reports results for a combined streaming unit, including ESPN+, which should generate a fiscal fourth-quarter profit and become a "meaningful future growth driver for the company, with further improvements in profitability for fiscal 2025."
For January through March, the combined streaming business with ESPN+ lost $18 million. During that time, the Mouse House posted diluted earnings per share, excluding certain items, of $1.21, ahead of analysts' consensus estimate of $1.10, according to LSEG data. Quarterly revenue rose to $22.1 billion, in line with analyst forecasts.
In the second fiscal quarter of 2024, Disney ( NYSE:DIS ) achieved strong double-digit percentage growth in adjusted EPS(1) and met or exceeded financial guidance for the quarter. As a result of outperformance in the second quarter, the company's new full-year adjusted EPS(1) growth target is now 25%. The company remains on track to generate approximately $14 billion of cash provided by operations and over $8 billion of free cash flow this fiscal year.

DIS - Possible longsI want to see DIS hold the $116 level, invert this monthly FVG, and take out the highs in the daily FVG and at std -4 near $167
A short term play will be longs into the monthly FVG, targeting $123-128
Rejection of the monthly FVG and I will short into the weekly FVG $107-98

DIS Testing Fundamental SupportWhen Americans feel depressed or unhappy about life, they tend to spend more money on fun things--something to consider during a presidential election year.
For now, NYSE:DIS is looking fine for its earnings report next week. It was over-speculated, so adjusting back down closer to fundamental support is normal. The gap up in February was on way better than expected earnings, so that level should hold up well.
However, HFTs and MEME groups have been going gaga over earnings and other news. If HFTs or MEMEs drive it down, it will move right back up due to Dark Pool activity first, and then pro trader activity.

Long $DIS, might regretNYSE:DIS might be oversold, at least in the near term. It has been selling off at a parabolic rate for over 2 years (starting Mar '21), but has recently shown signs of a bottom.
Signs of bottom (maybe!):
- Price has been declining at a parabolic rate for years but Weekly RSI seems like it might be showing a weak trend reversal starting around June '22
- Price might close above both TK lines on the Daily
- Possible Weekly TK clamp?
- Price has reached peak bottom COVID crash in 03/2020, potential support?
Reasons I'm wrong:
- The Weekly cloud looks...not great
- Price is below a sizable chunk of volume per VPVR, next support not showing until $68 (seems bad)
Would be bad if:
- A close below $78 on a Daily candle, and especially a Weekly
- Weekly RSI breaking down from wedge to LLs
Would be good if:
- Break parabolic downtrend on Weekly (close above $85)
- Continuing strength in Weekly RSI
- Bullish TK cross on the Daily
- Price trading above 50day MA
POSITION UPDATE:
Kid and I ape'd into a small position with an avg cost basis of $81.39.

Ichimoku Watch: Walt Disney Displaying Signs of Bullish IntentioUpcoming Earnings Release:
Walt Disney Company (ticker DIS) is scheduled to report earnings on 7 May before the market opens. The consensus EPS estimate for the fiscal quarter ending March 2024 is $1.09. The reported EPS for the same quarter a year prior was $0.93.
Buyers Preparing to Show?
What price action is currently showing is slowing downside momentum. We can see that in recent price action: the downside moves have been weakening, and buying is strengthening. This highlights that a possible breakout to the upside may occur.
It is also clear to see that the Ichimoku Cloud (formed by the Leading Span A and the Leading Span B) is being tested as potential support. However, it may concern some bulls that the Leading Span A has just recently crossed below the Leading Span B, which can be seen as a bearish signal. But it is still early days here. For Ichimoku traders to have more confidence in the Ichimoku Cloud support area, they may wait and see if the conversion line (Tenkan-sen) crosses above the base line (Kijun-sen) before committing to a long position.
Another means of confirmation traders may seek at this point is price closing above the base line or, alternatively, a daily price close above the small falling channel pattern ($111.08 and $114.18). Were this to be accompanied by increasing volume, this would add weight to the possibility of a follow-through.

Disney chart shifting toward more short term painThe bearish short term shift from the high indicates this pullback is more meaningful and likely to be a larger degree wave two pullback with targets in the 101 zone.

$DIS-Walt Disney could dive further after breaking $111NYSE:DIS -Walt Disney could dive further after breaking $111
It looks like the DIS broke out of a major support zone located near $111.
On the 4 hour chart we can expect a deeper correction as a swing trade.
If we also consider the daily time frame a major resistance zone was already tested. This zone is dating back in August 2022 thus adding more value to this analysis.
The first support zone will be found near 107.40, where the GAP also begins.
It may be possible for Disney to fill the GAP created earlier in early February 2024 as well.
You may find more details in the chart!
Thank you and Good Luck!
❤️PS: Please support with a like or comment if you find this analysis useful for your trading day❤️

Understanding Market Structure In 5 MinutesThis video goes into depth on the types of market structures and how they happen. Ranging -> Breakout (Spike) -> Channel (trend or a ranging trend) -> Climax. The market moves in these repeatable patterns over and over and over again. If you can diagnose where we are in these cycles then you can harness this skill to improve your trading.

Mickey Mouse back to $88?I can see Disney pulling back to support (upper line of parallel channel) creating confluence with the .236 fib.
Wouldn't play this short but would 100% take a long at around that price range ($88-$90).

Is Disney's Renaissance Sustainable?In the annals of financial lore, few sagas are as captivating as the rollercoaster ride of Disney's stock. From the dizzying heights of its peak to the depths of its nadir, the House of Mouse has seen it all. Yet, just as a phoenix rises from the ashes, so too has Disney experienced a remarkable resurgence in recent times. But amidst the euphoria of its stock's revival, investors are left pondering a crucial question: Is the time ripe to bet on Disney's future?
Disney, an intricate tapestry of entertainment, boasts an arsenal of beloved characters and franchises unrivaled in the industry. From Mickey Mouse to Marvel superheroes, its portfolio is a treasure trove of nostalgia and innovation. But navigating the labyrinthine landscape of its operations requires more than just pixie dust and wishful thinking.
The pandemic served as a crucible, testing Disney's resilience like never before. As theme parks lay dormant, streaming platforms emerged as beacons of hope, illuminating a path forward. Yet, even as one door closed, another swung open, revealing the adaptability and resourcefulness ingrained in Disney's DNA.
Under the stewardship of CEO Bob Iger, Disney embarked on a voyage of reinvention, charting a course toward operational excellence. The resurgence of its theme parks, coupled with a revitalized focus on content creation, heralds a new era of growth and innovation. But behind the scenes, the gears of change are grinding, reshaping the very fabric of Disney's identity.
The latest quarterly results offer a glimpse into Disney's metamorphosis. While revenue may have stagnated, operating income soared, fueled by the surging tide of streaming subscriptions. Bob Iger's bold proclamation of streaming profitability by fiscal 2024 echoes a newfound sense of confidence permeating the company's corridors.
Yet, amidst the glitz and glamour, challenges linger on the horizon. The specter of ESPN's uncertain future looms large, casting a shadow over Disney's aspirations. But rather than retreat in the face of adversity, Disney has chosen to confront it head-on, forging alliances and innovating new pathways to success.
Investors, ever the vigilant custodians of capital, are cautiously optimistic. The allure of Disney's storied legacy is undeniable, yet prudence dictates a measured approach. For while the promise of future returns may tantalize, the present realities demand scrutiny.
In the grand tapestry of Disney's saga, each thread tells a story of resilience, adaptation, and unyielding optimism. As the curtains rise on a new chapter, investors stand poised at the precipice of possibility, gazing toward a future brimming with promise and potential. And as Walt Disney himself once said, "It's kind of fun to do the impossible."

DISNEY $DIS | DISNEY DESCENDING TRIANGLE PATTERN - Apr. 11, 2024DISNEY NYSE:DIS | DISNEY DESCENDING TRIANGLE PATTERN - Apr. 11, 2024
BUY/LONG ZONE (GREEN): $118.50 - $123.00
DO NOT TRADE/DNT ZONE (WHITE): $116.50 - $118.50
SELL/SHORT ZONE (RED): $112.00 - $116.50
Weekly: Bullish
Daily: DNT
4H: Bearish
A week ago NYSE:DIS broke its bullish trend on the 4H and lower timeframes. The Weekly timeframe still holds the bullish trend, and the Daily timeframe is currently untradeable for myself, but is working its way closer to a bearish trend as it is breaking down bullish structure. The 4H timeframe shows a descending wedge/triangle (or possibly a developing sideways range channel) with the bullish support level being around 117.00. The 117.00 is where bears should look for a breakdown to confirm the downwards trend, and bulls should look for a breakout above the 118.50 level. 118.50 is a safe entry for bulls, however; earlier entries could be a break above the descending trend line that is acting as the top of the wedge/triangle. Previous bull trend and continuation are labeled to show where I got the levels and zones from and how more recent price action has reacted to these areas.
This is what I would personally look at before entering trades, everything is subject to change on a daily basis and as I analyze different timeframes and ideas.
ENTERTAINMENT PURPOSES ONLY, NOT FINANCIAL ADVICE!
trendanalysis, trendtrading, priceaction, priceactiontrading, technical indicators, support and resistance, chartpatterns, wedge, descendingwedge, descendingtriangle, bearishtriangle, bearishtrend, bearishchannel, trendchannel, disney, disneystock, dis, disstock, NYSE:DIS , disneyparks, disneyprice, disneystockprice, disneyanalysis, disneytrend, disneystocktrend, disneychannel, triangle, beartriangle, disneyreversal, reversal, reversalpattern, trendcontinuation, shortdis, longdis, disneytrade, disneyidea, disneyoptions, disneylong, disneyshort, rangingprice, disneyrange, rangezones, rangechannel, waltdisney, waltdisneycompany,

$DIS Disney Long term bottomWe see rounding capitulation, possibly signalling the first 1/3rd of a cup and handle.
If we look in the bottom volume pane we see the point of engulphment; see X (circled blue)
STATEMENTS//
*DISNEY 1Q REV. $23.55B, EST. $23.8B ( MISS ❌ )
*DISNEY 1Q ADJ EPS $1.22, EST. 99C ( BEAT ✅ )
*DISNEY 1Q DISNEY+ SUBSCRIBERS 149.6M, EST. 151.2M ( MISS ❌ )
*DISNEY SEES FY ADJ EPS ABOUT $4.60, EST. $4.27 ( BEAT ✅ )
*DISNEY RAISES CASH DIVIDEND BY 50% AND PLANS $3 BILLION BUYBACK ✅
I know things with Disney are controversial, but how much worse can it get? Will we see the pendulum swing and the Disney we all know and love comes back? Will they stop with the DEI Psy-OP in their movies?

Disney Rejected 38.2% Fibo but Upside IntactStratos Markets Limited (www.fxcm.com):
CFDs are complex instruments and come with a high risk of losing money rapidly due to leverage. 66% of retail investor accounts lose money when trading CFDs with this provider. You should consider whether you understand how CFDs work and whether you can afford to take the high risk of losing your money.
Stratos Europe Ltd (trading as “FXCM” or “FXCM EU”), previously FXCM EU Ltd (www.fxcm.com):
CFDs are complex instruments and come with a high risk of losing money rapidly due to leverage. 70% of retail investor accounts lose money when trading CFDs with this provider. You should consider whether you understand how CFDs work and whether you can afford to take the high risk of losing your money.
Stratos Trading Pty. Limited (www.fxcm.com):
Trading FX/CFDs carries significant risks. FXCM AU (AFSL 309763). Please read the Financial Services Guide, Product Disclosure Statement, Target Market Determination and Terms of Business at www.fxcm.com
Stratos Global LLC (www.fxcm.com):
Losses can exceed deposits.
Any opinions, news, research, analyses, prices, other information, or links to third-party sites contained on this video are provided on an "as-is" basis, as general market commentary and do not constitute investment advice. The market commentary has not been prepared in accordance with legal requirements designed to promote the independence of investment research, and it is therefore not subject to any prohibition on dealing ahead of dissemination. Although this commentary is not produced by an independent source, FXCM takes all sufficient steps to eliminate or prevent any conflicts of interests arising out of the production and dissemination of this communication. The employees of FXCM commit to acting in the clients' best interests and represent their views without misleading, deceiving, or otherwise impairing the clients' ability to make informed investment decisions. For more information about the FXCM's internal organizational and administrative arrangements for the prevention of conflicts, please refer to the Firms' Managing Conflicts Policy. Please ensure that you read and understand our Full Disclaimer and Liability provision concerning the foregoing Information, which can be accessed via FXCM`s website:
Stratos Markets Limited clients please see: www.fxcm.com
Stratos Europe Ltd clients please see: www.fxcm.com
Stratos Trading Pty. Limited clients please see: www.fxcm.com
Stratos Global LLC clients please see: www.fxcm.com
Past Performance is not an indicator of future results.

DIS: 3 waves move so farLast week's huge reversal candle most likely ended the bull run that started in January. There is a chance that proce will move sideways in a range for a few days and then make another peak above $124, but still it will be a 3 waves moves. So what does that put the current price action relative to the overall correction? Well, that depends on how the next 2-3 months play out. There are 3 scenarios:
1)Least bearish/ Kind of bullish: Minor degree wave 3 of 5 waves of intermediate wave A of primary wave (B). That means we will see some more bullish price action after some short corrections towards $132-$142. Then a larger 3 waves correction will be followed by another bull run towards the ATH area.
2)Somewhat bearish/ Somewhat bullish: Minor wave C of Intermediate wave A of primary wave (B). That will bring a 3 waves correction right away, and then followed by a bull run towards $150s.
3)Super bearish/ Bull is steak: This price move up has made it almost to 0.5 retrace of the initial wave (A) correction. That qualifies this move to have all of primary wave (B) complete. That will mean the primary degree wave (C) will start now or maybe after another short bounce. If the long term trendline breaks, then watch out below....a lot below...around $40!