DOCU trade ideas

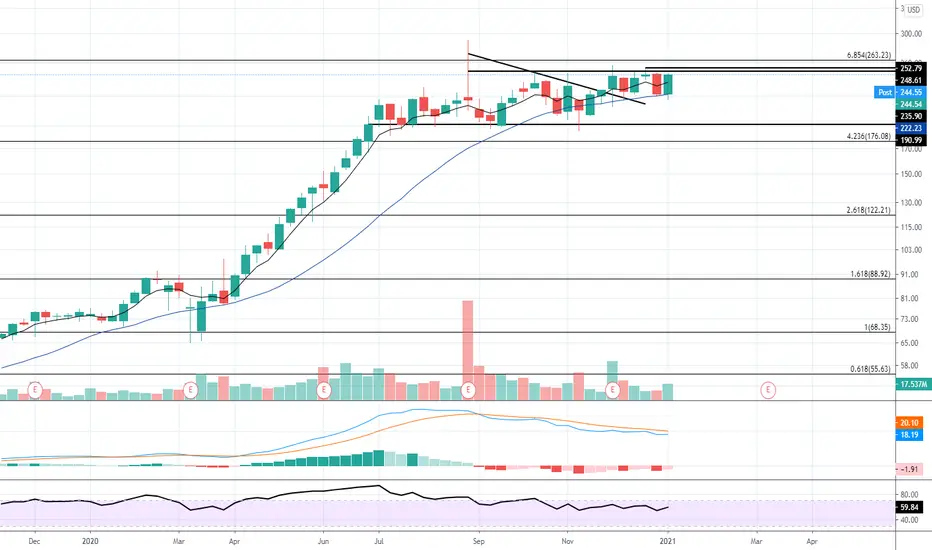
Docusign: trying to break a lateral trend
Docusign right now is trying to climb towards a hypothetical goal to 309$. But first it must break the big lateral trend where it is immersed. Last sessions it tried to achieve it but with no results. Let's see next sessions what it will do. This is a bullish stock that we must watch in the next days. If the stock exceeds 232$ I think it will achieve the 309$ goal.

DOCU channel bounceHit top channel trendline 1/12 and stated a pullback today, probably will see 230 again.

DOCU, Multiple TopsNASDAQ:DOCU has multiple tops around 250 area. As per the trend, bulls are coming harder and lifting the price again. RSI & MACD showing bullish signs to me. Let see this time 250 area get breaks.

Docusign continues uptrendDocusign broke higher from the 256 level, where it consolidated for 6 months.
It is closing in on it's all time high with a 259% 1Y gain behind it, well to continue in high gear.
A high growth stock. Currently trades at:
26x EV/Sales (NTM)
44% Sales growth YoY (Rising)
Gross Margin 75%
Sales estimate rising
EPS negative
EPS estimate rising


DOCU CrashI see DOCU in a steady downtrend for the next 2 weeks. DOCU hit old Support and bounced off. I am very Bearish on this stock for the short term.

RectangleDOCU seems to be giving it all she has the break out of the rectangle but not quite there yet. Volume spike noted around MR (Mid rectangle) recently.
NV and OBV are both high and short interest is 4.36% depending on where you look..
Obvious R above price and rectangle is quite wide. The support of the rectangle looks quite strong. If price breaks up over 246 in a clear uptrend, targets above are listed. If DOCU breaks support, then those targets are listed underneath. Some use MR as a stop whichever way she goes..
A Rectangle is a continuation pattern that forms as a trading range during a pause in the trend. The pattern is easily identifiable by two comparable highs and two comparable lows. The highs and lows can be connected to form two parallel lines that make up the top and bottom of a rectangle. Rectangles are sometimes referred to as trading ranges, consolidation zones or congestion areas.
There are many similarities between the rectangle and the symmetrical triangle. While both are usually continuation patterns, they can also mark trend significant tops and bottoms. As with the symmetrical triangle, the rectangle pattern is not complete until a breakout has occurred. Sometimes clues can be found, but the direction of the breakout is usually not determinable beforehand.
Not a recommendation

DOCULove the look. Long, but would love to get longer on a pullback next week. Looking for $400 first half 2020.

DOCU - h chartBuying dips, especially at 217.15 to 215.55
T1 230.72
T2 239.12
SL closing below 213.30


$DOCU Docusign - Piper Upgrade with $300 Target
DOCU out performed the sector today with the help
of the CEO's appearance on CNBC.
Afterhours- Piper Sandler analyst Rob Owens upgraded
DocuSign to Overweight from Neutral with a $300 price target.
Technically the weekly chart has has managed to hold onto the 20ma as support.
In the coming days we will look for a long with $228 , $232, $240 as potential targets

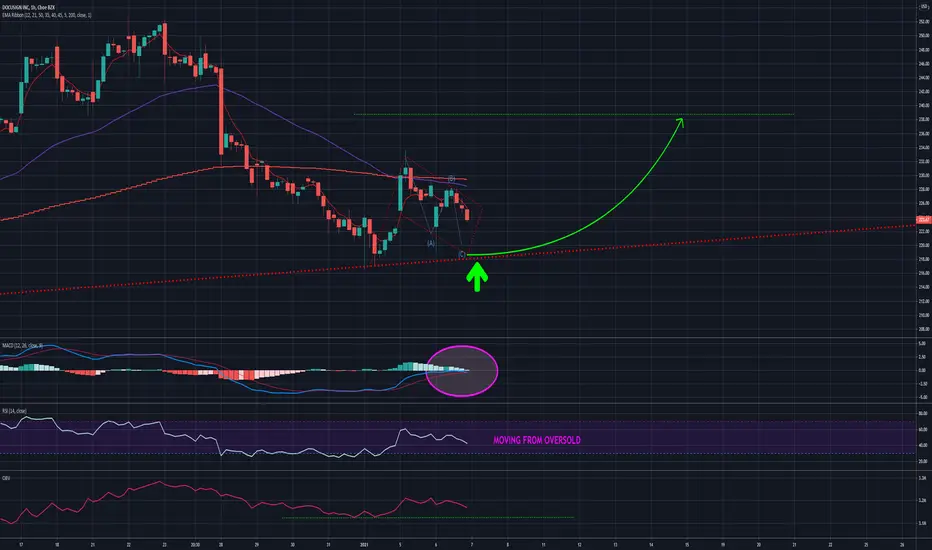
Buy the dipPrice went back to the same level as it was when the TK cross occurred giving us an opportunity to add to our position

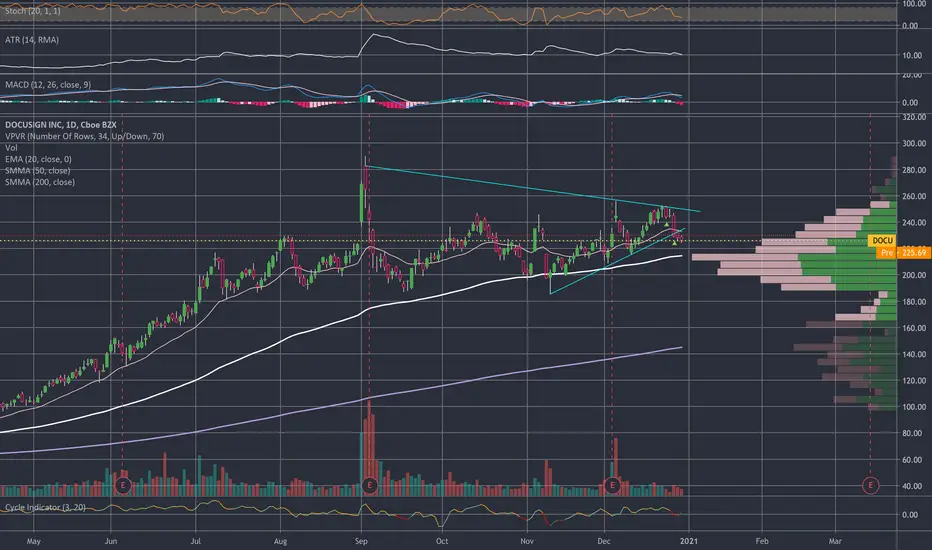
BIG triangle with DocuSign - 46% YOY rev growth!DocuSign, Inc. is an American company that allows organizations to manage electronic agreements. DocuSign offers eSignature, a way to sign electronically on different devices.
DocuSign reported 46% YOY in growth in revenue in Q3 2020. It has a large customer base of 822,000 and is touted as the worlds #1 eSignature solution. Considering the competitive signature market in 2020, this is significant.
The digital signature market is projected to grow from $2.8bn in 2020 to $14.1bn in 2026, according to a report by Research and Markets.
As society becomes increasingly cashless, a move accelerated by CV19, there is a case that all contracts and documents requiring signatures will no longer require paper and pen.
DocuSign has been a massive beneficiary of CV19, benefitting from the surge in home working.
DocuSign has rallied 270% since its March lows, from $76 to $245 today. It has puled back about 15% from its all tom highs in September. Alex Zukin, an analyst at RBC Capital, maintained a Buy rating and set a target of $275 for DocuSign’s share price.
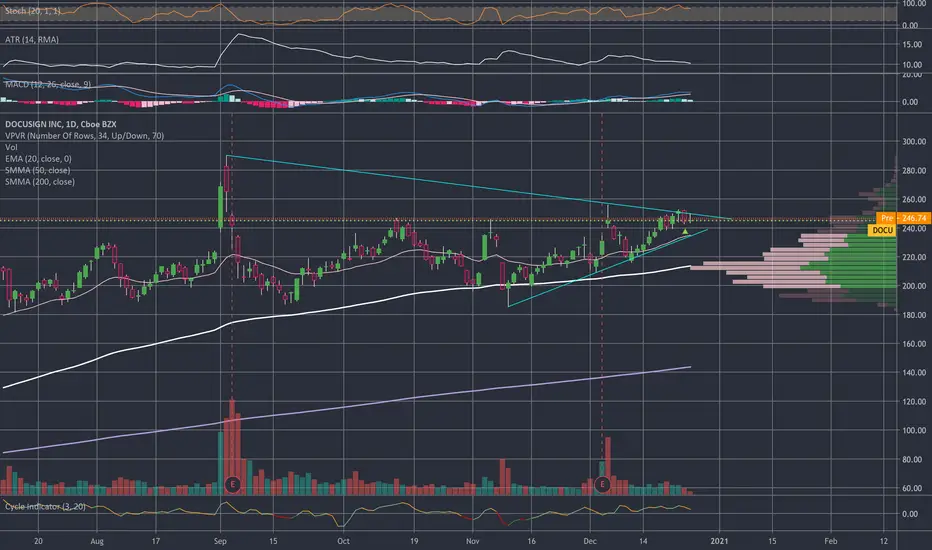
DOCU has been forming a massive triangle pattern since May. After this large period of consolidation, DOCU may be poised for a break out the upside. An ideal, but more risky entry, would be in the range of $227 to $221, the 0.6 and 0.618 fibonacci pullback zone. A less risky entry may be on the break out of the triangle consolidation pattern. The stock has found support, and is currently guarding above its 100 moving average.

DOCU - Quick Opportunity DOCU Signals to go Long:
1) 2 breakout confirmation candles out of the wedge formed
2)RSI starting to trend (>50)
3) MACD just crossed
4) News around increase virus cases play in favor of WFH companies
Entry : 215+
Exit : 245
Note: This stock has a tendency to move fast and then consolidate the gaps for a while so plan your exit accordingly. Do like if you agree :) Always an encouragement for someone who's starting out new on trading and reading charts.

$DOCU - concerningI am already in options here.
I am not a fan of the past few sessions and reviewing stop-loss in case this one turns into a "BABA" cliff dive
$DOCU - its comingriding the wedge.
I think this one will pop this week, if it can avoid any negative news.
Strong technicals and pennant pattern

DOCU wait for break out to get inThis one should yield a very nice long term gain to all those LEAP CALLS, DIAGONAL, CREDIT PUT. I will hold this for at lease 2 months.
Target at ATH

$DOCU Breakout?We might have something here... seems like a broken resistance and a good throwback. Let´s see if we end up with that of it falls below this new support. Target Price around $265, stop loss on $240.

$DOCU - potentialI like the histo and the ATR and not the stochastic.
The $DOCU story fits into stimulus and WFH story. Grabbed options yesterday.
Options will be cheaper EOD today or EOD tomorrow.
