AB=CDIn this case, AB is equal to CD, which is ideal but not always the case..
You can use the magnet and move the AB leg to the CD position to see if it fits. This pattern when bullish, looks like a downtrend and is sometimes found within a larger downtrend, so be safe. The bearish version would begin with AB, or leg 1 to the upside. In the bullish version, the AB leg is downward as is the CD leg with an uptrace at the BC leg. The retracement (up-tracement leg BC)) can be between 38.2% to 78.6% of the A-B leg, however, an ideal pattern has a retracement of 61.8% to 78.6%. The ideal AB=CD pattern is equal in time and price, with point D being an Fibonacci extension between 127%-161.8% of the B-C leg.
The pattern consists of three legs, with two equal legs labelled AB and CD, together they form a zig-zag shape. For this reason it is sometimes called the 'lightning bolt pattern'.
Plenty of resistance overhead.
The market has been tough and it does not seem to be a good idea to hang around too long.
PE Ratio is high at 90.06. Short interest is around 3.78%. Earnings estimated to be July 28.
Possible Stop below D or where you see support.
DexCom, Inc., a medical device company, focuses on the design, development, and commercialization of continuous glucose monitoring (CGM) systems in the United States and internationally. The company provides its systems for use by people with diabetes, as well as for use by healthcare providers. Its products include DexCom G6, an integrated CGM system for diabetes management; Dexcom Real-Time API, which enables invited third-party developers to integrate real-time CGM data into their digital health applications and devices; Dexcom ONE, that is designed to replace finger stick blood glucose testing for diabetes treatment decisions; and Dexcom Share, a remote monitoring system. The company’s products candidature comprises Dexcom G7, a next generation G7 CGM system. DexCom, Inc. has a collaboration and license agreement with Verily Life Sciences LLC and Verily Ireland Limited to develop blood-based or interstitial glucose monitoring products. The company markets its products directly to endocrinologists, physicians, and diabetes educators. DexCom, Inc. was incorporated in 1999 and is headquartered in San Diego, California.
EPS (FWD)
3.31
PE (FWD)
90.06 ****
Div Rate (FWD)
Yield (FWD)
Short Interest
3.78%
Market Cap
$28.37B
Trade at your own risk/No recommendation
DXCM trade ideas

Why do fundamentals not matter?I am just writing this in all of about 2 seconds since I was reminded this morning but some clueless guy who wants to take a fundamental approach to investing. He really isn't. He is just trying to sound like he has a clue to what he is doing and in reality, he is getting beating like a baseball during a Red Sox/ Yankees world series.
Dexcom... can anyone guess where its headed to? I think there is an obvious target for the retail crew don't really know how to chart. I think there is an even lower target below that though. It's why charting is important. Fundamentals are all good but they mean basically the stock 1) May not be de-listed 2) It may continue to make new highs. But when do you buy. How do you minimize your risk. Charts. There will always be a time to buy and when to sell and that's why fundamentals mean nothing. The chart will show you what the market thinks about the company long before you read a news article (which by the way, you should never do). Just look at the headlines, I happened to catch a few of them. The more honest people "The market still has a 25% drop to come" Inflation can be combated in two ways, much more aggressive fed action or crush the market to nothing". Then you have the scam artist fund people/ banks who .. ehh, I wont even repeat the crap they are saying. Never ever listen to the news. The chart is everything you need to know.. well and what makes the chart.
Good luck to those that bought Dexcom at 700. I do like the company and think I will invest when it bottoms. They are becoming a force that is acquiring others. Reminds me of my days in the drug/ pharmaceutical sector. I worked for what is now the largest medical/ drug company in the world that started as a little pharmacist back in the 40s and now does billions a quarter. Love seeing companies grow like that as long as they dont step on my toes. lol. They just grew and bought anyone in their way. Literally. I like Dexcom and know they have a great reputation. Anyway, just know when to buy and thats why you need to know charts. Fundementals mean little except chances are the stock ticker will not be de-listed and the chances of higher highs are in your favor if you know when to get in.

$DXCM with a Bullish outlook following its earnings #Stocks The PEAD projected a Bullish outlook for $DXCM after a Negative Under reaction following its earnings release placing the stock in drift D with an expected accuracy of 100%.

Short-term technical upward move likelyThis is a short-term trade. On the technical side, we've got the following things that make a bullish move more likely:
According to seasonality, in the last 15 years, only in one year went the price down within the timespan from the 7th of May until the 23rd of June. So, it's a bullish time for this stock according to seasonality.
The prior inverse H/S pattern got broken; the price went up, came down, and tested precisely the neckline yesterday.
A clear hammer candle formed yesterday.

DXCM---Good watchgood company that could be nearing a top in the short and long term. my weakness is getting squeezed on sub iv of 3s. Will this company get re-valued in amongst the others in tech?


DXCM High Tight Flag BreakoutDexcom makes glucose monitoring systems for patients with diabetes. I don't see Americans getting healthier any time soon, so demand for the company's products should remain high for the foreseeable future.
The stock is just breaking out of a high tight flag pattern. Technically, a high tight flag requires a move up of 100% or more, so DXCM comes up a little short on the initial surge. But the pullback inside the flag was very shallow - well below the 25% allowed in this setup. So for me, it balances out.
On the fundamental side, sales growth is accelerating. +23%, +25%, and +32% for the last three quarters. Earnings are also expected to jump by 40% in 2022.
The stop loss on this trade would be the just beneath the low of the flag at $487.00.

DXCM is testing all time highs!I last spoke about DXCM when it just broke the $423.40 range and said it would take weeks to reach and challenge the all time highs.
Fast forward 3 weeks and here we are.
Trade idea:
* Look for buying opportunities in the $423.40 to $430 area
OR
* Wait for another weekly close above $456.23


$DXCM er toss upER coming up seems to be at top edge of megaphone..
can breakout big here or come back down inside the megaphone
ER can be a toss up..
overall bullish as it printed a new ATH right before the ER

DXCM breaking out of 4 month consolidationDXCM has been in consolidation over the past year and within that it's been forming a smaller range since Feb of 2021.
The smaller range has broken out with a lot of buying pressure and is now testing the broken resistance as support.
Three things make this breakout significant.
1. It broke out with a lot of volume
2. It's retesting the broken resistance of $423.40 and is indicating that there's demand for this company at this level
3. It's also using the 10 EMA as support
These confluences indicate that DXCM is positioned to go higher in the coming weeks and months.
Looking at the weekly or even the monthly chart you can see that there's a clear up trend.
Next stop is the all-time-highs at $456.23!
Final Notes:
* Clear long term up trend
* Broke out of smaller range with a lot of buying pressure
* Using multiple confluences to build a solid support.

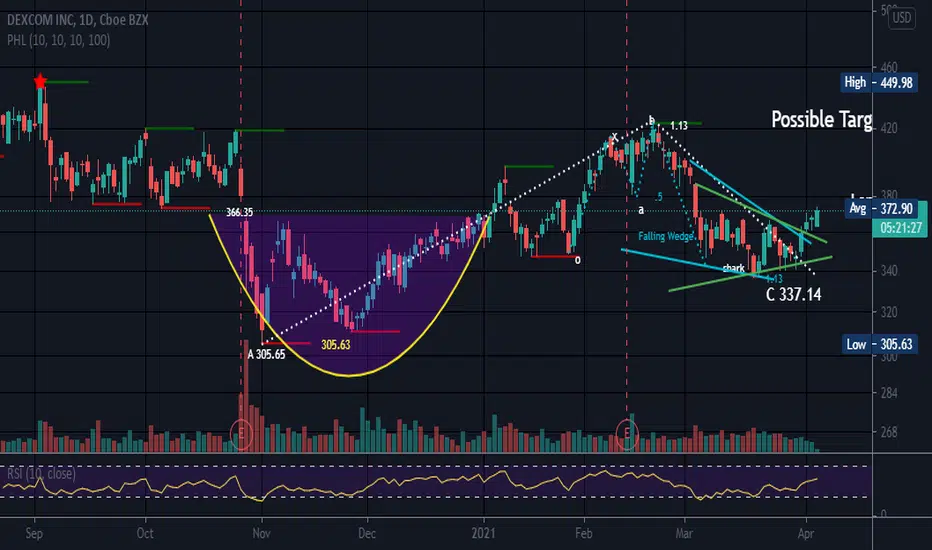
ABC BullishThe larger pattern appears to be ABC bullish .
If c is c, there could also be a smaller pattern inside the ABC pattern, a shark . The shark is labeled differently than the other harmonic patterns and begins with an O verse an X. C should land at the 1.13 fib level of OX. Like the Cypher , the 2nd peak is higher than the first peak. So you can really narrow down what this may or may not be when the pull back from the 2nd peak begins.
Not a recommendation. Possible stop under C
DXCM is known to be volatile. If you do not like long entry level today, wait and see what tomorrow brings (o:
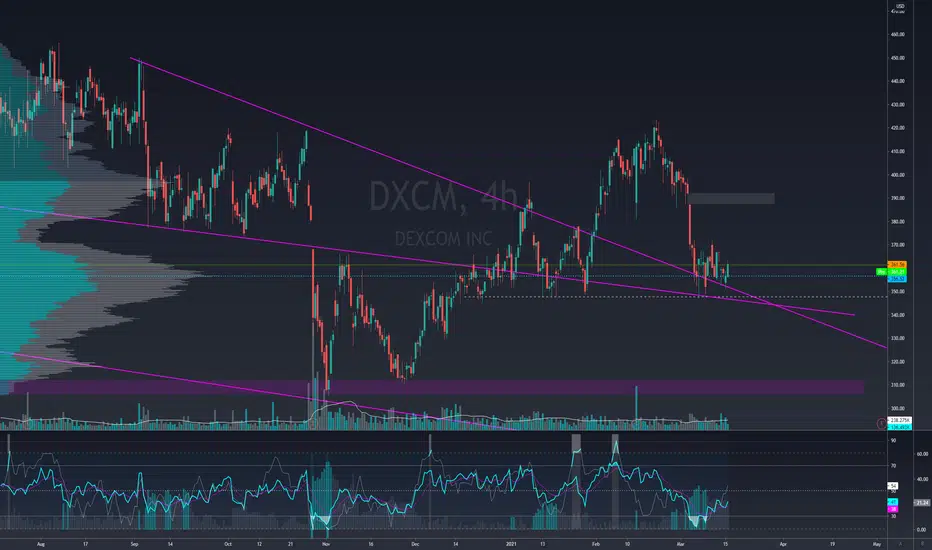
Price broke up from the triangle and the falling wedge.
.

DXCM - WAVE 4 CONSOLIDATIONDXCM based on Elliott wave count is currently in wave 4 consolidation.
It is predicted the stock will move within the sideway range of USD298 and USD456.
For Options trader, Iron Condor strategy perhaps is one good strategy to consider for the trading opportunity.
Happy trading!

DexcomI will try my chances at current price which is weekly 50EMA
If doesnt hold will take another shot at weekly 200EMA
No stop loss for this stock. I prefer to average my entry.


$DXCM waiting on a long entryWaiting for price to break out of the pennant here. The targets are provided based on Fibs.

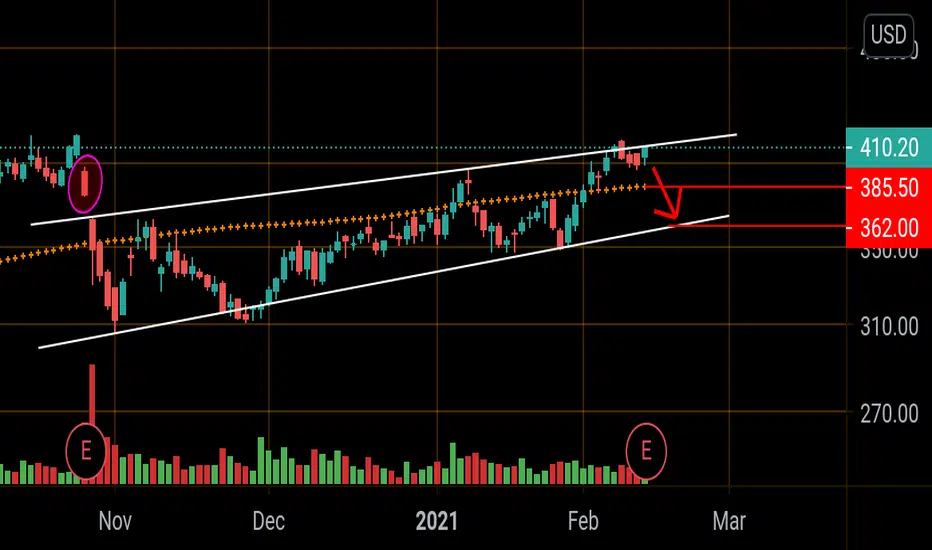
DXCM /Short itTanked on earnings again. Dxcm is Currently down 20$ in aftermarket and if it drops below 385$ it will be below 200ma ( gold line). I circled in purple the last time they tanked earnings and dropped below the 200ma. If they fall below 385 target then channel bottom (362) will be the the next target.
Ichimoku entry DXCMbroke all the way through the cloud and got all the signals aligned, looks good for liftoff

Look for a great earnings boost here come Feb.This will always be a buy-in my case. They are constantly posting great earnings results and improving the necessity of a medical device. Continue to enter in as this roller coaster climbs up.

DXCM will buy again later...Sold $382I just sold DXCM $382...
Hoping to buy again #DXCM
Share your thoughts here?
