Buy $DXD - NRPicks 07 MayProShares UltraShort DOW30 is an ETF that corresponds to twice the inverse (-2x) of the daily performance of the Dow Jones index, an index that includes 30 large-cap U.S. stocks and blue-chips, excluding publicly traded utilities and transportation companies.
The market during the first few days of
Key stats
About PROSHARES ULTRASHORT DOW30
Home page
Inception date
Jul 11, 2006
Structure
Open-Ended Fund
Dividend treatment
Distributes
Distribution tax treatment
Ordinary income
Income tax type
Capital Gains
Max ST capital gains rate
39.60%
Max LT capital gains rate
20.00%
Primary advisor
ProShare Advisors LLC
Distributor
SEI Investments Distribution Co.
DXD is designed to deliver -2x daily performance of the 30 US large-caps in the DJIA, weighted by price. As with any fund tracking the popular but dated DJIA, it's important to remember that it's not tracking a particularly robust representation of the larger US equity market. This is inverted, geared exposure to an index with arbitrary sector biases and antiquated weighting. Anyone holding DXD for longer than a day will be exposed to the path dependency. This dynamic is especially acute in funds that overlay leverage on inverse exposure as DXD does. Longer term investors must manage their exposure on a daily basis or use it as it was intended to be used: as a short-term trading tool. The expense ratio for DXD matters less than the total all in trading costs.
Classification
What's in the fund
Exposure type
Cash
Government
Stock breakdown by region
Top 10 holdings

Join with a commentSupport and resistance lines. I think that if interest rates go up in 2019 we will see a slow proceeding drop of the Dow.


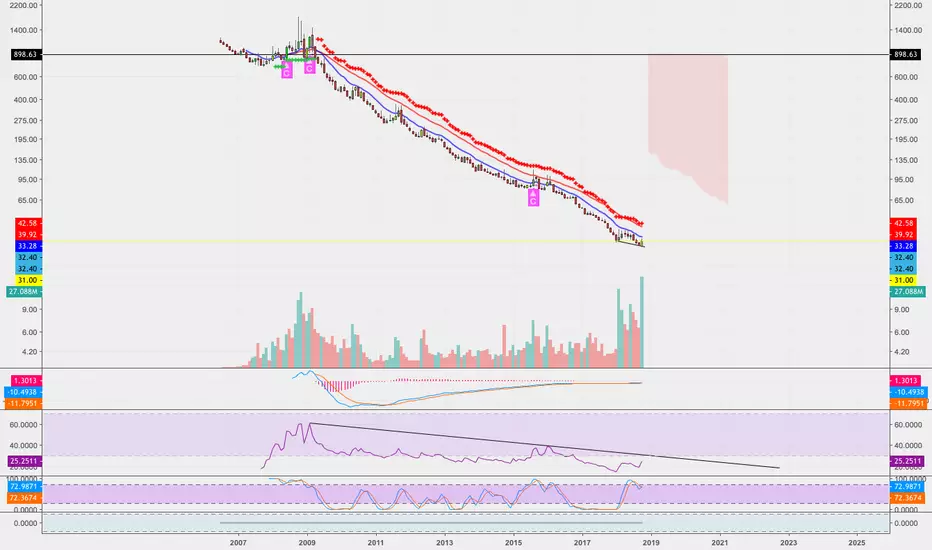

is DXD the answer to a falling market?DXD is the inverse of the DOW. In a falling market, I think this is a good play. If you know of a better ultra short please let me know in a comment. THanks for viewing!


DXD (Ultra Short Dow) Breaking outTrying to break out bullish of a long downtrend. Much talked about Dow Correction could be on the verge of happening. Very good risk/reward in this mkt.

See all ideas
Summarizing what the indicators are suggesting.
Oscillators
Neutral
SellBuy
Strong sellStrong buy
Strong sellSellNeutralBuyStrong buy
Oscillators
Neutral
SellBuy
Strong sellStrong buy
Strong sellSellNeutralBuyStrong buy
Summary
Neutral
SellBuy
Strong sellStrong buy
Strong sellSellNeutralBuyStrong buy
Summary
Neutral
SellBuy
Strong sellStrong buy
Strong sellSellNeutralBuyStrong buy
Summary
Neutral
SellBuy
Strong sellStrong buy
Strong sellSellNeutralBuyStrong buy
Moving Averages
Neutral
SellBuy
Strong sellStrong buy
Strong sellSellNeutralBuyStrong buy
Moving Averages
Neutral
SellBuy
Strong sellStrong buy
Strong sellSellNeutralBuyStrong buy
Displays a symbol's price movements over previous years to identify recurring trends.
Related funds
Frequently Asked Questions
An exchange-traded fund (ETF) is a collection of assets (stocks, bonds, commodities, etc.) that track an underlying index and can be bought on an exchange like individual stocks.
DXD trades at 569.00 MXN today, its price has fallen −1.04% in the past 24 hours. Track more dynamics on DXD price chart.
DXD net asset value is 521.10 today — it's fallen 0.68% over the past month. NAV represents the total value of the fund's assets less liabilities and serves as a gauge of the fund's performance.
DXD assets under management is 1.09 B MXN. AUM is an important metric as it reflects the fund's size and can serve as a gauge of how successful the fund is in attracting investors, which, in its turn, can influence decision-making.
DXD price has fallen by −2.39% over the last month, and its yearly performance shows a −2.99% decrease. See more dynamics on DXD price chart.
NAV returns, another gauge of an ETF dynamics, have fallen by −0.68% over the last month, showed a 14.91% increase in three-month performance and has increased by 4.94% in a year.
NAV returns, another gauge of an ETF dynamics, have fallen by −0.68% over the last month, showed a 14.91% increase in three-month performance and has increased by 4.94% in a year.
Since ETFs work like an individual stock, they can be bought and sold on exchanges (e.g. NASDAQ, NYSE, EURONEXT). As it happens with stocks, you need to select a brokerage to access trading. Explore our list of available brokers to find the one to help execute your strategies. Don't forget to do your research before getting to trading. Explore ETFs metrics in our ETF screener to find a reliable opportunity.
DXD invests in cash. See more details in our Analysis section.
DXD expense ratio is 0.95%. It's an important metric for helping traders understand the fund's operating costs relative to assets and how expensive it would be to hold the fund.
DXD is an inverse fund, meaning it's structured to generate returns opposite to the trends of the underlying index or assets.
In some ways, ETFs are safe investments, but in a broader sense, they're not safer than any other asset, so it's crucial to analyze a fund before investing. But if your research gives a vague answer, you can always refer to technical analysis.
Today, DXD technical analysis shows the sell rating and its 1-week rating is sell. Since market conditions are prone to changes, it's worth looking a bit further into the future — according to the 1-month rating DXD shows the sell signal. See more of DXD technicals for a more comprehensive analysis.
Today, DXD technical analysis shows the sell rating and its 1-week rating is sell. Since market conditions are prone to changes, it's worth looking a bit further into the future — according to the 1-month rating DXD shows the sell signal. See more of DXD technicals for a more comprehensive analysis.
Yes, DXD pays dividends to its holders with the dividend yield of 2.57%.
DXD trades at a premium (0.50%).
Premium/discount to NAV expresses the difference between the ETF’s price and its NAV value. A positive percentage indicates a premium, meaning the ETF trades at a higher price than the calculated NAV. Conversely, a negative percentage indicates a discount, suggesting the ETF trades at a lower price than NAV.
Premium/discount to NAV expresses the difference between the ETF’s price and its NAV value. A positive percentage indicates a premium, meaning the ETF trades at a higher price than the calculated NAV. Conversely, a negative percentage indicates a discount, suggesting the ETF trades at a lower price than NAV.
DXD shares are issued by ProShare Advisors LLC
DXD follows the DJ Industrial Average. ETFs usually track some benchmark seeking to replicate its performance and guide asset selection and objectives.
The fund started trading on Jul 11, 2006.
The fund's management style is passive, meaning it's aiming to replicate the performance of the underlying index by holding assets in the same proportions as the index. The goal is to match the index's returns.