eBay is the paradise of Chart Patterns🟢 eBay is the paradise of Chart Patterns
NASDAQ:EBAY is one of the best stocks if you regularly trade using chart patterns.
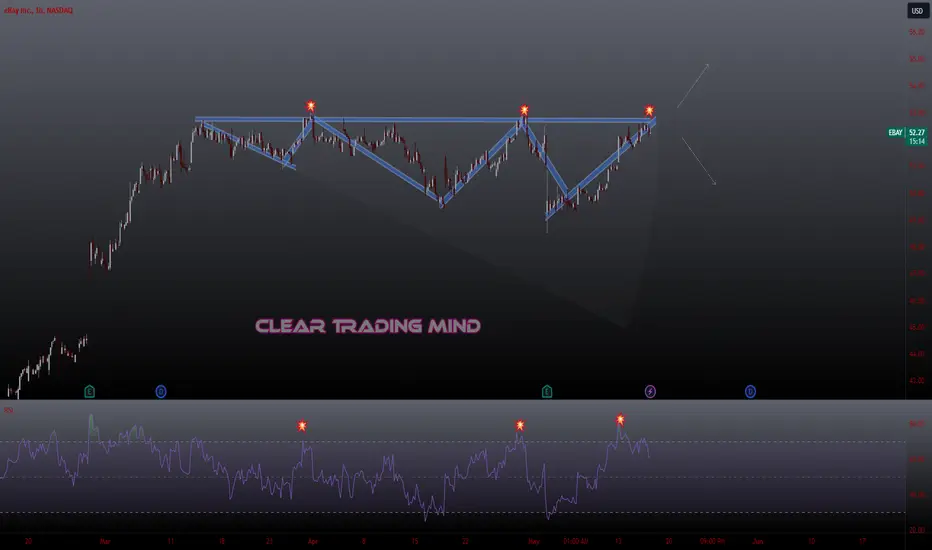
In the chart, you can see up to five different market patterns in just one year. This makes trading eBay quite predictable in terms of risk/return.
We are currently seeing the formation of a rising wedge, which can be very profitable for traders.
✅ What pattern is unfolding in eBay?
A rising wedge appeared under the previous high, which is very interesting for two reasons.
If the rising wedge breaks upwards, we could see the breakout of significant highs, giving the market a lot of momentum, similar to the rising wedge in August this year, which yielded up to 20% in profits.
On the other hand, being so close to the highs makes it plausible that the rising wedge could break in its usual direction, downwards, bringing the price near the previous lows and returning about 7% in a few days.
💰 How to trade this chart pattern?
A rising wedge pattern can break in either direction, so it's crucial to wait and see which way the price decides to go.
This type of pattern makes it much easier to follow a market trend.
🛡️ The risk management strategy
As we have done in so many previous ideas, remember you can split the position in 2. Let's explain a Sell if the patterns breaks down:
- 50% of the position in a take profits, at least, as large as your stop loss (adapt SL and this 1st TP to local supports/resistance levels). In this case, a 2% TP for 2% SL (using local supports as 1sst TP)
- 50% of the position to a price as large as the previous pattern, which would mean a profit of 7%.
✴️ ENJOY AND FOLLOW for more 😊
EBAY trade ideas

These 3 Steps Boost This Chart PatternThe rocket booster strategy has
a boost to it.And you need to know
this boost because it will help you
On your trading journey.Now if you
have played the cashflow board game
by the richdad company
Founded by Robert & Kim Kiyosaki
You will see that the best stocks
to buy are around $1 to $5
I want you to think of those
prices as margin leverage
meaning if you want to trade with
leverage do not use above x5
ideally do not use margin.
that is x1
Also you need to take profit
do not hold unless you
are investing then you
need to study the financial
statements
performance for the past 5 years.
and to do that you have to
pay for monthly service
for accurate data.
This article is about swing trading
with the aim to take profit.
So what is the rocket booster
strategy?
1.The price should be above the 50 EMA
2.The price should be above the 200 EMA
3.The price should gap up
That last step is very important because
you are buying the stock price
after a market crash.
So what is the boost to
to the rocket booster strategy
on this chart NASDAQ:EBAY ?
Is it the "spinning white top"
candle stick pattern.
Learn more about candlestick chart
patterns techniques by Steve Nissen
to boost this strategy
Rocket boost this content
to learn more.
Disclaimer:
Trading is risky please learn risk management
and profit-taking strategies
Because you will lose money wether you like it
or not
Also feel free to
use a simulation trading account
before you trade with real money.

Break and retest on EBAY! Big move incoming?🔉Sound on!🔉
Thank you as always for watching my videos. I hope that you learned something very educational! Please feel free to like, share, and comment on this post. Remember only risk what you are willing to lose. Trading is very risky but it can change your life!

EBAY eyes on $50.60: break should run to $66, then re-evaluate EBAY poised for breakout from double-fib resistance.
This resistance has imposed itself several times already.
So all humans/bots/algos are keenly aware of this level.
$ 50.65-50.68 is the immediate resistance to flip into support.
$ 65.92-66.16 is the final target, with some hurdles in between.
$ 46.73-46.98 is the first good support in case bears reject here.
========================================================

EBAY heads up into $66: first of 3 targets for swing tradeFollowup to Idea calling for $ 50-66 swing (click).
EBAY is pushing towards our 1st major target.
Above are 2 overshoot targets in case of break.
This is a good spot to start booking some profits.
Chart is 3-day tf, so it will move in a couple days.
$ 65.91 - 66.16 is the near term resistance zone.
$ 67.25 - 69.87 might serve as overshoot targets.
Previous plot:
=================================================================

Ebay Long- Bulls Find Support and go higher week of 9/30-10/4 The eBay Inc. stock holds buy signals from both short and long-term Moving Averages giving a positive forecast for the stock. Also, there is a general buy signal from the relation between the two signals where the short-term average is above the long-term average. On corrections down, there will be some support from the lines at $63.84 and $60.04. A breakdown below any of these levels will issue sell signals.
Entry $65.50 to touch 68.75 as a quick buy move.

EBAY is about to hit 64 soon and may grow furtherEBAY is about to hit 64 soon and may grow further
During the end of May'24, Ebay broke out of a strong weekly structure zone found near $52.
The price has been above this are for about two months.
On Wednesday, July 30, '24, Ebay will report earnings, which could be one reason we could see the stock resume its uptrend again.
We should not forget that Ebay has been reporting positive data for a long time.
You may find more details in the chart!
Thank you and Good Luck!
❤️PS: Please support with a like or comment if you find this analysis useful for your trading day❤️

Ebay: Almost there!Ebay’s shares have made impressive strides since our last update, hitting a new local high not seen in over two years. We anticipate further upside potential as wave (5) in magenta continues and expect it to arrive in our green Target Zone between $63.90 and $71.50. Once this peak has been reached, we expect a strong sell-off. Thus, our Target Zone presents an opportunity to realize the profits of existing long positions. It also serves as a potential entry point for short trades, with a possible stop loss placed 1% above the Zone’s upper boundary.

EBAYOne of the biggest ECommerce Market
eBay stocks looking for a new daily high
Bullish flag
waiting for a breakout with high volume

Ebay to hit New Highs BUYA break-up at the top trend line at $59.17 indicates a stronger rate of rising. Based on 14 Day MA Ebay is to move between $57.75 and $60.25

eBay stock breaks out: eyes on key levels at $64 and $76eBay Inc. (EBAY) stock has recently broken out of its base pattern and is approaching key levels at $64 and $76. If the stock remains above $56, it indicates that the momentum could persist, potentially driving further gains.


eBay Elliott Wavehello friends
In eBay, we see the formation of a bullish pattern, which is at the end of the 5 of 3 wave.
Wave 5 of 3 is an ending triangle pattern and we expect the price to decrease in the majority of wave 4 of 5.
This price reduction can continue until the end of wave 4 of 3. To start this decline, we need to break the dynamic support that is drawn at the bottom of the 5x3 triangle.
So, after breaking this upward trend line and pulling back to it, you can enter the SELL trade.
The first goal is $48.5 and the second goal is $44.
Be successful and profitable.
To support me, I recommend you install Trading View software on your phone and see my analysis and support me with your comments and Boost. Be successful and profitable.

EBAY Options Ahead of EarningsIf you haven`t bought EBAY before the breakout:
Now analyzing the options chain and the chart patterns of EBAY prior to the earnings report this week,
I would consider purchasing the 52usd strike price Puts with
an expiration date of 2024-8-16,
for a premium of approximately $0.98.
If these options prove to be profitable prior to the earnings release, I would sell at least half of them.

eBay: Knock... Knock...Ebay is trying to overcome the resistance line at $55.50. We expect it to succeed in doing so soon. We expect the high of the current wave b in beige and thus the end of the corrective rise well above this level. If, on the other hand, the stock now heads directly below the support at $46.03, we will have to assume that the wave alt. b in beige is already finished (probability: 37%).

Ebay previous resistance turn supportEbay previous resistance turn support
Overall up trend after breakout from log consolidation sit right above 200 wma with bulish engulfing candle
First Tp 58$
Second Tp 60$
Sl 52$
Not a financial advise
Dyor

EBAY: Up Trend & Rising Channel Key Points : NASDAQ:EBAY
Up trend
Rising Pattern
Short term up Trend is becoming weak.
A sideways trend may be seen.

EBAY is looking very nice for a swing call trade! 🔉Sound on!🔉
Thank you as always for watching my videos. I hope that you learned something very educational! Please feel free to like, share, and comment on this post. Remember only risk what you are willing to lose. Trading is very risky but it can change your life!

eBay: Traders Eye 53.00 Breakout or FailureThe eBay stock trend is testing a strong resistance zone at the 53.00 level. On the 1-hour chart, the price has attempted to break this level three times and failed. The RSI indicator shows a similar pattern, indicating strong resistance. This moment, we need to wait to see if the price will break this level or pull back. This is crucial to keep an eye on this asset's trend for a potential jackpot entry. What do you think? Let's wait and see
EBay Holds an Old HigheBay rallied earlier this year, and now some investors may see opportunity in its latest pullback.
The first pattern on today’s chart is the July 2023 high of $49.48. EBAY tested this level on April 17 and held it again last week. Has old resistance become new support?
Second is the rally between February 27 and late March. Notice how the online-auction stock held a 50 percent retracement of that move last week.
Third, the 50-day simple moving average (SMA) had a “golden cross” above the 200-day SMA in early March. That may suggest its longer-term trend is getting more bullish.
Finally, the stock just completed a bullish inside week. That may suggest a pullback phase is nearing its end.
TradeStation has, for decades, advanced the trading industry, providing access to stocks, options and futures. See our Overview for more.
Past performance, whether actual or indicated by historical tests of strategies, is no guarantee of future performance or success. There is a possibility that you may sustain a loss equal to or greater than your entire investment regardless of which asset class you trade (equities, options or futures); therefore, you should not invest or risk money that you cannot afford to lose. Online trading is not suitable for all investors. View the document titled Characteristics and Risks of Standardized Options at www.TradeStation.com . Before trading any asset class, customers must read the relevant risk disclosure statements on www.TradeStation.com . System access and trade placement and execution may be delayed or fail due to market volatility and volume, quote delays, system and software errors, Internet traffic, outages and other factors.
Securities and futures trading is offered to self-directed customers by TradeStation Securities, Inc., a broker-dealer registered with the Securities and Exchange Commission and a futures commission merchant licensed with the Commodity Futures Trading Commission). TradeStation Securities is a member of the Financial Industry Regulatory Authority, the National Futures Association, and a number of exchanges.
TradeStation Securities, Inc. and TradeStation Technologies, Inc. are each wholly owned subsidiaries of TradeStation Group, Inc., both operating, and providing products and services, under the TradeStation brand and trademark. When applying for, or purchasing, accounts, subscriptions, products and services, it is important that you know which company you will be dealing with. Visit www.TradeStation.com for further important information explaining what this means.

EBAY 10/1/2023Ebay.
Bid on this.
Ebay was in an uptrend that reached its peak in September '21 when the price entered a distribution stage in the form of a Double Top pattern.
In December '21, the price broke down from the Double Top pattern and entered a downtrend.
he downtrend persisted, making lower lows and lower highs from December '21 through October '22.
The price found support and bounced from the October '22 lows of $36, attempting to break through the previous lower high of August '22. However, the price failed to break the previous lower high and was rejected.
It continued moving sideways and has formed what appears to be a Rising Wedge Pattern. A wedge in a downtrend indicates a continuation of the previous trend.
There is a breakdown of the wedge’s support level, and the price continues to build up at the breakout point. This will be my entry.
Entering trade short.
Entry: 44.11
Stop Loss: 46.28 (-4.92%)
Target #1: 36.16 , +18.02%, 3.66 RR ratio
Target #2: 28.01, +36.5%, 7.42 RR ratio

eBay: Is the Big Turnaround Coming?
Looking at the eBay chart, we believe that Wave (1) and (2) were completed at $4.17, as well as Waves (3), (4) and (5). However, we've had some uncertainties regarding the positioning of Wave (3). Nonetheless, where we've positioned Waves (3) and (4) makes the most sense to us. Regardless, it could still be considered that Wave (5) and the overarching Wave I have truly peaked at $81.19. Zooming in on the 4-hour chart, it seems more like we are dealing with an extended Wave II rather than a different downward correction. Thus, we don't believe that $81.19 marks the position of Wave (3), as we're dealing with a 5-wave impulse downwards. This could indicate we're looking at a zigzag movement, broadly marked as (A), (B), then (C).
We believe we have already seen the subordinate Waves A and B, and now we should be developing a 5-wave impulse upwards to complete Wave C and the overarching Wave (B) between 61.8% and 78.6%. Afterward, we should see another significant drop. For eBay, we're operating on a higher timeframe, so this process will take longer. However, once we reach there, it will present excellent entry opportunities for us to build a long-term position.

EBAY Stock Chart Fibonacci Analysis 031224Trading Idea
1) Find a FIBO slingshot
2) Check FIBO 61.80% level
3) Entry Point > 47/61.80%
1) Find a FIBO slingshot
2) Check FIBO 423.60% level
3) Hit the top = 57/423.60%
Chart time frame : D
A) 15 min(1W-3M)
B) 1 hr(3M-6M)
C) 4 hr(6M-1year)
D) 1 day(1-3years)
Stock progress : A
A) Keep rising over 61.80% resistance
B) 61.80% resistance
C) Hit the bottom
D) Hit the top
Stocks rise as they rise from support and fall from resistance. Our goal is to find a low support point and enter. It can be referred to as buying at the pullback point. The pullback point can be found with a Fibonacci extension of 61.80%. This is a step to find entry level. 1) Find a triangle (Fibonacci Speed Fan Line) that connects the high (resistance) and low (support) points of the stock in progress, where it is continuously expressed as a Slingshot, 2) and create a Fibonacci extension level for the first rising wave from the start point of slingshot pattern.
When the current price goes over 61.80% level , that can be a good entry point, especially if the SMA 100 and 200 curves are gathered together at 61.80%, it is a very good entry point.
As a great help, tradingview provide these Fibonacci speed fan lines and extension levels with ease. So if you use the Fibonacci fan line, the extension level, and the SMA 100/200 curve well, you can find an entry point for the stock market. At least you have to enter at this low point to avoid trading failure, and if you are skilled at entering this low point, with fibonacci6180 technique, your reading skill to chart will be greatly improved.
If you want to do day trading, please set the time frame to 5 minutes or 15 minutes, and you will see many of the low point of rising stocks.
If want to prefer long term range trading, you can set the time frame to 1 hr or 1 day.
