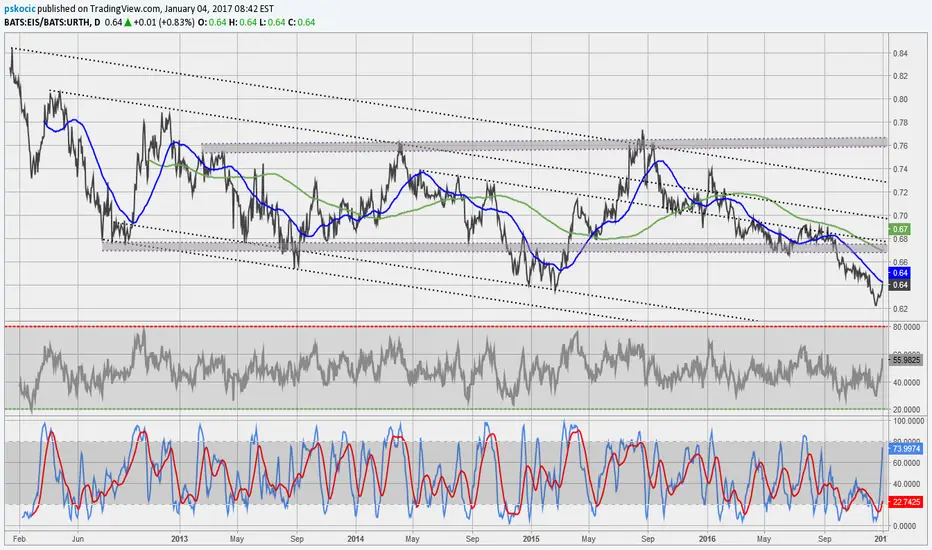
This is interesting...A noticeable trend divergence started November 2022, right after the elections...
Key stats
About ISHARES MSCI ISRAEL ETF
Home page
Inception date
Mar 26, 2008
Structure
Open-Ended Fund
Dividend treatment
Distributes
Distribution tax treatment
Qualified dividends
Income tax type
Capital Gains
Max ST capital gains rate
39.60%
Max LT capital gains rate
20.00%
Primary advisor
BlackRock Fund Advisors
Distributor
BlackRock Investments LLC
EIS was the first Israel-focused ETF on the market, and offers pure Israeli exposure, with 100% of its holdings traded in Tel Aviv. The fund tracks a capped version of our MSCI benchmark and caps its exposure to any one security at 25%. In the case of EIS, that means redistributing the extra weighting to other portfolio companies that would have gone to only one company. The result is a smaller-cap tilt, with an underweighting to health care, pumping up the fund's weighting to financials and basic materials. It tracks its index well and offers solid exposure for investors interested in the Israeli stock market.
Classification
What's in the fund
Exposure type
Finance
Technology Services
Stock breakdown by region
Top 10 holdings


Summarizing what the indicators are suggesting.
Oscillators
Neutral
SellBuy
Strong sellStrong buy
Strong sellSellNeutralBuyStrong buy
Oscillators
Neutral
SellBuy
Strong sellStrong buy
Strong sellSellNeutralBuyStrong buy
Summary
Neutral
SellBuy
Strong sellStrong buy
Strong sellSellNeutralBuyStrong buy
Summary
Neutral
SellBuy
Strong sellStrong buy
Strong sellSellNeutralBuyStrong buy
Summary
Neutral
SellBuy
Strong sellStrong buy
Strong sellSellNeutralBuyStrong buy
Moving Averages
Neutral
SellBuy
Strong sellStrong buy
Strong sellSellNeutralBuyStrong buy
Moving Averages
Neutral
SellBuy
Strong sellStrong buy
Strong sellSellNeutralBuyStrong buy
Displays a symbol's price movements over previous years to identify recurring trends.
Related funds
Frequently Asked Questions
An exchange-traded fund (ETF) is a collection of assets (stocks, bonds, commodities, etc.) that track an underlying index and can be bought on an exchange like individual stocks.
EIS trades at 1,602.88 MXN today, its price has risen 59.17% in the past 24 hours. Track more dynamics on EIS price chart.
EIS net asset value is 1,575.07 today — it's risen 10.28% over the past month. NAV represents the total value of the fund's assets less liabilities and serves as a gauge of the fund's performance.
EIS assets under management is 5.06 B MXN. AUM is an important metric as it reflects the fund's size and can serve as a gauge of how successful the fund is in attracting investors, which, in its turn, can influence decision-making.
EIS price has risen by 61.66% over the last month, and its yearly performance shows a 61.66% increase. See more dynamics on EIS price chart.
NAV returns, another gauge of an ETF dynamics, have risen by 10.28% over the last month, showed a −4.86% decrease in three-month performance and has increased by 55.77% in a year.
NAV returns, another gauge of an ETF dynamics, have risen by 10.28% over the last month, showed a −4.86% decrease in three-month performance and has increased by 55.77% in a year.
EIS fund flows account for 1.22 B MXN (1 year). Many traders use this metric to get insight into investors' sentiment and evaluate whether it's time to buy or sell the fund.
Since ETFs work like an individual stock, they can be bought and sold on exchanges (e.g. NASDAQ, NYSE, EURONEXT). As it happens with stocks, you need to select a brokerage to access trading. Explore our list of available brokers to find the one to help execute your strategies. Don't forget to do your research before getting to trading. Explore ETFs metrics in our ETF screener to find a reliable opportunity.
EIS invests in stocks. See more details in our Analysis section.
EIS expense ratio is 0.59%. It's an important metric for helping traders understand the fund's operating costs relative to assets and how expensive it would be to hold the fund.
No, EIS isn't leveraged, meaning it doesn't use borrowings or financial derivatives to magnify the performance of the underlying assets or index it follows.
In some ways, ETFs are safe investments, but in a broader sense, they're not safer than any other asset, so it's crucial to analyze a fund before investing. But if your research gives a vague answer, you can always refer to technical analysis.
Today, EIS technical analysis shows the strong buy rating and its 1-week rating is strong buy. Since market conditions are prone to changes, it's worth looking a bit further into the future — according to the 1-month rating EIS shows the strong buy signal. See more of EIS technicals for a more comprehensive analysis.
Today, EIS technical analysis shows the strong buy rating and its 1-week rating is strong buy. Since market conditions are prone to changes, it's worth looking a bit further into the future — according to the 1-month rating EIS shows the strong buy signal. See more of EIS technicals for a more comprehensive analysis.
Yes, EIS pays dividends to its holders with the dividend yield of 1.30%.
EIS trades at a premium (0.95%).
Premium/discount to NAV expresses the difference between the ETF’s price and its NAV value. A positive percentage indicates a premium, meaning the ETF trades at a higher price than the calculated NAV. Conversely, a negative percentage indicates a discount, suggesting the ETF trades at a lower price than NAV.
Premium/discount to NAV expresses the difference between the ETF’s price and its NAV value. A positive percentage indicates a premium, meaning the ETF trades at a higher price than the calculated NAV. Conversely, a negative percentage indicates a discount, suggesting the ETF trades at a lower price than NAV.
EIS shares are issued by BlackRock, Inc.
EIS follows the MSCI Israel Capped Index. ETFs usually track some benchmark seeking to replicate its performance and guide asset selection and objectives.
The fund started trading on Mar 26, 2008.
The fund's management style is passive, meaning it's aiming to replicate the performance of the underlying index by holding assets in the same proportions as the index. The goal is to match the index's returns.