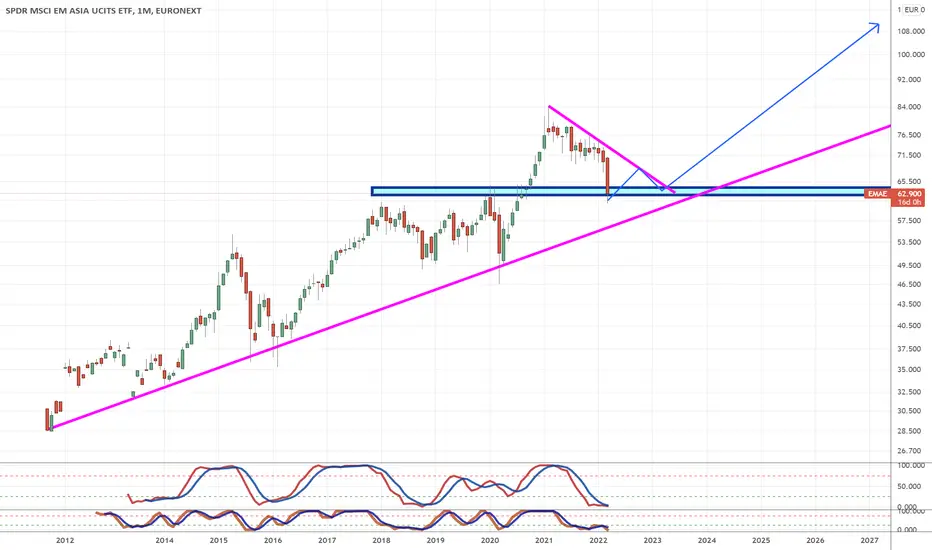
BULLISH CHINAAt this Point its time to INVEST IN CHINA
SL: 53
After a Big Correction its time to invest in the Future............. and the Future will be CHINA
Take advantage and the timing looks good for me.
Key stats
About SPDR MSCI EM ASIA UCITS ETF
Home page
Inception date
May 13, 2011
Structure
Irish VCIC
Replication method
Physical
Dividend treatment
Capitalizes
Primary advisor
State Street Global Advisors Ltd.
ISIN
IE00B466KX20
The objective of the Fund is to track the performance of stock markets in emerging markets in Asia.
Classification
What's in the fund
Exposure type
Electronic Technology
Finance
Technology Services
Stock breakdown by region
Top 10 holdings
Displays a symbol's price movements over previous years to identify recurring trends.
Related funds
Frequently Asked Questions
An exchange-traded fund (ETF) is a collection of assets (stocks, bonds, commodities, etc.) that track an underlying index and can be bought on an exchange like individual stocks.
EMAD/N trades at 1,635.51 MXN today, its price has risen 28.94% in the past 24 hours. Track more dynamics on EMAD/N price chart.
EMAD/N net asset value is 1,628.81 today — it's risen 6.88% over the past month. NAV represents the total value of the fund's assets less liabilities and serves as a gauge of the fund's performance.
EMAD/N assets under management is 18.31 B MXN. AUM is an important metric as it reflects the fund's size and can serve as a gauge of how successful the fund is in attracting investors, which, in its turn, can influence decision-making.
EMAD/N price has risen by 27.85% over the last month, and its yearly performance shows a 34.34% increase. See more dynamics on EMAD/N price chart.
NAV returns, another gauge of an ETF dynamics, have risen by 6.88% over the last month, showed a 0.40% increase in three-month performance and has increased by 29.18% in a year.
NAV returns, another gauge of an ETF dynamics, have risen by 6.88% over the last month, showed a 0.40% increase in three-month performance and has increased by 29.18% in a year.
Since ETFs work like an individual stock, they can be bought and sold on exchanges (e.g. NASDAQ, NYSE, EURONEXT). As it happens with stocks, you need to select a brokerage to access trading. Explore our list of available brokers to find the one to help execute your strategies. Don't forget to do your research before getting to trading. Explore ETFs metrics in our ETF screener to find a reliable opportunity.
EMAD/N invests in stocks. See more details in our Analysis section.
EMAD/N expense ratio is 0.55%. It's an important metric for helping traders understand the fund's operating costs relative to assets and how expensive it would be to hold the fund.
No, EMAD/N isn't leveraged, meaning it doesn't use borrowings or financial derivatives to magnify the performance of the underlying assets or index it follows.
No, EMAD/N doesn't pay dividends to its holders.
EMAD/N trades at a premium (1.07%).
Premium/discount to NAV expresses the difference between the ETF’s price and its NAV value. A positive percentage indicates a premium, meaning the ETF trades at a higher price than the calculated NAV. Conversely, a negative percentage indicates a discount, suggesting the ETF trades at a lower price than NAV.
Premium/discount to NAV expresses the difference between the ETF’s price and its NAV value. A positive percentage indicates a premium, meaning the ETF trades at a higher price than the calculated NAV. Conversely, a negative percentage indicates a discount, suggesting the ETF trades at a lower price than NAV.
EMAD/N shares are issued by State Street Corp.
EMAD/N follows the MSCI EM Asia. ETFs usually track some benchmark seeking to replicate its performance and guide asset selection and objectives.
The fund started trading on May 13, 2011.
The fund's management style is passive, meaning it's aiming to replicate the performance of the underlying index by holding assets in the same proportions as the index. The goal is to match the index's returns.