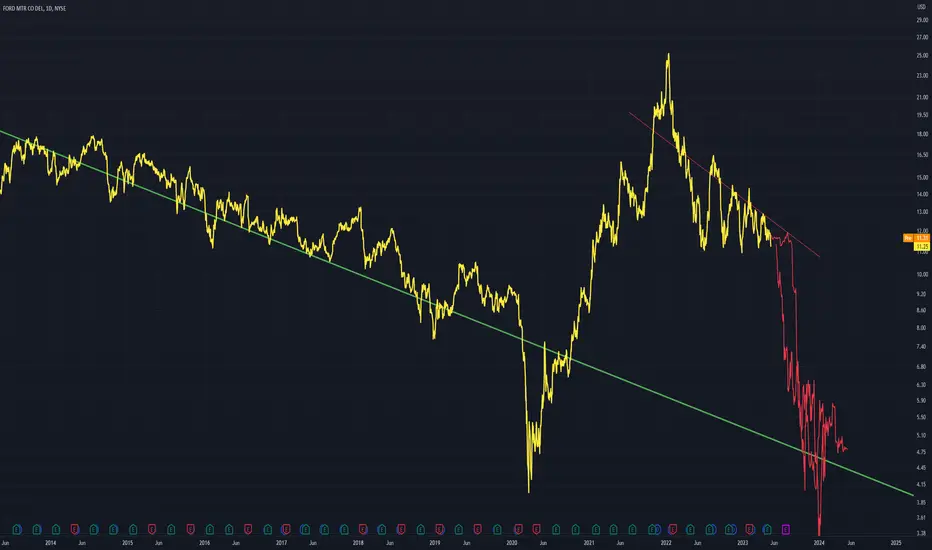
Ford: Fake Out, heading to $6-8Ford with the fake breakout on the heels of the TSLA deal. Likely heading to the $6-8 region by late 2023-early 2024, then I will buy in that region for the move up to new ATHs.
F trade ideas

Ford Motor Company (F) - Multi Pattern AnalysisCompany: Ford Motor Company
Ticker: F
Exchange: NYSE
Sector: Consumer Discretionary
Introduction:
Today's technical analysis takes a look at Ford Motor Company (F), a prominent player in the Consumer Discretionary sector, listed on the NYSE. A complex formation is unfolding on the weekly chart where a long-term Head and Shoulders pattern encounters a shorter-term Descending Triangle. This unusual setup, featuring a recent breakaway gap, may suggest a bullish trend reversal.
Head and Shoulders & Descending Triangle Pattern:
A Head and Shoulders pattern typically signals a trend reversal from bullish to bearish, while a Descending Triangle is usually seen as a bearish continuation pattern. However, in this unique scenario, the right shoulder of the Head and Shoulders pattern, which is longer than the left, has morphed into a Descending Triangle, creating a complex setup.
Analysis:
Ford's chart shows a clear Head and Shoulders pattern, with the Descending Triangle making up the right shoulder. The triangle has five touch points on the upper boundary and three on the lower. The support of the descending triangle coincides with the support of the head and shoulders.
We've noticed a breakaway gap which indicates a bullish breakout from the descending triangle. Currently, the price appears to be attempting a break above the 200 EMA. If we witness a weekly candlestick close above the 200 EMA, we could interpret this as a transition into a bullish environment, presenting a potential long position entry.
The price target is set at $18.65, representing an approximately 49% rise from the breakout level. Notably, a minor resistance might be encountered at $16.69. A breakout above this level could also signify a failure of the Head and Shoulders pattern, warranting a recalculation of the price target.
Conclusion:
Ford's weekly chart offers an intriguing setup for classical price pattern traders. The unusual combination of a Head and Shoulders pattern and a Descending Triangle, alongside a recent breakaway gap, might indicate a potential bullish reversal.
This analysis should form part of a comprehensive market research and risk management strategy. Please remember, this is not financial advice, and investing always involves risk.
If you found this analysis helpful, please consider liking, sharing, and following for more insights. Wishing you profitable trading!
Best regards,
Karim Subhieh

F: "F" represents a "F"alling wedge patternA price action above 11.50 supports a bullish trend direction.
Increase such exposure for a break above 12.50.
The target price is set at 13.00 (the objective of the falling wedge pattern).
The stop-loss price is set at 11.50.
Remains a risky trade.

F,10d+/15.42%rising cycle 15.42% more than 10 days.
==================================================================================
This data is analyzed by robots. Analyze historical trends based on The Adam Theory of Markets (20 moving averages/60 moving averages/120 moving averages/240 moving averages) and estimate the trend in the next 10 days. The white line is the robot's expected price, and the upper and lower horizontal line stop loss and stop profit prices have no financial basis. The results are for reference only.

How to Trade Bearish Engulfing PatternsHow to trade bearish engulfing patterns with entries and stop levels.

Ford consolidationFord consolidation is at consolidation phase, it might break the resistance and move upward

F - Drop To Above Trend Line Price is currently in a downtrend and looking to move further down.
I suggest that price hits this strong trend line that I have drawn, as it has done in the past.
Bars pattern shows my thoughts
Sit and waitFord has been in this pennant for the past couple months, dating back to June 2022. Which means that whatever move we get out of this pennant will be big. Using the $11 mark as a very strong support and the blue trend line as a resistance, there have been no breakouts from this pennant. On the monthly we can see tremendous support at the $11 mark with both the 50 and 200 ma acting as a support, however price action really has not made up its mind. The weekly chart as of recent has seemed bearish with higher bearish volume than bullish volume
Remember, price action is more keen to follow the trend as opposed to reverse. As of now we are still in a downtrend. Will we reverse? Will we break below and fall? Only time will tell. If we fall I see price falling to $9, if we reverse I see price going to $15. Better now to sit on cash and wait for price to tell us what directional play we should get into.

Ford had some poor choice of words about certain religionsFord had some poor choice of words about certain religions. But the chart looks good.

$F - Descending TriangleThe bears have been able to drive this market downwards at steadily lower up swings. And conversely, the bulls have not been able to drive this market past its previous swing highs since August 2022.
Although this chart pattern and price action behavior is suggestive of bearish dominance in this market. Although the price is trading below the key EMAs. The longer time frames and the RSI bullish divergence formed from July to October 2022, does not allow us to jump into conclusions as to how to form our bias.
More important perhaps than forming our bias here, is to register how neatly this pattern is being formed, from volatility to the lack of it. To the extent that the price is now trading in a very narrow range. To the extent that a breakout with conviction in either end of the triangle, now, will be a revealing signal of where this market wants to go.
Despite the sensation of control that any sort of analysis might lend you, please note that the future is unknown. For this reason, risk management is the real name of the game here. Remember to keep your positions small and dispersed.
Cheers,
Tenacious Tribe - Backtested Trading Strategies & Studies
50% discount on all of our products, in our website, with the following code:
MOX Q3C WXRX

F Surprised on Earnings Ready for Rising PriceFORD ( F) significantly surprised on earnings no matter that a recession may be underway and
no matter its balance sheet is saddled with debt which is increasingly more expensive to
services. Pre-orders for the Lightning F -150 are strong. On the 2H chart, price has yet to
react to the earnings surprise. Volume has picked up but nothing dramatic. The zero-lag
MACD lines have crossed under the histogram and are now crossing over the zero line.
Price in a sign of strength rose out of its Fibonacci band channel and is just below the
anchored mean VWAP while at the uppermost portion of the high volume area of the volume
profile. I see this as a good place to take a long position targettting $ 12.80 to 13.00
with a stop loss at $ 11.80 below the POC line of the volume profile.

FORD MTR Target $9.5A descending triangle coupled with some negative reports and fundamentals could see FORD MTR re-test previous support at 9.5

Ford dips below $11 continues to attract buyers.Ford - 30d expiry - We look to Buy at 11.15 (stop at 10.55)
Levels below 11 continue to attract buyers.
11 continues to hold back the bears.
We look to buy dips.
With signals for sentiment at oversold extremes, the dip could not be extended.
Early pessimism is likely to lead to losses although extended attempts lower are expected to fail.
Our profit targets will be 12.77 and 13.07
Resistance: 11.95 / 12.50 / 13.15
Support: 11.44 / 11.00 / 10.61
Please be advised that the information presented on TradingView is provided to Vantage (‘Vantage Global Limited’, ‘we’) by a third-party provider (‘Signal Centre’). Please be reminded that you are solely responsible for the trading decisions on your account. There is a very high degree of risk involved in trading. Any information and/or content is intended entirely for research, educational and informational purposes only and does not constitute investment or consultation advice or investment strategy. The information is not tailored to the investment needs of any specific person and therefore does not involve a consideration of any of the investment objectives, financial situation or needs of any viewer that may receive it. Kindly also note that past performance is not a reliable indicator of future results. Actual results may differ materially from those anticipated in forward-looking or past performance statements. We assume no liability as to the accuracy or completeness of any of the information and/or content provided herein and the Company cannot be held responsible for any omission, mistake nor for any loss or damage including without limitation to any loss of profit which may arise from reliance on any information supplied by Signal Centre.

Ford to sub $5Legacy autos with large debt and high interest rates will be highly susceptible in a recession. Ford is also losing billions in their attempted transition to EVs and will continue to do so for the foreseeable future. Technically, there is a massive head and shoulders with lower high after lower high on the right shoulder.
(Trade Idea)
Enter Short: $12.85.
Stop loss: $13.20.
PT: $4.52.
R/R: 1/23.8
Estimated hold time: 3-12 months.
Not financial advice.

Ford to ~$9.05Ford looks like it's continuing to try to break the floor, with lower highs and retesting the recent lows made. It's only a matter of time before it can't float any higher and drops right through the floor.
I give good chances to ~$9.05. We'll see.

F Ford Motor Car Company - Trade IdeaThe Chart of the Week is: "F" Ford Motor Car Company
From a technical perspective we have a textbook WEDGE pattern formed.
Continuous pressure could lead to a breakdown offering us a SHORT play.
While it has NOT triggered yet, I'm offering you this idea for your watchlist.
A weekly settlement below 10.62 by 1% or more, would trigger a SELL.
A stop should be placed above the last swing high before the breakdown.
Multiple downside targets have been indicated for your consideration.
Upon taking profits, your stop loss should be advanced at the same time.
I hope this helps you should "F" offer us the opportunity to SHORT it!

$F (Ford Motor Company) Put Option IdeaAnd here is my first published stock option setup and we have Ford Motor Company. Now as you all can see, I am using heiken ashi candles instead of the regular candles.
In my Wyckoff and Supply/Demand studies, I tested out the heiken ashi and my results were amazing. They eliminated a lot of the noise and I was able to see where price is heading much better. I also added the RSI 14 to give me an extra confluence.
Now I must say that I have to be careful since heiken ashi candles usually open at the midpoint of the previous candle. It may be wise to open a split screen with the regular candles just to have a look at where price really is.

FordHead and shoulders break below 12.10.
Stop loss 12.25
1st target - gap close 11.60
Last target - 11.15

Bearish on Ford stock its looking like a bearish scenario for ford, this is just my idea. Wandering if anyone has another opinion?

Crashhhhh!The stock has been consolidating in a Triangle for quite some time now and it's completing leg "e" of the triangle. We are preparing to short the stock.

FORD Stock Chart Fibonacci Analysis 041723Trading Idea
1) Find a FIBO slingshot
2) Check FIBO 61.80% level
3) Entry Point > 12.7/61.80%
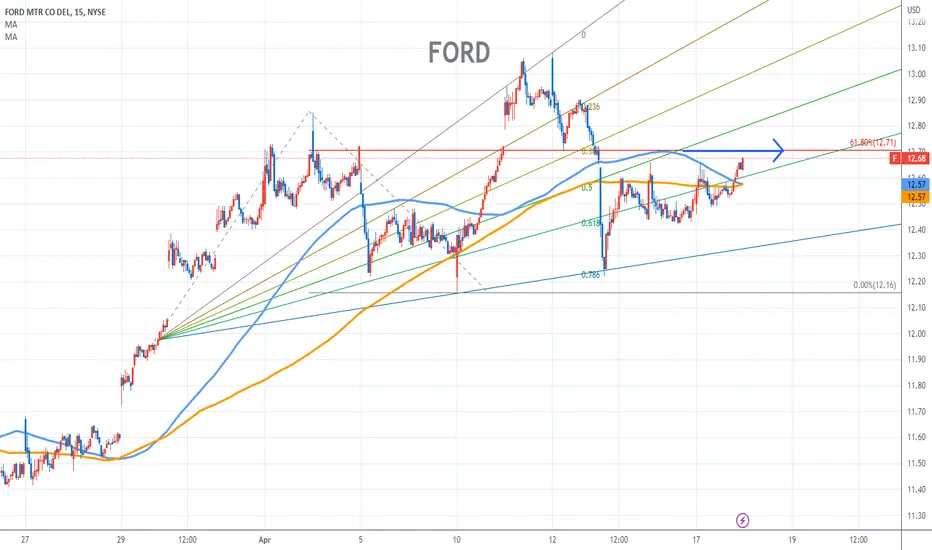
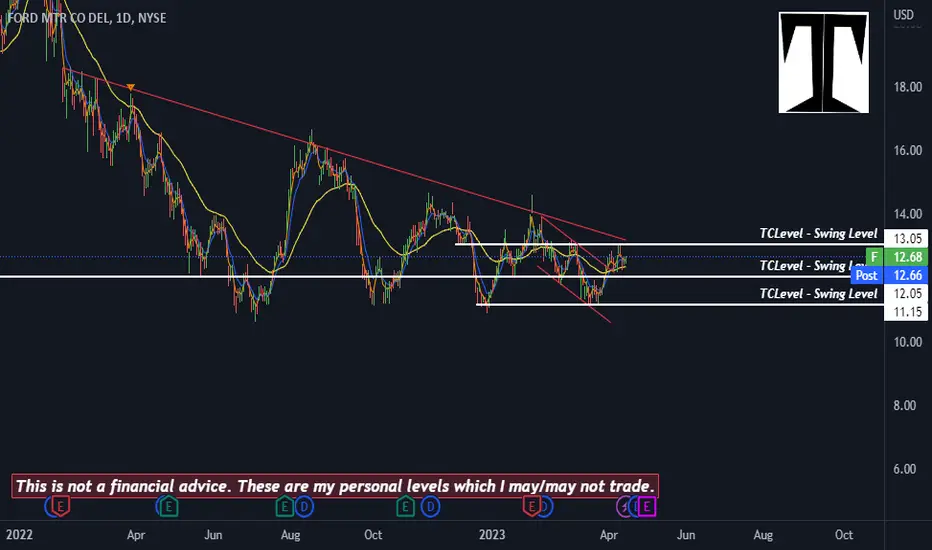
Chart Update : FORD ($F)The short term downtrend channel was broken without a new relative high.
The possible breakout is not yet completed.
Fast EMAS are on the right order and the breakout may happen soon.
It will work out even with the breakout of the longer term channel.
FORD text book flag at bottomwe know how to play this, all we need is a bit of patience...
breaks the flag up and we go all in
