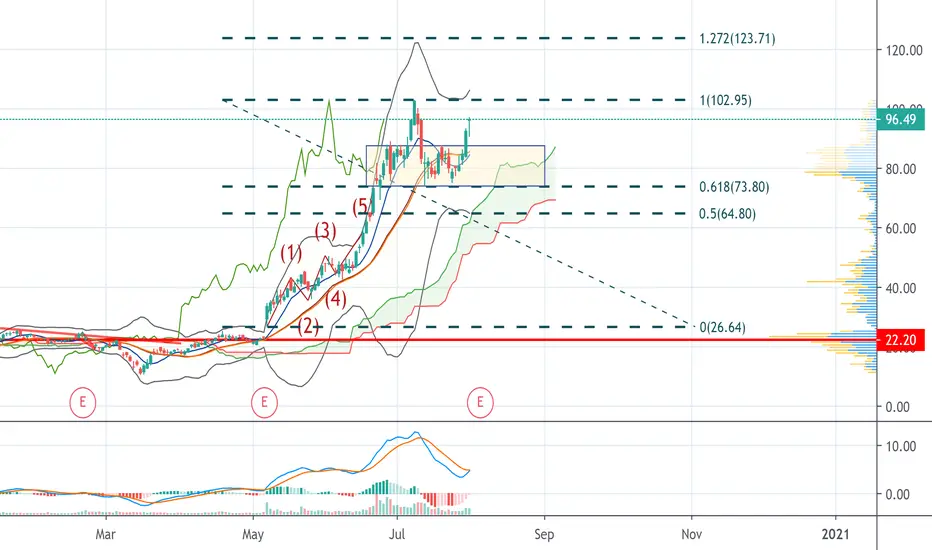
FLSYPushed out of the box after trading sideways. Earnings this Wednesday after close. MACD cross in works for more upward move. 100,102.95, then 123. 87 Should act as good support
FSLY trade ideas
FSLY LONG to $103We broke first resistance at $95.25. Looking for the break of $97.10 before the long to $103. Now if we break under $95 then short to $90.


bullish candles fslyDragonfly Doji on daily chart and reversal on weekly says will probably push for next wave up on the earnings this week

Fastly more downsideStill think spike is a corrective move because of how the structure looks. Watching for a 5 wave impulse and 3 wave correction to turn bullish


FSLY updateThink we are in a triangle right now to finish out a b wave. Watching to see if breaks above ~88 to start looking more bullish.

FSLY C waveClose to my double bottom target in previous video but I'm leaning towards further correction to see that double bottom or ~70 at this point. Will turn more bullish if this move up turns into a 5 wave and breaks above ~85

FSLY - Holding strong at 76 to 78 - Trade sideways until ER ?FSLY is finding support at 76 - 78 level so far.
ER is on Aug 5th. Looks like it is going to trade sideways all the way upto ER, assuming 76/78 support still holds good.

Possible Parabolic ArcLooks Parabolic to me. I was in this one a few weeks ago and I do know it is as volatile as a volcano! The tail candle wick has already dipped close enough to the 38% level, but these patterns can fall 50 to 60% of their prior high in correction mode.
The low is 10.63 and the high is 102.95
I did the math in my head so the numbers may not be exact to the penny, but neither is technical analysis..LOL
This is a strong stock and may have fallen as much as it is destined to fall
Be safe

Possible Head and ShouldersAs majority of the Tech companies are being pulled back after continuing to break new highs, we are seeing bull flags or a head and shoulders patterns starting to form. Overall still bullish for FSLY as we are still in the middle of Covid-19 where these kinds of tickets thrive. 👍
Play invalid if we show strong rejection @76.87 and break above @88.11


FSLY moving towards a C waveI think the B wave is in ~88. Expecting more correction at this point for a C wave.

FSLY looking for a top in wave bFSLY still looking like a corrective move at this point. Still think a higher wave b then move towards a lower then 74 C. Could be that its overall corrected but not my most likely count right now.

Will $FSLY Continue the Uptrend?Fastly price action is currently sitting on support at 78.
It is also nicely sitting on a 20-day moving average support.
Short term trend so far is still intact. Midterm and long term trend is still bullish. Fastly is on healthy correction.
Interesting to note is a major support at 76.44. The probability of going down its support may be low as selling pressure has been reduced as can be shown in its decreasing volume.
A break out of its resistance at 81.63 and 87.77 are good signs to continue its uptrend. The catalyst of this breakout could be good earnings EPS revisions in Aug 2020 as it projected to have 41.27% EPS revision 12/20 FY and 50.91% 12/2020 FY.
Fundamentally, $FSLY quick ratio is 4 which is better than 91.42% of the industry, 85% better than S&P Companies and 87% better than US markets. Its Current ratio is 6 which is better than 94.89% of the industry.
Forward PE is surprisingly better than 93.39%of the industry; 99% better than SP500 and US markets.


FSLY - WSB DarlingDont hold the bag on this. Red levels if you want to short or if you wanna take profits. Green probably the only level I would buy a leap at.


FSLY wave Bbased on movement today I'm leaning toward A being in and looking for slightly higher B at this time


