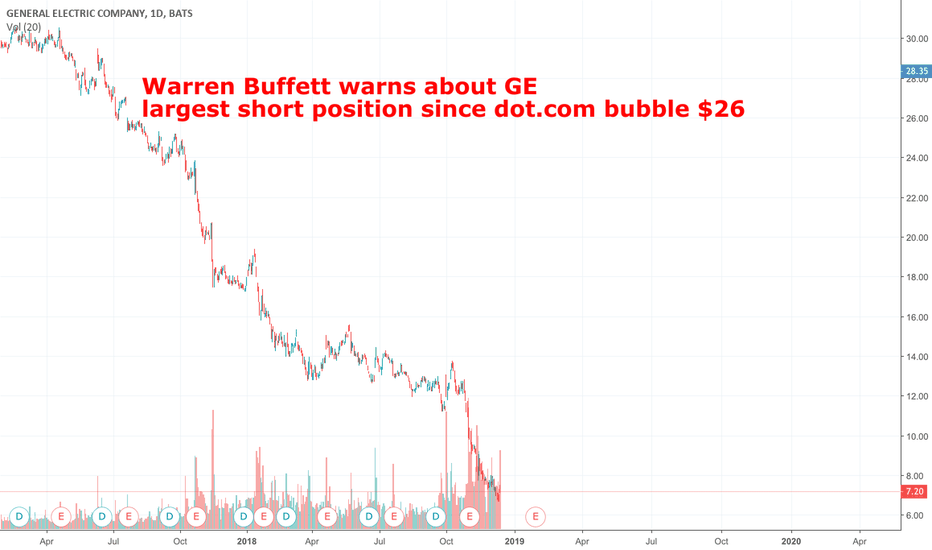
LONG IDEIA , LOW RISK ASSOCIATED I RECOMMEND TO BUY , YOU HAVE LOW RISK ASSOCIATED WITH HIGH RETURNS.Longby AntonioFACPublished 112
GE rebound?GE is right on a BIG supporting trendline, reversal in the move? Lets see.. Happy tradingLongby nDamPublished 4
GE HIT LOWS, NOW IS THE TIME TO GO LONGI really think that the bashing of GE is now over, the last time this stock was at these lows was in 2008 which was a blood bath, and 1984, as much as cash flow issues as they have had, the new CEO has a lot of work a head of himself. Here is the reality, and Investment in GE Is an investment in America, and say what you want about the tariffs, the trade war, the FEDS raising their rates, we are strong. GE will move back, only a short time. Longby PolarBearforecasterUpdated 4
The FUTURE High / Low price swing dates for GEThese are the FUTURE dates for GE (General Electric) with the highest probability for experiencing a price swing high or low. Apply your own indicator(s) to determine the price swing direction. The Djinn Predictive Indicator is for sale. Monthly, weekly, daily, 4 hour, 1 hour and 15 min predictive equations included in the sale. Price: 10,000,000 XRP. Bitcoin or Fait not accepted for payment. I will reluctantly accept Monero. If the payment is made in Monero the price is double the 10,000,000 XRP asking price.by DinjinPublished 2
Matthew R. Kratter's "Rubber Band Stocks" 2nd EditionI describe this strategy in my Kindle book "Rubber Band Stocks"by Trader-UniversityPublished 0
Is GE Open Interest tipping the hat?Noticed that Dec 21, $10 calls have an open interest of over 90k! Last time I saw that much option at one price point was at the end of October for $10.50 puts, and look how that turned out. Someone out there feels pretty confident, and at $0.02 it is cheap enough for me to follow the crowd again. Longby sancheasPublished 225
GE Monthly BounceGood potential for a squeeze not a day trade looking to hold for a while. "GE said the plans, which follow its ongoing strategic review, will mark a shift in focus towards its power, aviation and renewable-energy businesses and create "a simpler, stronger, leading high-tech Industrial company". This is going to occur in the next 12 to 18 months (news came out this june). Revenues in healthcare/aviation have been strong for GE.Longby NastyPipzUpdated 7
GE Short Squeeze Historical LowsThis one is fairly self explanatory, regardless of the massive debt crunch that GE is facing, its important to note how these historical lows and historical resistance levels play into the price action and volatility. The people who buy when others are most fearful are the real winners in financials. Can you imagine buying ford at the end of 2008? Would have been scary in the moment, but would have also allowed massive gainsLongby CryptoCrusaderPublished 5
Let the dogs fightBuyers have not had much of a leg to stand on. Some buyers tried to catch a bounce upon retesting DTL from the upside however were quickly taken out. I expect there to be another wave of buyers at HR1 likely stronger than the last which could pull us back to the DTL. After that I believe there is a high probability of forming an overall P5 but prices may trickle down below our previous P4. I will be sitting out and watching, allot of pain happening in this market.by DKMartelPublished 6
$GE Monthly bounce back up soonMonthly bounce expected to at least $10,00 My next $GE - Next target is $10,50 40% upside potential. NYSE:GELongby BlueDimeInvestmentUpdated 664
$GE Medium Term OutlookGE looks finally at the bottom (Approaching lows from March 2009) Selling volume on a steady decline Bottoming of MACD looks like it's in and attempting to crossover RSI on a slow and steady incline from oversold territory I would start laddering in buys as GE is a slow horse with the potential to see very slightly more down, but the bottoming signals are definitely there Longby Matewan3291Published 4
$GE Low Timeframe Knife Catchhigh risk trade right here, but this could be the start of painting a bullish divergence reversal on the daily. lets see where it takes us or if bull can push through thisLongby WafflesDxbPublished 1
GE to buy or forget aboutIt' interesting to find out the value by (SUM OF PARTS)by sermanPublished 112
GE - Pressure remains on to the downside!Updated chart shows GE is still in downtrend. Reiterating target of $8. On March 21, 2018 I posted: As the saying goes “the bigger the drop, the bigger the need for repair.” Ex - all items, GE’s cash flow has not grown since 1994. Just back 3 - 4 years ago GE -1.24% was producing ~ $24 billion in cash flow. Using Basel III 2.27% agreement TCE ratios, GE -1.24% is underfunded by ~ $53 billion as of 3rd qtr. 2017. Assets need to be sold and equity add to the books! Valuation: Using ex-item numbers, GE -1.24% produced ~$ 8.5 billion in cash flow for 2017. Applying a generous 2% growth rate the Intrinsic Value Buy price is $6.50 and a Sell at $16. Target of $8. by The-Trend-is-the-FriendUpdated 4
GE shares show a lack of demandGE shares have trended down all year with a lack of demand. The stock price reflects the troubling fundamental picture. Shares will stay under pressure until this theme reverses.by LucasDowneyPublished 2
Look at this Monthly. $GERsi is in the teens on the monthly. Divs if we bounce here Macd looks like sh!t But my oh my is this bottoming out. i doubt the ones calling $6.00, anything around that 8.00 flat is pay dirt. Longby DontbethatguyPublished 4
This indicator SAVED YOU HUGE on GEBuy Green Sell Red // it's mainly for swing trading, i use the 3 day / 15 day / monthly charts with it and it works perfectly, // it works good for stocks and cryptocurrency. // you will use heiken ashi chart style and turn on the EMA DOTS indicator. once the indicator is on you will hide the heiken ashi so you only see the dots. // when a green dot -0.78% -6.68% -7.44% -7.44% appears you buy, if a green dot -0.78% -6.68% -7.44% -7.44% appears after that green dot -0.78% -6.68% -7.44% -7.44% you hold your investment. if a red dot appears you sell your position. easy as that. // the standard dots setting will be set to 10 - use this for any chart above 3 days change the dots setting to 6 for 3day charts and below // shorter time frames will be choppy. // larger time frames will be smooth. // *Daytrading smaller timeframes is possible but not recommended.by UnknownUnicorn2319099Published 4411
GE expected bounce to 9 - 10.5 to make new small top THEN!!Since quite time and very bearish style was applied for this share . it is possible to extend decline up to 5.5 or below but as its big share the process will take some time .. now at 7.99 we expect bounce to form new fresh top between 9.0 and 10.5 then suggested to continue down trend to achieve lower supportsby WinnerTrader99Published 0
GE looks fucked to meGE is pretty fucked. Broke the long term trend line this summer. Has been tanking ever since. So long GE, it's been nice knowing you. I might buy some in the $5.76 to $6 range to take advantage of the "double bottom" false rally. Expect to sell the rally at $12-14. SL is the you're fucked box. Stop loss @ $5.60 (assuming you buy at or under $6. Then will continue trend down to bankruptcy.Shortby jdharwardPublished 229
General Electric Set For A Bounce On Monster Support! (GE)Hi friends! Welcome to this analysis on General Electric! Let's get right to it! Looking at the weekly GE chart, you can see that the stock has been in an absolute state of collapse, since early last year. However, the technicals are getting VERY interesting. Looking at the chart, you can see a pink rising trendline that is coming in form the left side of the chart. That trendline actually begins in the early 1980's, and it is the lowest extending rising trendline in play on the chart. Additionally, you can see that this trendline corresponds with the low made in 2009, during the great recession. So, the stock price is reaching historically critical levels right now. What I'm interested in is a bounce play here. There is a bit more downside, before GE actually reaches the rising pink trendline (around $7.40) but a significant bounce could follow. There's a nice bullish divergence on the MACD, indicating that the selling momentum is in an exhaustive phase. That's really nice to see as price inches towards this critical support level. As I said, I'm a technical buyer here, on a touch of the pink trendline, with a stop down around the $7.20 level. That's a risk of about 20 cents, with an upside potential of $3.10. If you'll notice, there was a pivot low in late June of 2009. That low was at $10.50, and I believe that could act as significant upside resistance here. The 20 EMA (in blue) has acted as powerful resistance since 2017, and it's currently plummeting toward the $10.50 trendline. So, if we do rally from here, I think there is a high probability that the 20 EMA will be converging with the $10.50 level, around the same time that the stock price would be getting there — perhaps by December or January. That would increase the $10.50 handle as a powerful resistance, and that would be the best time to exit the trade. Good luck everyone. I'm the master of the charts, the professor, the legend, the king, and I go by the name of Magic! Au revoir. ***This information is not a recommendation to buy or sell. It is to be used for educational purposes only.*** -JD- by MagicPoopCannonPublished 9975
OPENING: GE JAN 18TH 9 SHORT STRADDLESelling bullishly skewed premium in the beaten down GE with the possibility of an assignment of shares with a cost basis of 7.33/share (a 9.5% discount over current price). Filed for a 1.67/contract credit. Metrics: Max Profit: $167/contract Max Loss/Buying Power Effect (On Margin): Undefined/$171/contract Break Evens: 7.33/10.67 Delta: 23.23 Theta: 1.09 Notes: Fairly rare to get a credit approaching your buying power effect ... . Longby NaughtyPinesUpdated 7