GE LONG TERM BUYhas potentially compleated a very large correction and started an impulse up to create new ath
GE trade ideas

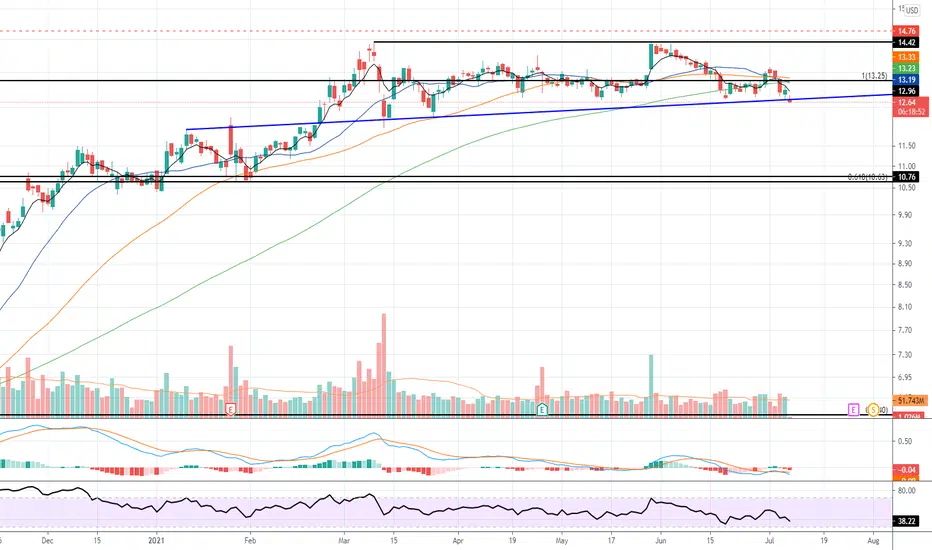
General Electric Isn’t Breaking OutGeneral Electric rallied sharply between last October and March. But it’s failed to break out and could now be at risk of rolling over.
The first pattern on GE’s chart is the double-top around $115 in March and May.
Next, the industrial stock slipped under its 100-day simple moving average (SMA) in early July and has stayed this since. That line appears to be turning into new resistance.
Third the 8-day exponential moving average (EMA) is on the verge of crossing below the 21-day EMA.
Next, consider the trio of higher lows near the rising 200-day SMA. This would typically be viewed as a bullish ascending triangle. But given weakness in the broader industrial space and GE’s long-term bearishness, there could be a greater risk of this pattern resolving to the downside.
TradeStation is a pioneer in the trading industry, providing access to stocks, options, futures and cryptocurrencies. See our Overview for more.

Long $GE CMP $105.94Long $GE CMP $105.94. Repeating trendline breakout pattern. Possible target $115.25


GE swings both waysStock just failed at the 105 resistance, so it'll probably fall to support around 90. Then you can go long between 80 and 90 and hold up to 130ish. Assuming the Boeing 737 Max issues are resolved shortly, you'll see a quick move up.

$GE - Rectangle breakout watch. Good $115 - Best $135 - Bad $95GE is trading inside a rectangle. The rectangle or side way channel can resolve upward or downward.
Break above $115 is bullish. Break below $95 is bearish.
Breakout point - $115
Mid way resistance - $107
Good Case - $115
Best case - $135
Bad case - $95
———————————————————
How to read my charts?
- Matching color trend lines shows the pattern. Sometimes a chart can have multiple patterns. Each pattern will have matching color trend lines.
- The yellow horizontal lines shows support and resistance areas.
- Fib lines also shows support and resistance areas.
- The dotted white lines shows price projection for breakout or breakdown target.
Disclaimer: Do your own DD. Not an investment advice.

GE Short, and buy the dipI got GE in meditation yesterday. I think I've gotten it before long ago. Anyway, turns out they have earnings tomorrow morning.
My dowsing and intuitive methods suggest price action as up and then choppy to down for potentially a week. I "heard" to $11 and my dowsing gives $10.75ish. It's pushing 12.95 into the close.

GENERAL ELECTRIC:DETAILED FUNDAMENTAL ANALISYS-LONG SCENARIO 🔔General Electric was once a massive power producer. Back in 2017, turbine manufacturing was the company's biggest business. Then it all went downhill.
A turbine design defect (now fixed) forced potential power producers to put their purchase plans on hold. And then clean natural gas power began to lose its popularity as alternatives to solar power became more affordable. GE's energy turbine revenues are now down to about half of their peak levels. This decline in sales has further trimmed the company's bottom line of profits.
Investors should pay attention to the fact that the company is changing. This could be an indicator that GE's once-great energy business is slowly recovering.
Of course, it's hard to distinguish between organic growth driven by increased demand and growth that is merely the mathematical result of last year's COVID-19-induced outages. For most companies, it's probably a mixture of both.
For General Electric's power turbine business, however, it will likely be organic growth. Utility companies plan million-dollar investments years in advance and then maintain the purchased turbines for 20 years or more. The difficulties associated with time constraints designed to keep consumers at home are not a major hindrance to the power generation industry.
Knowing this fact helps put the chart below in the right perspective. Last year's modest orders and revenues for GE's power division are not the result of the spread of the coronavirus.
Rather, business began to decline in 2018 when several turbine blade failures took out too many GE-made gas turbines. General Electric quickly began responding, but its institutional customers were reluctant to do so until it became clear that the company's turbines would not fail for a long time.
It's also naive to ignore the fact that around the same time that GE turbine blades began to fail, alternative energy sources were undergoing a real revolution, leading to a shift away from old technology and toward investment in cleaner, greener technologies. According to IHS Markit, the rate of annual photovoltaic panel installations more than doubled from 2015 to 2019, more than doubling global solar power capacity, according to the International Energy Agency. It would be surprising if General Electric's energy business didn't face obstacles.
But take a closer look at the chart above. Specifically, note the fact that, at least, energy business revenues and orders stabilized in 2020 - despite the turbulence - during the recently ended quarter. Equipment orders also improved significantly in two of the last three quarters. That's a subtle hint that things are changing for the better, even if most investors don't see it yet.
Of course, not losing ground is not necessarily the same as growing, and frankly, it could be years before GE's energy division approaches its glory days, when revenues of $8 billion and quarterly profits of a few hundred million dollars were the norm.
But don't be too quick to dismiss the potential of this part of the company's business for several reasons.
Foremost among them is that, as reliable as solar power is, it still faces the problem of a lack of overnight power generation. This problem is solved quite effectively with battery-based energy storage. However, this solution still lacks the "instant-on" capability that most power producers need, especially in the extreme heat of summer and the bitter cold of winter. A multifaceted power generation portfolio using all available options seems like the most plausible future.
The second reason to expect demand for natural gas turbines in the foreseeable future is that the world is simply not ready for such a leap. In a long-term market forecast released last year, the U.S. Energy Information Administration predicts that by 2050, 36% of the nation's electricity will be generated by natural gas, just 1 percentage point less than 37% currently.
That's despite the fact that renewables will likely double their current share of the nation's electricity production from 19% to 38% over the same 30-year period.
And to the extent that there will be pressure for clean energy, GE's gas turbines can be made to run on hydrogen, which can be produced with minimal impact on the environment and - ultimately - produced economically. The company believes that all of its turbines can run on pure hydrogen within a few years, making the issue of natural gas's environmental impact moot.
The fact of the matter is that it all shows up in numbers that the company tacitly discloses. As of the end of June, GE's backlog of energy equipment and services totaled $71.8 billion.
That's more than four years ahead, not counting the new contracts signed during that time.
Investors expecting GE's energy business to blossom overnight will be disappointed. The company's customers are not fast-moving consumers. Rather, they are corporations that can take months to decide to shell out millions for new equipment.
But for long-term investors, the electric power industry offers an undervalued growth opportunity that is on par with GE's renewable energy and aviation businesses. This reinforces an already bullish position based on consistent cash flow growth, even if the company is slightly riskier than the average blue chip

$GE with a Bullish outlook following its earnings #Stocks The PEAD projected a Bullish outlook for $GE after a Positive over reaction following its earnings release placing the stock in drift B
If you would like to see the Drift for another stock please message us. Also click on the Like Button if this was useful and follow us or join us.

gewatching the inflow into industrials and metals today
this is my top pick for the industrial sector
money is rotating
so we flow with the waves.
w5 target = $17

GE singnals long for next yearsGeneral Electric moves to the alternative electric technologies and break out weekly MA 200.
This is good signal and start of the feature run.
Good point to enter on retracement to the $10.75-12.35 levels with first target at $20 and $26.8

General Electric - Lets rise and shine!-Potential 14% rise!
-Following the trend-line perfectly
-Shares of General Electric Co. GE, +1.74% shot up 4.0% in premarket trading Tuesday, after the industrial conglomerate reported second-quarter profit and revenue that beat expectations, and surprisingly generated positive free cash flow.
-On a net basis, the loss per shares narrowed to 14 cents from 26 cents, while excluding nonrecurring items, GE swung to adjusted earnings per share of 5 cents from a loss of 14 cents to beat the FactSet EPS consensus of 3 cents.
-Revenue rose 9% to $18.28 billion, above the FactSet consensus of $18.14 billion. Industrial free cash flow was about positive $400 million, compared with the FactSet consensus of negative $338.3 million, and the company raised the 2021 FCF guidance range to $3.5 billion to $5.0 billion from $2.5 billion to $4.5 billion. Among GE's business segments, revenue for Aviation rose 10% to $4.84 billion, but was below the FactSet consensus of $5.16 billion;
-Healthcare revenue grew 14% to $4.85 billion, well above expectations of $4.30 billion; Power revenue rose 3% to $4.30 billion to top versus expectations of $4.09 billion and Renewable Energy revenue jumped 16% to $4.05 billion to exceed expectations of $3.87 billion.
-"Momentum is building across our businesses, driven by Healthcare and services overall, with Aviation showing early signs of recovery," said Chief Executive Lawrence Culp. GE's stock has run up 19.6% year to date through Monday, while the SPDR Industrial Select Sector ETF XLI, -0.57% has gained 17.0% and the S&P 500 SPX, -0.61% has advanced 17.7%.

GE BIAS: UPInverted H & S pattern, due to buyer volume increase, expecting the price to break up the resistance ahead, Make sure to apply SL and TP.

"Complex" Head and Shoulder Bottom forming on GE Weekly Chart?Good morning all!
MY thoughts are that Larry Culp's turn around efforts are beginning to bear fruit. With a good earnings report and outlook I feel that this could push GE into breaking out of an inverted H&S bottom and begin moving up. I'm using T. Bulkowski's pattern probabilities from his "Encyclopedia of Chart Patterns" as a guide and added a few thoughts of my own.
I welcome any and all discussion, Bulls OR Bears.
Big Poppa


GE Bias: UpIn lower timeframe the price has entered ranging market, buyer came in, potential short term buy trade. Make sure to apply set loss and take profit level to all your trade.

I placed a trade for Call option to target $14.5It only cost $1 per contract (100 stocks)!! why not ! lol


GE - where I bought callsEntered calls (shown by ellipse) this morning after seeing the break from the downward trendline and a retest on the MA. Using a lower timeframe to see the momentum. Expecting more from this trade.
Trade smart and have fun!
SLAM the like button and the ask! Cheers!

GE Trend ReviewComposite Model -- Neutral but remains close to switching bullish
Trend Bands -- Acted as support. Bullish
Linear Regression -- Overextended 2 STD to the downside
Trend Oscillator -- Bullish since November 2020
Trend Clouds -- Well over-expanded. Looking for a reversal to the upside.
Overall: All signs point to bullish. The clouds and linear regression point to an imminent reversal.

GE Bias: UpOverall the price is trading in range, bounce from minor support, potential buy trade with tight stop.
