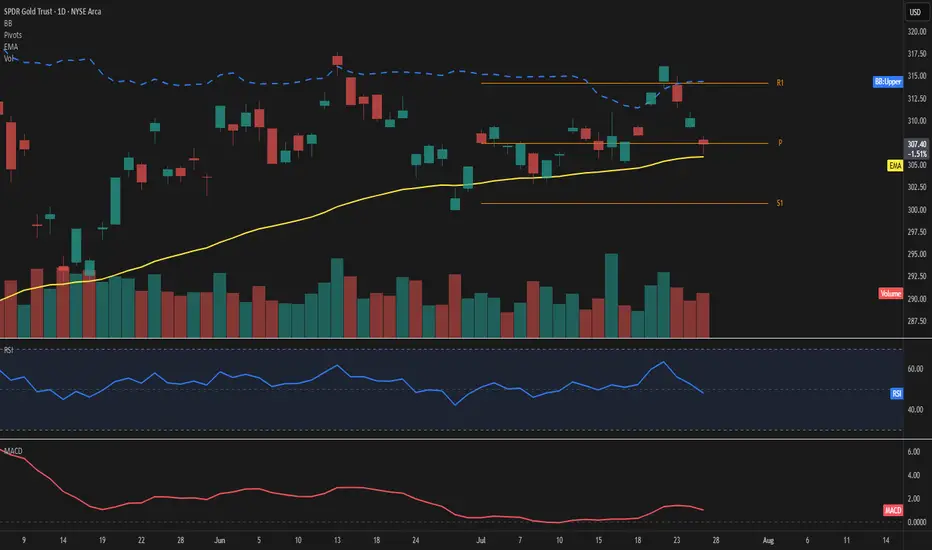
GLD – Price consolidates at highsPrice is hovering just above the 50-day EMA at 307, showing signs of short-term hesitation near the Fibonacci pivot. The upper Bollinger Band sits at 314, leaving moderate room for expansion if momentum picks up.
The RSI reads 48, reflecting a balanced setup without clear directional bias. MACD rem
Key stats
About SPDR GOLD TRUST
Home page
Inception date
Nov 18, 2004
Structure
Grantor Trust
Replication method
Physical
Distribution tax treatment
Return of capital
Income tax type
Collectibles
Max ST capital gains rate
39.60%
Max LT capital gains rate
28.00%
Distributor
State Street Corp. (Fund Distributor)
GLD is the first to market to invest directly in physical gold. The product structure reduced the difficulties of buying, storing and insuring physical gold bullion for investors. Actively traded, the shares provide deep liquidity. NAV for the fund is determined using the LBMA PM Gold Price (formerly the London PM Gold Fix), so GLD has an extremely close relationship with spot prices. Its structure as a grantor trust protects investors, trustees cannot lend the gold bars. However, taxes on long-term gains can be steep, as GLD is deemed a collectible by the IRS. Also, GLD's NAV has a larger handle, which corresponds to more gold exposure per share. As such, those impacted by per-share trading costs may prefer GLD over similar funds.
Related funds
Classification
What's in the fund
Exposure type
Miscellaneous
Bonds, Cash & Other100.00%
Miscellaneous100.00%
Cash0.00%
Top 10 holdings
$GLD short term top in $260-148 target on the downsideAMEX:GLD looks a bit extended here. I could see the possibility of GLD falling back to the $260 support at a minimum and maximum all the way down to $148
The $209 support would be the 50% retracement of the recent run. I like that as a level for a bounce.
Let's see where we end up.

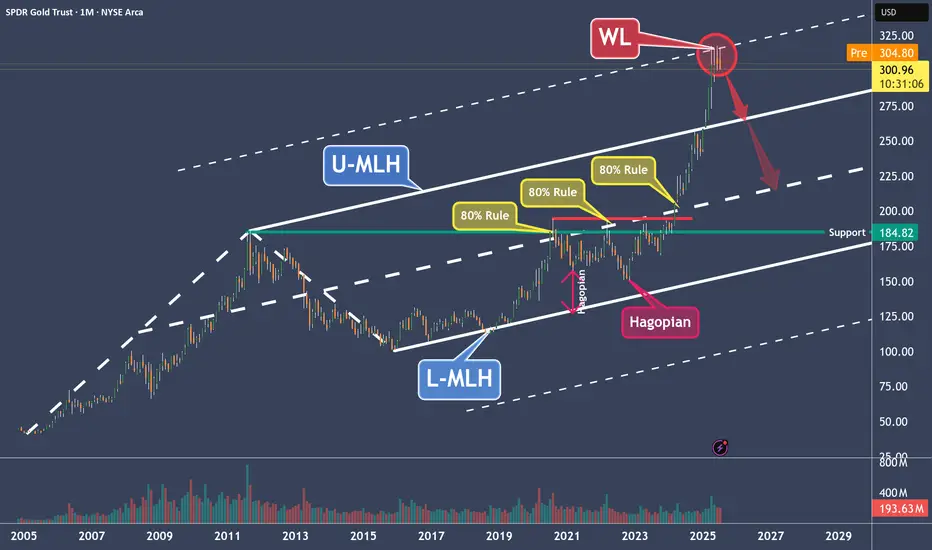
GLD – Why Gold Is a Clear Short to MePrice moved from the Lower Median Line (L-MLH) up to the Centerline, fulfilling the 80% rule.
Then we had two Hagopians, which sent price right back to the Centerline.
After the breakout above the Centerline, the next target was the Upper Median Line Parallel (U-MLH), which was reached rather quic
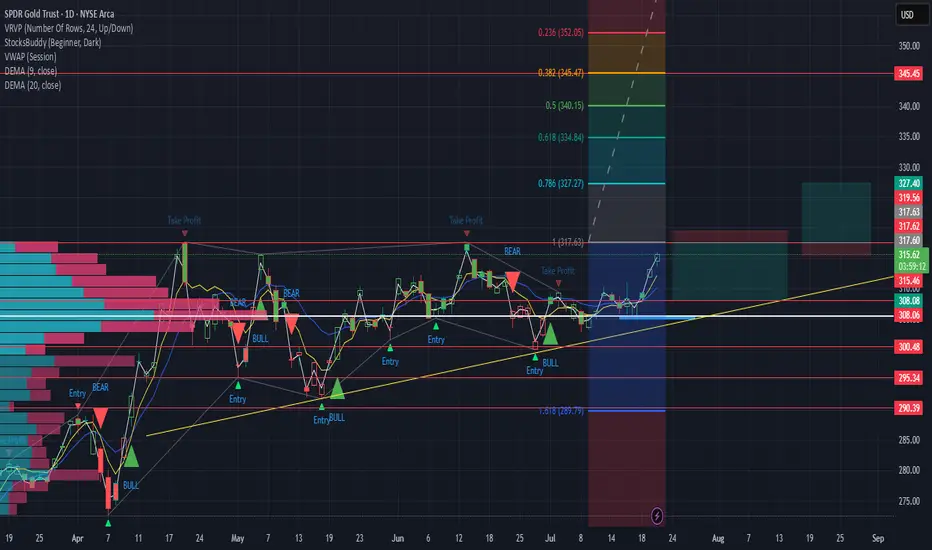
GLD up or down plan OK, tell me if this makes sense. if it rejects off of the 317.60ish area i would trade back to the down side to $308.10 ish - 4.80 R/R. If it breaks out and retests I would be trading to 327 area. 4.5 R/R - Let me know what you see and your thoughts. i'll try to share what i did.
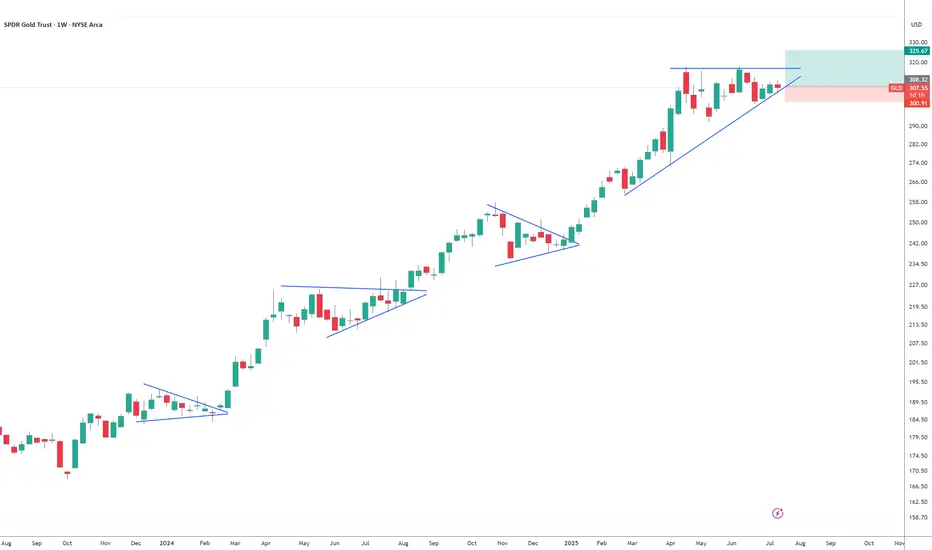
Gold!!!!!Looks like GLD is setting up for a big move to the upside. It likes to consolidate for a few weeks before a massive breakout. I have some GLD calls strike 310 for September 19. My SL triggers if a weekly candle closes under trendline. TP 325 ish.
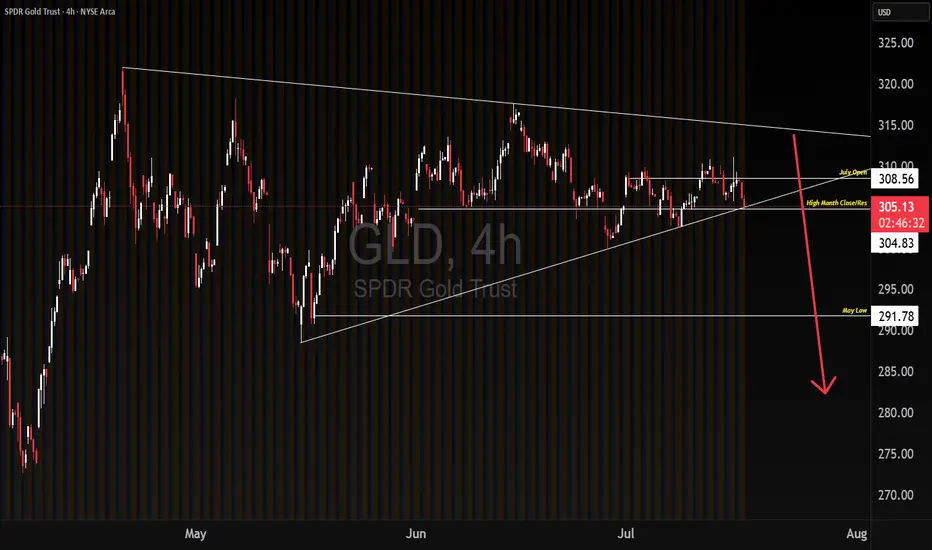
GLD potential break downWe could be experiencing a break down on GLD based on capital outflows, going into riskier markets. If this larger time frame range break down holds, and we get continuation lower on downside momentum, we get a measured move target of May's low. Will be watching to see if the breakdown is a bear tra
Short Goldbeen entering puts every time gold surges on any War headlines. it's getting sold into by smart money. it's been successful three to four times in a row. I currently have 11 open puts for the $300 strike expiring August 15th. I picked them up when we were pushing high 309 on Wednesday. high pote

Fear and greed vs SPYWhen VIX crosses over SPY rapidly, it’s usually a reliable sell signal. USD and GLD added for additional fear signals as well as inflation measures.
VIX falling to baseline and SVIX returning to previous value indicates regained stability or growth for SPY (entry point)

Have you noticed Gold and Silver Miners lately?No doubt you are aware of the serious run Gold made so far in 2025, and you might also be aware that Silver is catching up fast lately. But have you thought to take a look at Gold and Silver mining stocks and the ETFs that track them? As Robin might have said (but never did), "Holy prospectors Bat

GLD Weekly Trade Setup — June 16, 2025🪙 GLD Weekly Trade Setup — June 16, 2025
🎯 Instrument: GLD (SPDR Gold Shares)
📉 Strategy: Short Bias via Puts
📅 Entry Timing: Market Open
📈 Confidence Level: 65%
🧠 Technical & Sentiment Snapshot
Current Price: $311.78
5-Min Chart: Below EMAs (10/50/200); RSI ≈ 34 → short-term oversold
Daily Chart

See all ideas
Summarizing what the indicators are suggesting.
Oscillators
Neutral
SellBuy
Strong sellStrong buy
Strong sellSellNeutralBuyStrong buy
Oscillators
Neutral
SellBuy
Strong sellStrong buy
Strong sellSellNeutralBuyStrong buy
Summary
Neutral
SellBuy
Strong sellStrong buy
Strong sellSellNeutralBuyStrong buy
Summary
Neutral
SellBuy
Strong sellStrong buy
Strong sellSellNeutralBuyStrong buy
Summary
Neutral
SellBuy
Strong sellStrong buy
Strong sellSellNeutralBuyStrong buy
Moving Averages
Neutral
SellBuy
Strong sellStrong buy
Strong sellSellNeutralBuyStrong buy
Moving Averages
Neutral
SellBuy
Strong sellStrong buy
Strong sellSellNeutralBuyStrong buy
Displays a symbol's price movements over previous years to identify recurring trends.
Frequently Asked Questions
An exchange-traded fund (ETF) is a collection of assets (stocks, bonds, commodities, etc.) that track an underlying index and can be bought on an exchange like individual stocks.
GLD trades at 5,835.89 MXN today, its price has risen 2.20% in the past 24 hours. Track more dynamics on GLD price chart.
GLD net asset value is 5,822.40 today — it's risen 0.58% over the past month. NAV represents the total value of the fund's assets less liabilities and serves as a gauge of the fund's performance.
GLD assets under management is 1.91 T MXN. AUM is an important metric as it reflects the fund's size and can serve as a gauge of how successful the fund is in attracting investors, which, in its turn, can influence decision-making.
GLD price has risen by 1.12% over the last month, and its yearly performance shows a 38.52% increase. See more dynamics on GLD price chart.
NAV returns, another gauge of an ETF dynamics, have risen by 0.58% over the last month, showed a −0.82% decrease in three-month performance and has increased by 39.35% in a year.
NAV returns, another gauge of an ETF dynamics, have risen by 0.58% over the last month, showed a −0.82% decrease in three-month performance and has increased by 39.35% in a year.
GLD fund flows account for 205.53 B MXN (1 year). Many traders use this metric to get insight into investors' sentiment and evaluate whether it's time to buy or sell the fund.
Since ETFs work like an individual stock, they can be bought and sold on exchanges (e.g. NASDAQ, NYSE, EURONEXT). As it happens with stocks, you need to select a brokerage to access trading. Explore our list of available brokers to find the one to help execute your strategies. Don't forget to do your research before getting to trading. Explore ETFs metrics in our ETF screener to find a reliable opportunity.
GLD invests in cash. See more details in our Analysis section.
GLD expense ratio is 0.40%. It's an important metric for helping traders understand the fund's operating costs relative to assets and how expensive it would be to hold the fund.
No, GLD isn't leveraged, meaning it doesn't use borrowings or financial derivatives to magnify the performance of the underlying assets or index it follows.
In some ways, ETFs are safe investments, but in a broader sense, they're not safer than any other asset, so it's crucial to analyze a fund before investing. But if your research gives a vague answer, you can always refer to technical analysis.
Today, GLD technical analysis shows the strong buy rating and its 1-week rating is buy. Since market conditions are prone to changes, it's worth looking a bit further into the future — according to the 1-month rating GLD shows the buy signal. See more of GLD technicals for a more comprehensive analysis.
Today, GLD technical analysis shows the strong buy rating and its 1-week rating is buy. Since market conditions are prone to changes, it's worth looking a bit further into the future — according to the 1-month rating GLD shows the buy signal. See more of GLD technicals for a more comprehensive analysis.
No, GLD doesn't pay dividends to its holders.
GLD trades at a premium (0.23%).
Premium/discount to NAV expresses the difference between the ETF’s price and its NAV value. A positive percentage indicates a premium, meaning the ETF trades at a higher price than the calculated NAV. Conversely, a negative percentage indicates a discount, suggesting the ETF trades at a lower price than NAV.
Premium/discount to NAV expresses the difference between the ETF’s price and its NAV value. A positive percentage indicates a premium, meaning the ETF trades at a higher price than the calculated NAV. Conversely, a negative percentage indicates a discount, suggesting the ETF trades at a lower price than NAV.
GLD shares are issued by World Gold Council Ltd.
GLD follows the LBMA Gold Price PM ($/ozt). ETFs usually track some benchmark seeking to replicate its performance and guide asset selection and objectives.
The fund started trading on Nov 18, 2004.
The fund's management style is passive, meaning it's aiming to replicate the performance of the underlying index by holding assets in the same proportions as the index. The goal is to match the index's returns.