Break-out assets with Artificial Intelligence Break-out assets with Artificial Intelligence. Still keeping a bearish stance on the markets.
GLD trade ideas

Long gold for Wyckoff accumulation breakoutYou couldn't ask for a more perfect setup for longing gold from the TA to the macro/global uncertainty here

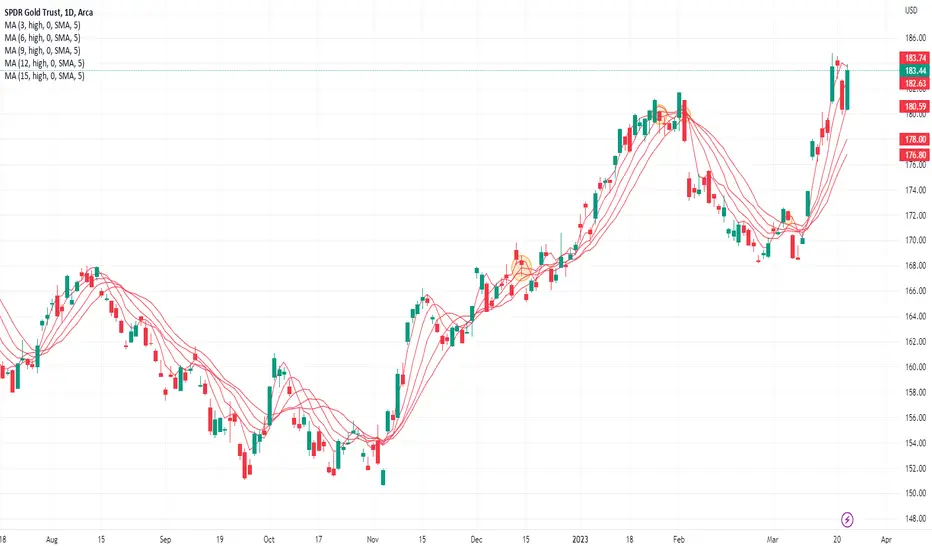
Recent history of GLD short trades using flat MA methodSo I am going to try to share the template for this analysis so community can see what I am seeing. But here anyway is the indicator set if creating manually. Use the moving average of highs for the 3,6,9,12,15 day moving average of highs on the GLD chart. Look at the last 6 months or so. The MA is flat on these dates and would per the method indicate a short trade with price penetrating from above at each of those dates being: Dec 14, Jan 26, Feb 2, Mar 6. Maybe I will try to post chart separately. I will do the same with long side trades and some other markets. Any and all feedback is welcome.
Rejection Again?A rejection here will show bullish for stocks (usually does). This would also validate a double top, rejection in a strong resistance zone and possibly send GLD back down to $162.50-$165. As you can see that volume spiked around the resistance zone showing that BIG sellers are there waiting to get their short position.

$GLD $GOLD - Gold- my take but BEWAREMonthly chart on gold. BEWARE - Gold got suckered into in March of 2008. Here is a timeline:
GLD - started Nov 2004 at $44.43
Broke out 09/2005 and topped out at $77.26 in May 2006
Consolidated until Sept 2007 with new 52 week high of 73.8.
Continued consolidating upwards until it topped out at 100.44 in March 2008 (Bear Sterns sold to JPM for $2/sh)
Consolidated until failed breakout rally in July 2008 before it dropped to $66 in Oct 2008 (when rest of banks collapsed)
Rally then started a couple months later in December 2008 with 2-1-2 bullish reversal on monthly chart.
Reversal continued until Sept 2011 when it topped out at $185.85.
It bottomed in Dec 2015 at $100.23.
5 worst words of investing "this time it is different"
What this is and always will be, is opportunity. Better than oil and other commodities look for sure. I am jumping on this train.
This will be volatile, and I do not expect to buy all at once.
My buy targets (not exact and I buy to the penny so do not use this) and stop is
1st buy - (Now) - around $180.
2nd $175
3rd $171
4th $161 - load up
$158 stop
If done properly, the most risk I have is around 7.65% to the downside with $205, $235, $250, and $300 as my long term price targets. $250 is the ultimate goal.
This is for informational purposes only. This is not advice for anyone to use to buy or sell. These are my numbers and I did not provide all details. Just enough to sincerely help anyone who needs it.

Gold bugs assemble!Massive cup and handle pattern forming on gold and nearing the round 2k number once again. The previous two runs over 2,000 (August 2020, March 2022) were chased heavy by longs to only be trapped. If 2k breaks again people will once again pile into longs. The more shots bulls keep taking the more likely they will succeed.


GLD possible short tradeThe chart shows the flattest MA of highs I can produce under the current price and I will use as my downside pivot and short position. The period length of this flat MA will change over time.

GOLD is just a reflection of behavioral finance it is interesting that people ignore fundamentals till it is too late and then act as a flock of ships

Gold digging timeI presented two possible moves for GLD.
I know many traders have been positive on gold lately due to bank runs.
the dip in the month of Feb shows an impulsive move. I most preferably another move to the downside (inside the grey box area) before a rally continuation.
however, if the price breaks the blue box, I think gold will continue to go higher. (alternate projection)

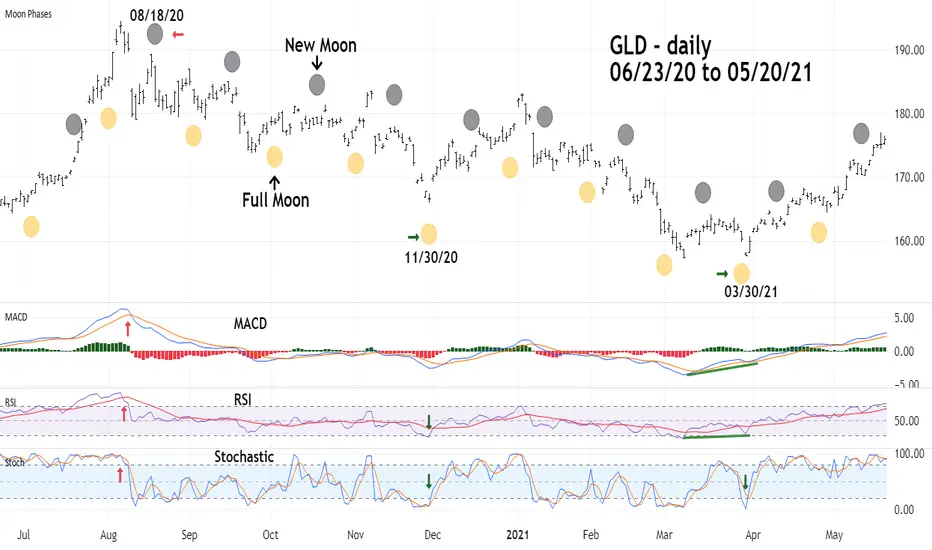
How to Use Lunar Time CyclesOcassionally Full or New Moons can signal a market turn, usually within plus or minus two trading days of the Full/New Moon.
Momentum oscillators can help determine which lunar signals could be effective.
On 08/18/20 GLD made a secondary peak after a very overbought primary top. The bearish line crossovers on MACD, RSI, and Stochastic along with the New Moon implied an important
top could be in the making.
On 08/18/20 - RSI and Stochastic reached the oversold zone. This combinded with the Full Moon sugested a bottom for GLD.
On 03/30/21 - MACD and RSI had bullish divergences. Stochastic had reached the oversold zone. With the Full Moon this implied a GLD bottom.
Most markets can have Lunar signals. Watch the momentum oscillators and watch the Moon.
Mark
GOLD TRUST Stock Chart Fibonacci Analysis 022823Trading Idea
1) Find a FIBO slingshot
2) Check FIBO 61.80% level
3) Entry Point > 169/61.80%


GLD daily is an overextended, imminent drop from this levelGOLD is overextended to the up and at the same time is in a very sharp rising wedge which if broken is very bearish for price. GLD is rising on facts that central banks are buying Gold like never before, but as it usually happens retail traders will hold a bag again. Central banks bought Gold at a cheaper price and several months later are saying they bought so now we have a rally.
RSI has overbought with extreme bearish divergences which will sooner than later cool down with a drop in price.
MACD also has strong bearish divergences.
Overall: GLD has more possibility to drop from this level than to continue this rise. It was rising on the falling dollar and the question of the day is when the dollar will rebound and continue up momentum. Nothing is going straight up or down. I could say it is like a rubber band, the more you stretch the more powerful break will be. It could go up to the upper trend line but a drop will be imminent and fast.

GLD consolidating before the next drop Gold did drop hard from the rising wedge, a very powerful bearish tradeable pattern. Now it's found support and started with forming a possible bear pullback which if formed could bring GLD back to the BigRed which is around 166$. Because of that huge drop on huge volume, it is very hard to say this is a healthy correction, rather than a new leg down. Like it always is played in the market, buy the rumor and sell on the news. Central banks bought tons of gold last year and then this year news came out about how they are increasing their position in gold and small retail traders went in shopping like there is no gold left. And now are bag holders.
Volume does confirm the price move to the down, very strong volume on the strong drop, very bearish.
It is below 20 days MA but above 50 and 200 days MA which is kindy of neutral.
RSI did cool down.
MACD is in the red, but both MACD and signal line is still above zero line which could be bullish.
After likely drop to BigRed GLD must find support and buyers otherwise this will be high for a longer period of time.
The dollar movement will defiantly help metals in their path, and one of the strongest movers will e CPI next week and FED next meeting.
GLD could even close the gap, but a further drop is imminent. The best option for bears would be consolidating or rising on small volume and then reversal on strong volume after a bear pullback is formed.

Gold $GLDGLD looks like the potential for support is below near
-the 50 DMA
-the AVWAP off the November low and
- the 38.8% retrace from Nov low to Feb high

Trade Journal - GLD, Nov 14 (long)Tracking
Nov 14
+ Went long 2 shares to have exposure to gold for long-term investment.
- Changed mind and did a swing trade on it instead
- Did not enter based on TA
- Stoploss was hit and did not exit position
- Did not have an ideal amount of risk for this position (position size too small)
Dec 1
- Hit TP and did not scale out
Dec 12
- Crossed baseline and did not exit position
Jan 24
? Trade is being actively maintained. If TP is hit, will move SL up. If SL is hit, will exit position. Not ideal position management, but it's become profitable so we can let it ride - this time.
Trades
Nov 14 +2 @ 164.78 (4.95 fee)
Outcome
Ongoing, but poor. Did not follow any rules whatsoever. Same issues as trade with TSX:COPP , see link.

GLD Running into today's close getting ready for a whale spout soon.
Get your tickets to the show
-stikstockitslive


GLD daily - at resistance, bearish reversal candlestick patternGLD daily is also at resistance, the same as GLD weekly which make even more pressure on the downside. GLD drops out of a smaller rising wedge which is bearish and is still inside of a big rising wedge which is a bearish pattern. GLD formed a bearish reversal pattern at the top, Hanging man. At the moment it is basing at a high which could be bullish if pops strong up, however chance for that is not more than 20%.
GLD is above all significant MA which is bullish and a sign of a strong bull market.
Volume is dropping during consolidation which is also bullish, as there are not too many sellers at this point.
RSI is way overbought and has strong and long bearish divergences which indicate a likely drop in price pretty soon.
MACD histograms are ticking lower with strong bearish negative divergences.
Overall: even though gold is in a bull market, its price is likely to reach its top for now and is ready to pull back. For bulls would be perfect to see pullback with smaller candles and on smaller volume for some time. A stronger volume on the downside with a bigger candle would indicate we are done with moving up and GLD is going down hard. Also bullish would be for the price to consolidate for several more days on this level without popping up on smaller volume so 20 days MA can catch a little bit and then move strong up.
On the downside, major support will be the rising trend line and rising 20 days MA. With the breaking of that support, next support would be the 166-168 area where is the support of weekly, and 50 and BigRed days MA on daily.

GLD gold likely correction/end of rise for nowGLD weekly - gold likely correction/end of rise for now
GLD is in a symmetrical triangle and is close to major resistance. GLD had 10 weeks up move and is due to correct. Volume is dropping which is not the best option with such a strong move-up. Volume is not confirming price action.
GLD is above all significant MA which is bullish and a sign of a strong bull market.
RSI is way overbought and is due to correct.
MACD histogram is ticking higher while the MACD line and the signal line are above zero line signaling bullish momentum.
Overall: GLD is bullish especially when the dollar is dropping. However, as GLD is at resistance, at the same time USA dollar is at strong support. For the continuation of the bullish move, GLD needs to correct at least to FIB 0.5 and then start to move up so RSI and MACD can cool down and have a healthy bull move. Otherwise, I expect a fakeout above, hitting resistance (blue dotted line) and getting rejected pretty hard and at the same time finish of a bull move for a longer period of time. Also, the more the price stays inside the triangle the more powerful movement will be.

Gold is finally looking good. Don't chase but look to buy on dipGold is finally looking good. The range bottom held and as long as dollar stays weak we should be buying dips not selling rallies. Great diversification if stock market crashes

