GLD trade ideas
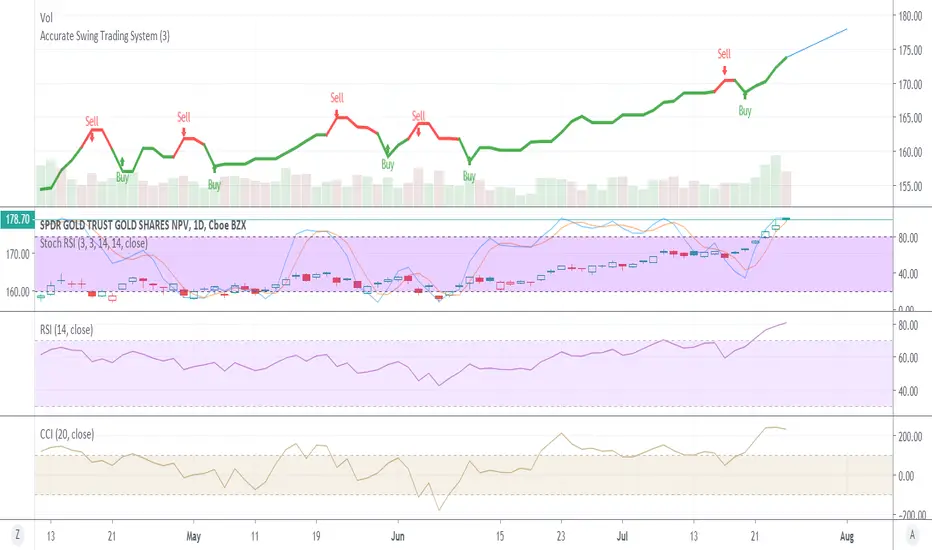
GLD 1 hour Chart AnalysisSentiment: Neutral to Bearish
As we've observed in the past two weeks Gold has been in a significant uptrend due to its negative correlation with the $DXY (US. Dollar Index) as well as overall volatility in the markets. However as we all know the law of gravity states that all things that go up must eventually come down.
Reasons:
1. Rising Wedge Pattern and Breakdown Confirmation
2. Tweezer Bottom Candlestick Pattern
3. Tweezer Top Candlestick Pattern

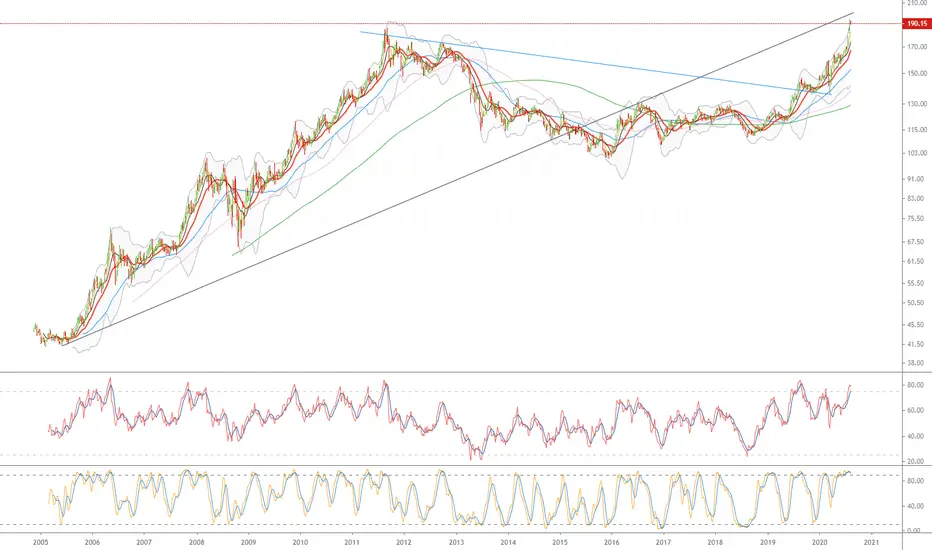
GLD 1D: New Breakout & PositioningGLD's performance has caught my attention (as well as many others) over the last few weeks. It is hard to ignore that gold looks pretty attractive at the moment given the macroeconomic forces that are at play today. Before we dig into the technicals, let's remind ourselves of the following:
Fundamentals:
Central banks all over the globe lowering interest rates and printing fiat due to the pandemic.
A lack of faith in the political leadership in many western countries (which is very justified).
The dismal economic data. Bad economies make the previous two points more relevant.
Now let's take a look at the chart. GLD has just broken the 2011 Labor Day Weekend ATH. Keep in mind that is in nominal dollars. If we added inflation to the mix, we are still under the ATH of 2011 and way under the ATH of the 1980s. Nonetheless, the chart seemed to like the nominal ATH and broke right through on strong volume, currently sitting around 4% higher than the LDW 2011 highs.
It is pretty clear GLD is set to keep moving up for the time being. We have set a new high on strong volume, which is the first indicator that GLD is set for a new trend to the upside and out of the sideways trade we have been in for 9 years now. That being said, confirmation is still needed. The following points give me hints that we are due for a pullback (in order of importance):
Extensive 8 week rally. There are only a few times this has happened in the past, and most of those times resulted in down weeks afterwards.
The current price of GLD is around 9% away from the 20-day EMA, which is almost twice the difference in the 2011 highs. This is telling me that we may be overextended on the short term, but long term prospects look good (lots of momentum).
RSI is extremely overbought (most in decades).
Minor MACD divergence (3.5%).
Long positions around the 186-7 level look great, as there could be lots of upside with minimal risk via stop loss management. If the price keeps falling, the 175 level looks even better.

GLD looking exhausted, needs some consolidation /upside movementlove and hold GLD but its looking pretty extended. hoping to see a consolidation or a strong candle to signal continuation

GLD Wave (3) Bullish We are looking for a completion of wave (3) in GLD with and pending wave (4) pullback into 181 level. Wave (3) rally in progress for a move towards 192 before a corrective (a), (b), (c) pullback.


GLD/SLV Ratio - still normalizing!This ratio has dropped from 12.5 to 8.02. I still some potential for this to fall to the 7.56 level or so which would have SLV still outperforming GLD in the near term. Indicators looking like they are ready to turn. Watching this closely.


GLD Long There is still a lot of room for new investors to pile into gold and silver as the top stocks are now reaching their tops and the USD continues to be debased by endless money printing by the FED at least until next year.
Short term could see some pull back at around 180 for this stock, but long term, GLD , gold, silver is a long term solid hedge against USD inflation.
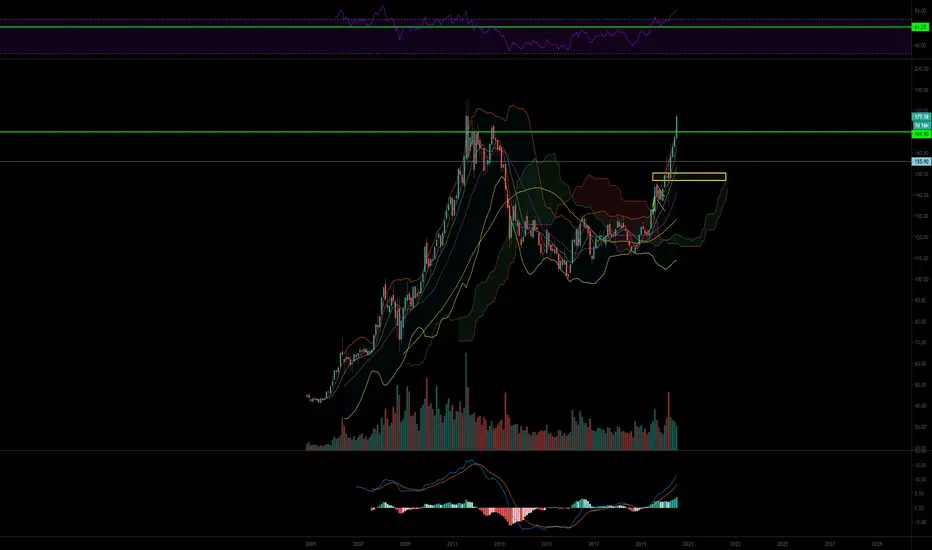
GOLD immediate bear scenario (low probability)If truly dollar is going to rally, GOLD should not close above the green line which also implies a handle may be uncovering.
In other words, next week put lotto can be very rewarding if enter at the correct timing. Let's see what happens tomorrow.
GOLD - Next Stop $180Gold has been on a mission to space and hasn't shown any signs of slowing down. Whenever we see consolidation and a possible resistance forming it breaks through with ease.
Targets for now:
1. $180
Feel free to give us a follow and shoot us a like for more analysis updates.
Cheers!
Disclaimer:
I do not provide personal investment advice and I am not a qualified licensed investment advisor. I am an amateur investor.
All information found here, including any ideas, opinions, views, predictions, forecasts, commentaries, suggestions, or stock picks, expressed or implied herein, are for informational, entertainment or educational purposes only and should not be construed as personal investment advice. While the information provided is believed to be accurate, it may include errors or inaccuracies. I will not and cannot be held liable for any actions you take as a result of anything you read here.
Conduct your own due diligence, or consult a licensed financial advisor or broker before making any and all investment decisions. Any investments, trades, speculations, or decisions made on the basis of any information found on here, expressed or implied herein, are committed at your own risk, financial or otherwise.
Feel free to give us a follow and shoot us a like for more analysis updates.


BUY GLD TARGET UP TO $175 , PATTERN RECTANGLE GLD has finished confirming the "Rectangle" pattern and going up well.
GLD buy : $166 +-1
Stop loss : $164
Target : $175 +-1
Wish you good deals!

$GLD Continues to Murder Bears, All-Time Highs in ViewGLD -- Tick-tock, tick-tock... gold is just a minute away from new all-time highs as we see it.
We have been fans for the past year, and still see no real red flags in the way of this trend, and called for the breakout here .


GLD/SLV Ratio - normalizing!This ratio is starting to normalize as I have suggested here with several ideas. SLV is finally outperforming GLD and it probably still has a bit more to go before they both need a breather. Watching this closely but we've dropped 4 full points already.


