GLD trade ideas

$GLD is in a 1.5YR Bull TrendIt's a pretty well defined channel so is this the start of a larger, longer run? I recommending googling "trump gold fed".


GOLD in BEARISH ZONEGold had its rally, was fun while it lasted guys, Trump said USA will slowly reopen. So we GO LONG on the SPY and NASDAQ because it will pump HARD very soon. For the short term Gold could be in Bearish Zone. Good luck :)


GLD - breakout area with room!GLD looks like it has a date with destiny at the old highs and certainly the peaks recorded in 2012. Not much in the way. Expecting it and SLV to continue marching higher.
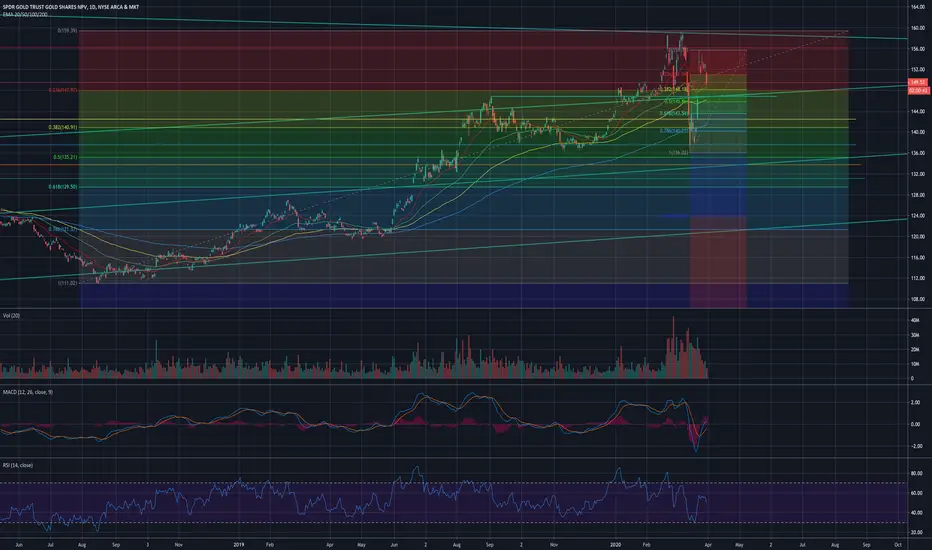
GOLD mixed price action between GLD and Gold minersWeird price action for GLD last thursday, as gold futures were up 2% and GLD was only up 2.6%. While senior gold miners index were up 10%, such as NUGT or NEM exploded for 13%. Possible bearish triple top or bullish Inverse Head and shoulders? April 7 COT report was mixed as well, Non-Commmercials were Long, while Commercials were short. FOMC is not for 3 weeks, maybe pull back to FIB .236 ($153.69) Happy Trading!

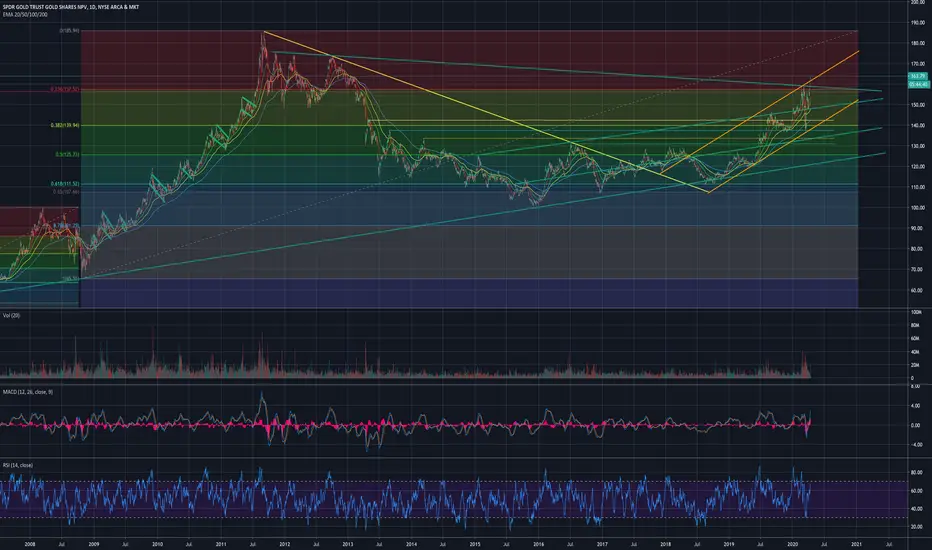
FIBONACCI RETRACEMENT and Fibonacci ExpansionnThis is Gold Index, as you can see that it have produced an impulsive retracement of ABC, from B to C according to fibonacci it have retraced in between 0.5(50%) and 0.382(38.2%) that gives us shallow retacement which signals an strong uptrend, therefore from C it will have to move up to 167.18 to make an complete impulsive retracement. Please this is an estimation as for now it's in Major resistance but if it breaks the resistance then we have a great opportunity to buy on Gold.. ... meaning Dollar will be falling as well.


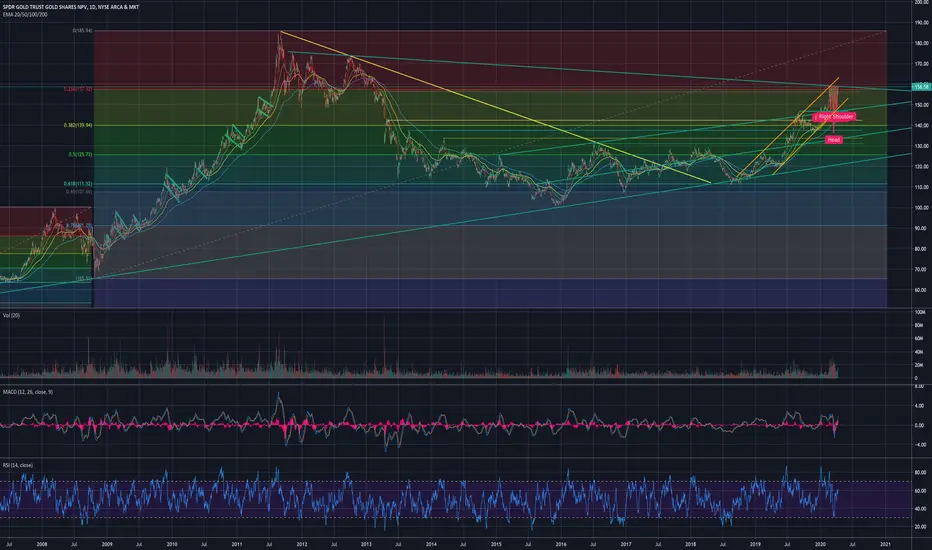
GLD - 5th time's a charm?I think so. Little different take looking at overall pattern dating back to the recession in 2008-9. It is very inviting. GLD wants to get into that top FIB level and has done the work at this FIB level creating a near flawless bull h&s pattern. Downtrend resistance from late 2011 and 2012 has been touched 4 times. Either this is the biggest fake out yet or gold is going much higher. Strong upside volume post liquidation scenario three weeks ago. NEM broke out of its similar pattern today. I think 5th time's a charm.
GLD - Big PictureGLD is right at overhead resistance that goes back to several peaks from the 2011-2012 time period. A break of this level will be significant. It touched previous high for this move earlier today. Watching this level closely. Breakout seems inevitable based on current environment and stimulus.

GLD - Head & ShouldersNEM broke out of its head and shoulders in a big big way today (see my idea from last week). This is also a textbook set-up. GLD still in original uptrend that it began last summer. All this stimulus is very positive for metals. Could use a breather or some sideways action but often you don't get a chance. If miners lead the metals then a breakout in GLD should be coming soon. Although NEM made new high, GDX still has not had a breakout so watching that closely.

MSI Momentum Strength Index 2x set Baiynd -Tom1trader Stochastic Momemtum Index - a true strength indix tsi with a moving average signal.
This uses the built in with modifications per Anne-Marie Baiynds recommendations - she uses a SIMPLE MOVING AVERAGE
for the signal (signal length at 4x the short length seems to work best to reflect actual price action support or resistance)
see a YouTube vid (Note: settings in videio have been updated to her most recent recommendations in this code
video is entitled "The Most Reliable Technical Indicator I Have Ever Used"
Anne-Marie Baiynd also in talks / videos refers to the use of short / long of 4/20 and 6/40 and have combined both of them here
this gives a perspective on slightly higher time frame action.
USAGE: Generally above and below the black dashed zero line is long or short
KEYS: -Plot position relative to zero black, red overbought, green oversold and the gray lines at .25 -.25
Indicator action often more significant out side of the more "neutral" +.25/-.25 area
and near or above/below the rede/green dashed lines.
-Steepness of slopes
Slopes of smi plots relate directly to price action.
- -SMI blue relation to its smiple moving average orange and the longer moving average purple.
MAJOR FEATURE - The average acts as support or resistance to the SMI and the price unless breaking out
is finding primary/secondary support or resistance as well.
YOU CAN SEE WHERE SUPPORT OR RESISTANCE MAY BE ENCOUNTERED.(mcuh unlike most indicators)
My satandard caveat use at your own risk. Like anyone else I do not know what the next bar/candle is going to do
and I place all of my trades with a management plan in place for the worst case scenario.
That said enjoy your charting and trading.
This was coded starting with the built-in indicator "SMI Ergontic Oscilator / Indicator". You do this by within the Pine Editor select "New" tab and
choose the indicator that you want the code for. This populates the editor with the code for the built in indicator and you can modify it to suit your
purposes and save it / publish it and etc. Thanks for following this and Keep Smiling!

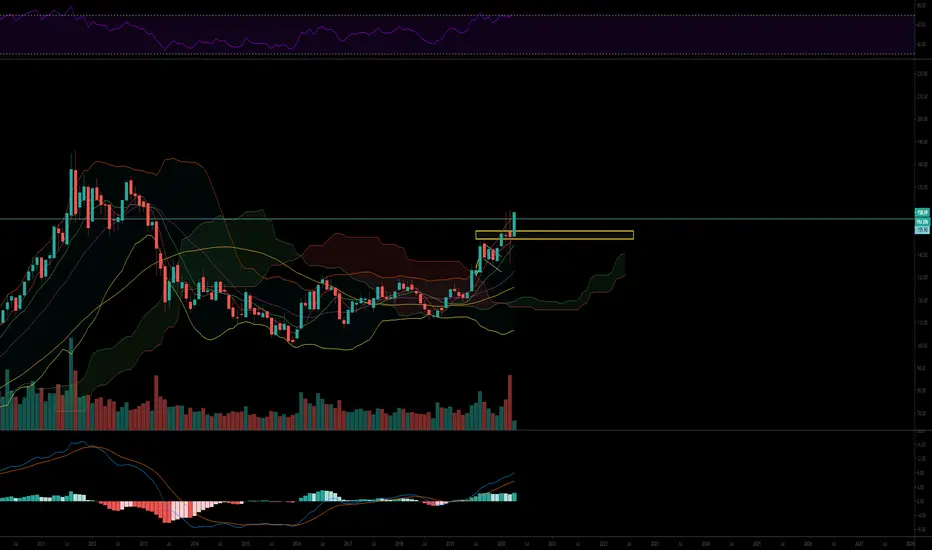
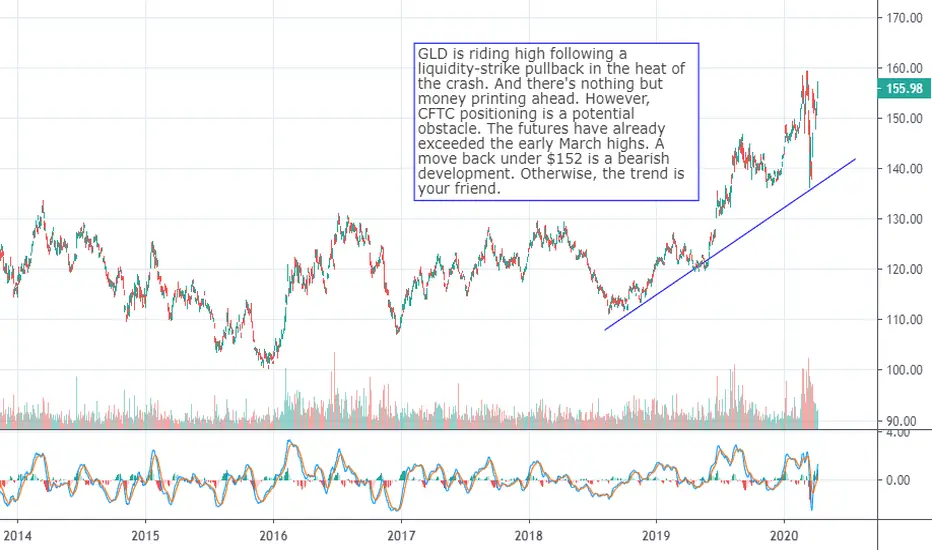
$GLD Rides Printing Frenzy, But the Crowd is on the BusGLD is riding high following a liquidity-strike pullback in the heat of the crash. And there's nothing but money printing ahead. However, CFTC positioning is a potential obstacle. The futures have already exceeded the early March highs.
A move back under $152 is a bearish development. Otherwise, the trend is your friend.
Gold is in an upswing, will it last?As the graph indicated there is been an upswing in GLD however, not strong enough to indicate a short trend YET.


Long on Gold (GLD) It's time to get long on GLD
try to buy around 145. as market worsens GLD should go up ... the more $$ they print GLD should go up ... plus summer time gold usually goes up a bit as well ... looks like all the stars are lining up
145 ish lines up with a 50% FIB retrace on the recent run ... it should get some support at the 89 EMA and the previous support happens to be around the same price.

Short againSPY is putting in a lower high at a retracement zone. Seeing triggers on small TF. Time to sell call spreads and/or buy puts again.


GLD - gaps to fill before next leg up!Looking for GLD to sell off another $5-$7 before next leg up. Be patient here.