GLD trade ideas

Long on Gold (GLD) It's time to get long on GLD
try to buy around 145. as market worsens GLD should go up ... the more $$ they print GLD should go up ... plus summer time gold usually goes up a bit as well ... looks like all the stars are lining up
145 ish lines up with a 50% FIB retrace on the recent run ... it should get some support at the 89 EMA and the previous support happens to be around the same price.

Short againSPY is putting in a lower high at a retracement zone. Seeing triggers on small TF. Time to sell call spreads and/or buy puts again.


GLD - gaps to fill before next leg up!Looking for GLD to sell off another $5-$7 before next leg up. Be patient here.
Look at this descending triangle formation!!!It could either go up or down, but based on some of the indicators, etc (which I haven't posted) it may go downward. I suspect it will hit a support level.

GLD: Heartbreak city!Welcome to the Great Depression of 2020! Silver and Gold will not save you in your time of distress! This sucker will be going down, so don't be a sucker!
Toto, I don't think we're in 1820 anymore! We're not returning to a Gold Standard, we'll see an EBT standard first!

Rounded bottom on Gold - Long term view!Such a beautiful rounded bottom on Gold Monthly. Even after the pullback last week (read corona crash!) it managed to stay the course. As long as it doesn't violate the ARC, it is headed for the previous highs. There might be some resistance but it should eventually break and go berserk!
That is my view. Please do comment and let me know your views.

Gold is consolidating. Will it break up?Gold prices are consolidating. Given that the US Federal Reserve is printing up trillions of dollars to create an economic boost, it could be a good time to get into a long position.


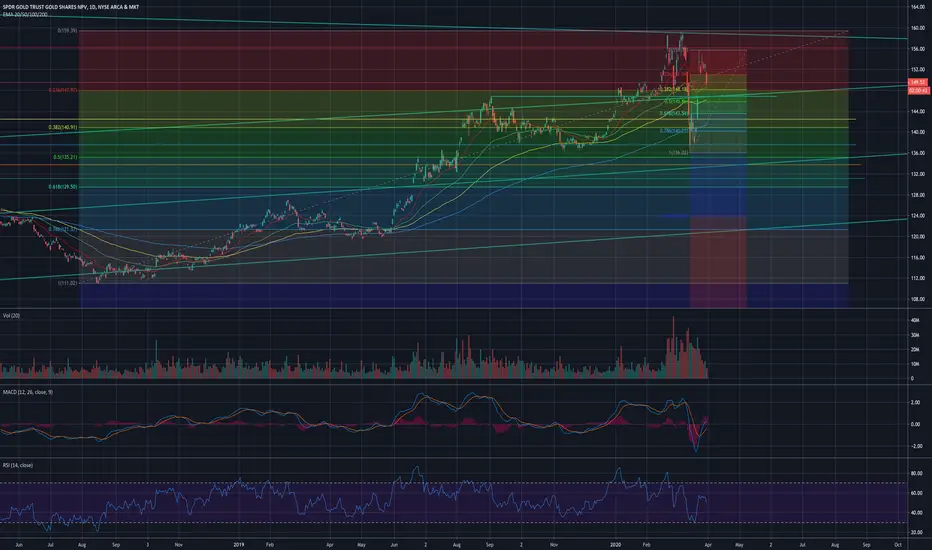
LONG-GLDThe MACD cross on 3/25 and the up coming MA cross over 9EMAx50MA give me reason to believe we will see a rally in GLD. Obviously the uncertainty in markets since COVID19 and sell off of GLD make GLD a relatively safe play. I am looking for $173 per share as the cup & handle pattern plays itself out in the coming weeks.

GLD to Short, Double topCondition:
1. Supply Zone Confirmed
2. double top in 60m Supply zone
3. Uptrend line break.
Entry below Supply Zone 153
Stop: 156
Target1: 147; risk/reward=1:2
Target2: 140; risk/reward=1:4
This is a trading school homework. I need 6 months to practice trading plan.
If you like it, thank you for your support. Please use SIM/Demo account to try it, until my trading plans get high winning rate.

GLD RSI Failure swing may lead to 34.44% drop like in 2008The GLD price action during this recent market crisis appears very similar to 2008. If gold prices move the same way they did in 2008, we'll see a drop from here followed by a strong rally.

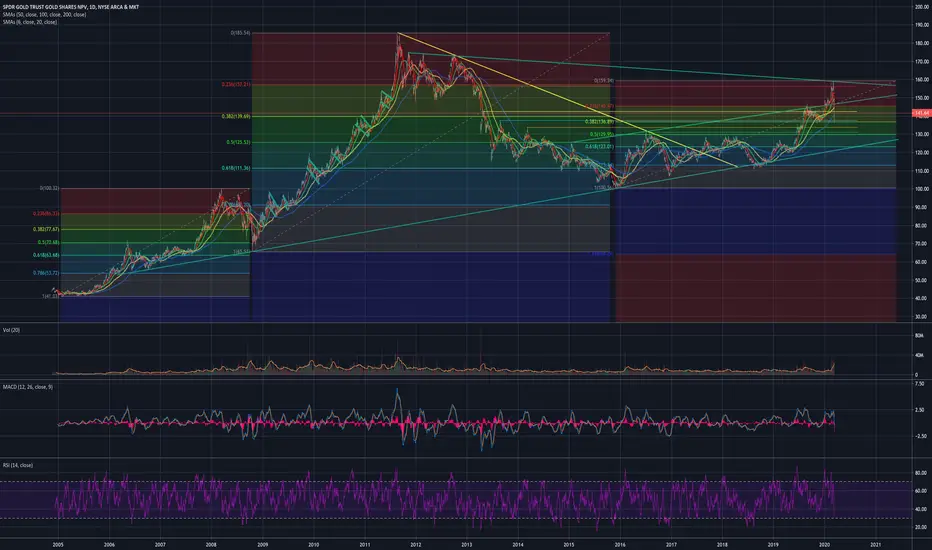
Is Gold a Good Safe Haven During a Market Crash?Gold is widely perceived as the best safe haven for your capital as the stock market goes through a bear market correction or crash.
But is this really true?
For gold to be a good hedge it would need to move in the opposite direction (have a negative correlation) to the broad market index, in this case, the S&P500.
Looking back 15 years we can see this is not the case for Gold (GLD) versus the market.
2005 to 2007
Gold out-performs the S&P500 with 52% gains compared to 25% for the S&P500
2007 to 2009
During the Financial Crisis, Gold provided a good safe haven for 7 months until it lost all of its gains.
2009 to Present
The S&P 500 goes on a staggering bull run making 481% to January 2020
Gold makes 138% from 2009 to 2012 moving in correlation with the market, then suffers a serious crash wiping out 42% of its value. The crash and stagnation lasts 8 years.
Gold is still 13% lower than its previous all-time high.
My Observation
1. Gold might provide a very temporary solution as a safe haven during the early part of a stock market correction.
2. During the Credit Crisis, Gold should have been a perfect store of value because as it seemed the Fiat Currency system was failing gold would have been a great replacement currency along with silver. But that did not work out.
3. Gold is only a safe haven is people think it is.
4. Since the 2009 market bottom, Gold has increased by 65% and the SP500 232%
Would I use Gold as a safe haven?
Personally no.
Not based on this evidence.
But in the short-term it may provide relief until people stop believing.
What is a good alternative? Holding cash and dollar-cost averaging into the market again as we near the bottom.
If you like this analysis, please like and follow so you dont miss future updates.
Thanks for reading, Barry

GLDTechnically, the chart spells trouble for GLD. Bitcoin is consolidating in a triangle. Could Bitcoin be the Gold 2.0?
We will find out in a month or so.

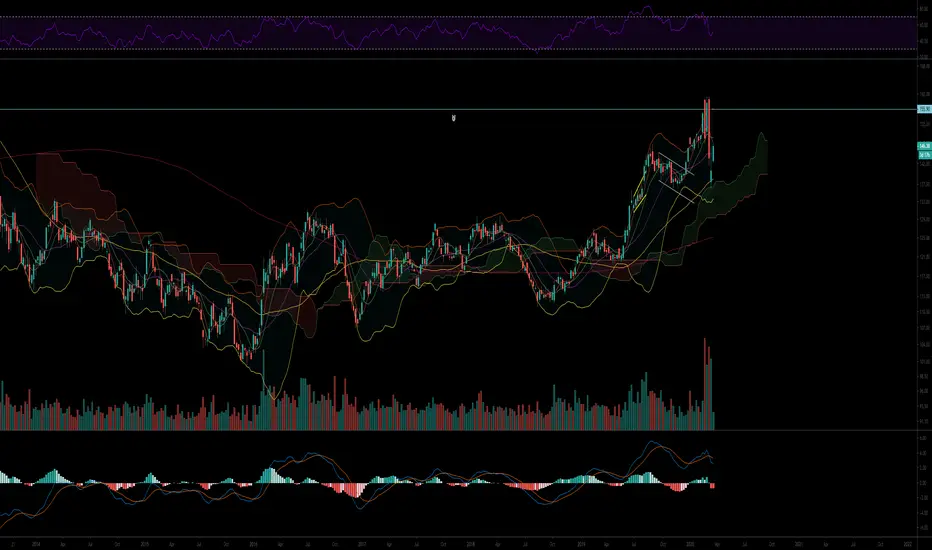
I really hope there is another touch of cloudFor me to load more.... praying...
Based on 08 chart, seems likely.
SHORT GLD / LONG BTCThe definition for safe haven says: It is a financial instrument that retains or even increments its value during periods of financial turmoil. Certain characteristics that a safe-haven assets have: liquidity, limited supply, and functionality. In the last years, I have heard many debates between gold and bitcoin followers. Let's see the charts:
GLD reached its peak in September 2011, and it has lost 46.13% of its value in December 15'(approximately 1560 days). On the other hand, BTCUSD reached its peak in December 17'. It has lost 84.27% of its value in December 18' (approximately 364 days). It is too early to call BTC a safe-haven asset. Its very volatile, and it loses its value faster and in big proportions than GLD. The last example was of this was reflected during the last weeks when the vireus had outbreaks in Italy and other parts the world. GLD lost 14.46%, while BTC lost 62.89% of its value.
1. When I analyze the liquidity part of the equation, BTC has an advantage. Bitcoin's technology (blockchain) makes it easy for people to transfer money around the world. It can be easily converted in U.S dollars, Japanese yen, Peruvian Sol, etc. Diversely, gold could be very tedious to convert into cash.
2. One of the main characteristics of a safe-haven is its limited supply. Both GLD and BTC meet that requirement.
3. The last characteristic is its functionality. Safe-haven assets must have a use that will maintain long-term demand. I personally think BTC has an advantage on this one.
The GLD charts shows a broken uptrend channel. Price has re-tested support level. This may suggest GLD may see new lows in the coming days/weeks.
On the other hand, BTC price action has formed a symmetric triangle. Price has touched an important monthly demand zone. The more times a zone is touched, the more important it becomes.
LONG BTC
SHORT GLD
We will see!


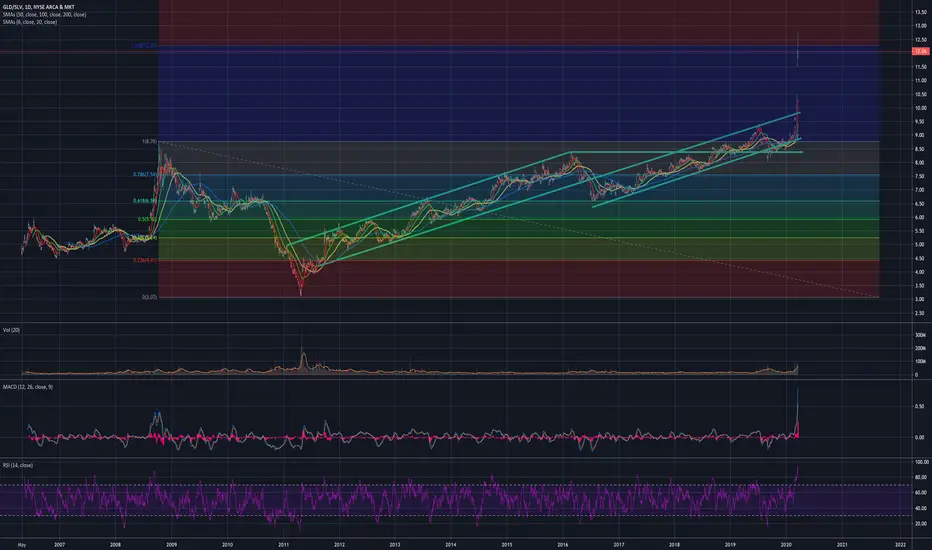
GLD/SLV Ratio - Silver's time is coming!This just looks like a monster blow off top similar to 2008-2009. It hit 127.5 which far exceeds any measure of this ratio by 20-25%. MACD and RSI starting to turn. I see silver rising and gold just marking time between $1450-$1520 before it resumes the next leg up.

GLD - still consolidatingAt yesterday's low, GLD held at the late fall consolidation area around 138 and that held above the breakout area from the summer of 130. Would not be surprised to see a test of the summer breakout area, but we are oversold on the daily and shorter timeframes and could have a bounce in here.