GLDFinally ATHs or a monster triple top? It may take some time here to resolve but a range of this time length will probably give us a significant move finally.
GLD trade ideas

Gold Order Flow - One Script To Rule Them AllHello traders,
Once again, the OFA script demonstrates its prowess...
Through the synthesis of fractals-based order flow data, we can deduce potential future trends in a market that has experienced unprecedented volatility in recent times.
Following the decisive breakout of 162.00 last Nov 2022 which left behind a double bottom, Gold was propelled towards 191.00 through a series of HH and HL patterns via the OFA script.
With the latest two cycles printed consisting of greater amplitude and velocity by the bulls, which was met by tepid sell-side pressure as the OFA indicates,
The path of least resistance continues to be higher.
We will never claim to have foresight or certainty about upcoming developments.
Instead, we will be attentive spectators of price fluctuations, allowing the OFA script to shoulder the burden of executing the next trade.
Bear in mind the two essential aspects of the OFA indicator:
Amplitude: A crucial hint in evaluating a trend's vitality is the extent of progress made by the dominant party controlling the trend.
We must ask: Are the new stages in the active buy-sell side campaign, as recognized by the script, increasing or diminishing in amplitude?
Momentum: When considering the range of price movements, amplitude accounts for only half of the equation. The remaining half involves the momentum or pace of the move.
We must ask: Was the new stage established following a rapid, impulsive shift? Alternatively, did the price achieve a new low or high with the movement being lethargic, constrictive, and time-consuming to develop?
A useful guideline is to count the number of candles it took to reach a new stage.
VISIT MY PROFILE FOR MORE INFORMATION ON THE OFA SCRIPT.

Gold Vs. Bitcoin - " When The News Is Negative"The problem is everyone is talking about Bitcoin
But who is talking about Gold?
--
Gold is your best buy
--
How To Buy Gold
--
Gold is a precious metal and you can buy
it from a local dealer
--
You can also buy gold shares
--
Or trade it in the derivatives market
--
Why Gold?
--
This is the best time to buy it because the price has
dropped
--
Also, you buy when the news is negative
--
When Will The Price Go Up?
--
Am really not sure - but you need to buy it
as soon as possible
--
What If You Are Not Able To Buy Gold?
--
Then you can buy silver
--
Silver is also a good buy - gold bugs love to
talk about the gold and silver ratio
--
You need to be ready for this run
--
Allow me to restore my creditability by saying
am not an expert please do not follow what
--
I write about unless you are very experienced
i have been studying trading for 5 years plus
--
so our results will be different from each other
--
stay safe
--
Lubosi Forex

GLD Gold ETF Pullback for EntryGLD has been trending up and the chart shows that volume is increased in April / May as
compared with March and is about relatively 2X. GLD is now priced at its all time high.
On the trendline drawn, GLD is rising at a rate of approximately 5% monthly. Gold prices are
reacting to economic uncertainties and the dollar value having its challenges.
Today, price is down 1-2 % dropping towards the bottom of the Bollinger Bands providing
a good long trade entry. Stop loss is one dollar below the bottom band while targets are
at + 5% + 15% and +30% as a long duration swing trade expecting rising gold prices for at least
six months. See also my idea on XAUSUD / Cup and Handle

Trade Idea: GLD August 18th 210/June 9th 185 Long Put DiagonalWith GLD at or near all time highs, looking to buy the back month -90 delta put and sell the front expiry +30 delta to synthetically emulate a covered put with -60 delta or so. Will look to take profit at 110% of my cost basis (i.e., a 21.57 credit, resulting in a 1.96/$196 profit).
Metrics:
Max Loss: 19.61 debit
Break Even: 190.39 relative to 189.64 spot (pre-market)
Max Profit: The width of the spread (25.00) minus the debit paid (19.61) or 5.39 ($539)
Will adjust price at open if necessary to get a fill.

GLD (SPDR Gold Trust) all time high very soonIt took Gold almost 10 years to make new all time highs, which it did in Juli 2020. Since that moment gold has been trying to create a period of new price discovery. I believe we're almost there.
Price discovery means that the price is confidently breaking new all time highs, which usually ends in a parabolic run up. The previous all time high is technically an all time high, but I woudn't truely call that price discovery.
Why do I think we'll see price discovery soon? The more a resistance gets touched, the weaker it gets. GLD is now on its third attempt to break resistance. Combine that with the sudden spike since the low of Octobre 2022, and you got a likely price discovery scenario.

Gold Triple Top?Is GLD completing a triple top pattern or is it poised to breakout to new all-time highs? The charts say gold at 2,025 - 2050 per ounce is pushing the upper boundaries of its historical resistance price, so the probabilities are that GLD declines over the next few months. However, if GLD breaks out above 193 - 195 because of macroeconomic or geopolitical events, then it will make a new historical leg up. Here's a GLD 1 month chart, 13-year view, with the triple top pattern highlighted with an ellipse. I'm posting this as a short, but the timing for a short GLD trade may prove to take a long time or invalidated with a GLD breakout past 193 - 195.
Top 10 Countries with the Largest Gold Reserves (in tons)
United States — 8,133
Germany — 3,359
Italy — 2,452
France — 2,436
Russia — 2,299
China — 1,948
Switzerland — 1,040
Japan — 846
India — 754
Netherlands — 612
5/19 expiry option data:
Put Volume Total 6,876
Call Volume Total 7,575
Put/Call Volume Ratio 0.91
Put Open Interest Total 203,229
Call Open Interest Total 399,848
Put/Call Open Interest Ratio 0.51
6/16 expiry option data:
Put Volume Total 2,955
Call Volume Total 8,122
Put/Call Volume Ratio 0.36
Put Open Interest Total 264,056
Call Open Interest Total 703,900
Put/Call Open Interest Ratio 0.38
7/21 expiry option data:
Put Volume Total 641
Call Volume Total 1,368
Put/Call Volume Ratio 0.47
Put Open Interest Total 15,187
Call Open Interest Total 130,659
Put/Call Open Interest Ratio 0.12

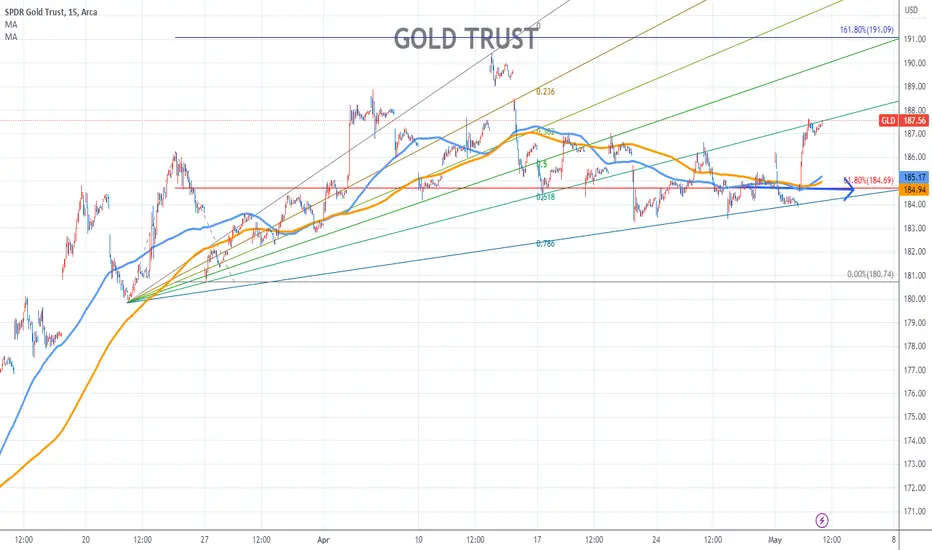
GOLD TRUST Stock Chart Fibonacci Analysis 050223Trading Idea
1) Find a FIBO slingshot
2) Check FIBO 61.80% level
3) Entry Point > 185/61.80%
GOLD TRUST Stock Chart Fibonacci Analysis 042723Trading Idea
1) Find a FIBO slingshot
2) Check FIBO 61.80% level
3) Entry Point > 184/61.80%

GLD - maybe a continuation of uptrend after a recent pauseA little above 187 appears as the proximate envelope boundary. I'd be a buyer for a continuation of the uptrend above that point. After a retrace over the last week or so maybe we get continuation.

GLD - which direction next?Will GLD fail the containment MA below or break out above the envelope MA higher to possibly new highs?

GLD - up or down?The envelope of 8 day MA of highs shows a possible upside pivot. The 18 day of lows is about a 1.5 containment ratio and offers a downside opportunity.
Opened (Margin): GLD May 19th 185/Sept 15th 210 LPD*... for a 19.98 debit.
Comments: Taking a bearish assumption directional shot in GLD here on strength. Buying the back month -90 delta put and selling the front month +30 to emulate the delta metrics of a covered put (i.e., short a one lot of stock + short a put).
Cost basis of 19.98 with a 190.02 break even on a 25 wide. 5.02 ( SGX:502 ) max profit, assuming a finish sub-185, 25.1% ROC at max; 12.6% at 50% max.
Will generally look to roll out the short put at 50% max to the shortest duration 30 delta strike that is at or below my break even. With the back month out in September, I have quite a few opportunities to reduce cost basis if the setup doesn't work out immediately.
* -- Long Put Diagonal.

GLD GC1! Gold looks Bullish - Cup and Handle XAUUSDGold Cup and Handle pattern is developing, as banking crisis has just started...
The information and publications are not meant to be, and do not constitute, financial, investment, trading, or other types of advice or recommendations...

GoldBullish here to 191.50 gap close..
Dxy wants 100..
Silver/SLV looks good too but I prefer this setup..
4/21
192c
186.50 stop loss


Another example of a bull flag playing out on GLDThis is a safer setup we use for long-term calls as a hedge to our tech plays. I often like to use traditional assets that perform well during bearish times as hedges but by using calls instead of puts. Since I tend to perform better finding bullish price action, I like to use GLD and sometimes a few dow jones stocks as hedges.

Bearish PlayPrice is below the VWAP and crossing below the pre-market low. The 30m chart is hooking down, and price is a 1/4-point below the opening signal. The moving averages suggest price is bearish on the shorter timeframes of 5m, 15m, and 1H charts while about to cross below the 8-ema average on the Daily chart. If it breaks below the Low of the Day at 183.56 making a new Daily Low, and then continues to trickles below the Daily 8-ema it's a very good sign. This is a more aggressive play, so the plan is to get in early with a smaller than normal position size an build it if price moves in our favor, or cut it otherwise. Additionally, there is an inverted cup & handle pattern 15m chart and a possible Head & Shoulders pattern that is forming which would make more bearish.

A terrible year for gold. GLDMy newborn needs his diaper changed, so I can't elaborate at the moment =]
But, I want to make it a point to say that my position on gold is very short this year. It's one of my most confident predictions.

Break-out assets with Artificial Intelligence Break-out assets with Artificial Intelligence. Still keeping a bearish stance on the markets.

Long gold for Wyckoff accumulation breakoutYou couldn't ask for a more perfect setup for longing gold from the TA to the macro/global uncertainty here

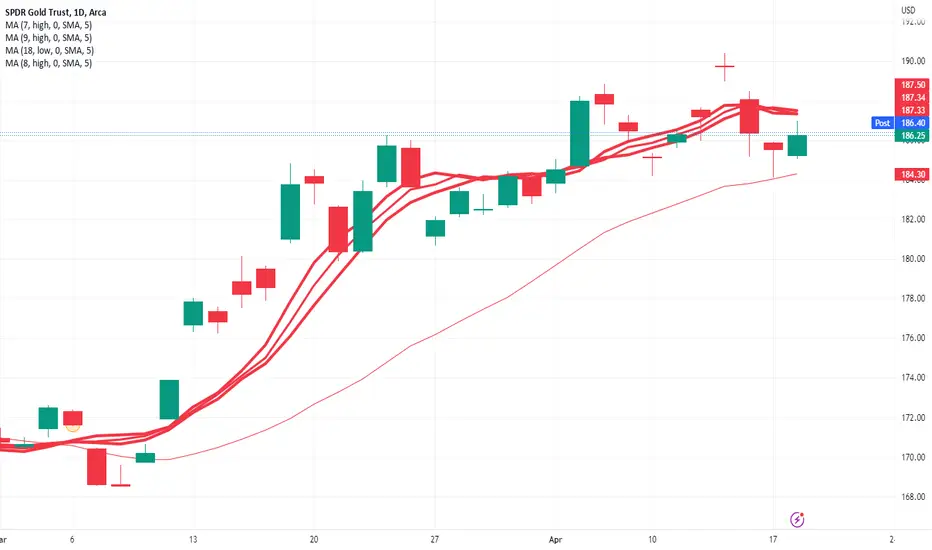
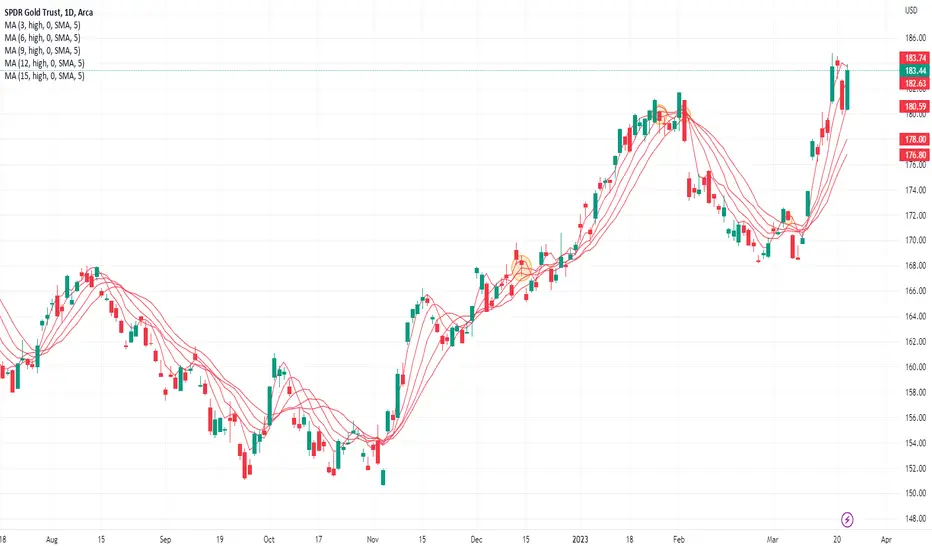
Recent history of GLD short trades using flat MA methodSo I am going to try to share the template for this analysis so community can see what I am seeing. But here anyway is the indicator set if creating manually. Use the moving average of highs for the 3,6,9,12,15 day moving average of highs on the GLD chart. Look at the last 6 months or so. The MA is flat on these dates and would per the method indicate a short trade with price penetrating from above at each of those dates being: Dec 14, Jan 26, Feb 2, Mar 6. Maybe I will try to post chart separately. I will do the same with long side trades and some other markets. Any and all feedback is welcome.
Rejection Again?A rejection here will show bullish for stocks (usually does). This would also validate a double top, rejection in a strong resistance zone and possibly send GLD back down to $162.50-$165. As you can see that volume spiked around the resistance zone showing that BIG sellers are there waiting to get their short position.
