GM trade ideas

GM alcistatanto las EMA como el MACD indican que seguira subiendo, la tendencia alcista es acelerada

I'm trading ALDW oil, F, GMViewing the chart above, the vertical line represents the day Hurricane Harvey hit. These stocks; which fall in the automotive, home and oil industries; saw a substantial increase over the next month and all but oil is still seeing an increase.
Ford, GM, LPX and Alon. I have been mentioning and trading the first three, Alon (ALDW) is a new one for me.
ALDW appears to be forming a cup and handle going into this storm. The last storm caused ALDW to jump upward. At a p/e multiple of 16.38, this stock trades cheaper than say XOM, which is at 29.49. Also note that ALDW has a small capitalization of 739 million, making it fairly reactive to oil prices.
I'm using technicals, mainly RSI, for entry. I look for RSI to range around 50-65 on support, lower could mean a bearish move.
My portfolio holdings going through Q4,
FX trading - 10%
Swing/pattern trading - 30%
ALDW - 20%
F - 20%
GM - 20%

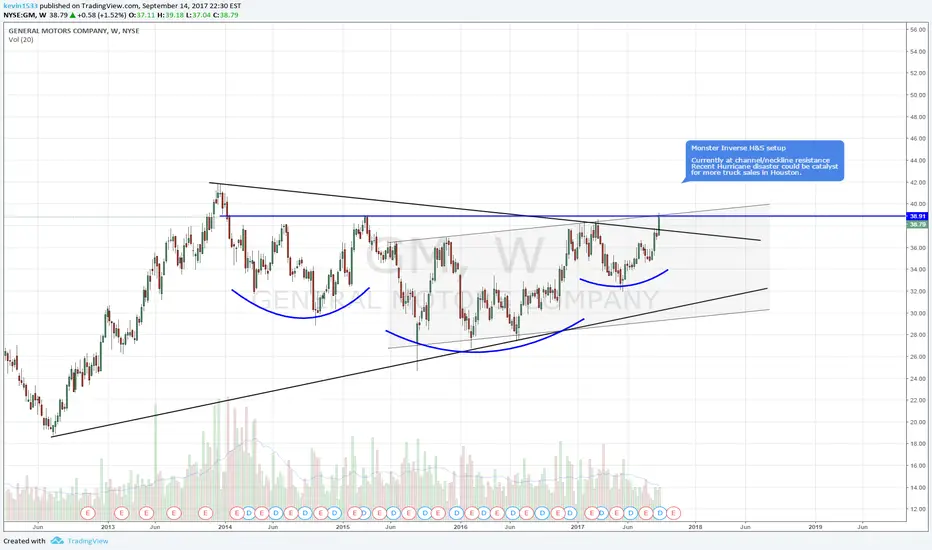
GM's post hurricaine rally could be coming to a haultWhen cars and homes were destroyed, those industries got a boost. LPX makes wood-panel sidings for homes and saw a 15% increase. Auto makers like GM saw a large increase as well this past month. Is it coming to an end for GM? Can it go higher? Is a good entry in sight? I believe so.
The trend angle increased, representing strength, and the price action in terms of ATR increased as well through the uptrend. However, the break through the 41.20 level on news of it's September increase was seen on lower volume than the previous day and ultimately closed below that level.
For me, I take this as a good time to sit on the sidelines and wait to see what happens. If it falls, then I will look for a good entry. Fundamentally, I see this rising over the next quarter.

GM can create a long play depending on next few days of trading.I will be following GM closely on the hourly and 15 minute charts for a possible breakout towards the upside. On the daily, Fibonacci and trend providing good buy signals.
Entry is possible here, but I do not recommend it here. Higher downside risk with a buy here, but minimize your loss if it can't break. $34.80 is the lowest level of support so it may go lower, but this stock looks great long term with 2-3 dividends :) .
2% max loss, 5-6% gain possible. Good luck traders, watch those support and resistance levels on Fibo and trend!

9.23.17 | GM | Bullish Continuation(Code-Name_Virtue)
Bullish continuation to the target zone.
(Keymaker)
Scroll down for more charts.


Falling RSI confirms trend line break in GM shares General Motors shares have broken a two month trend support line today and also fallen back under their 50 and 200-day averages. 14-day RSI breaking under 50 confirms momentum downturn.


Long GM by shorting June 32 PutGM has been pulled back from 38. It is time to long GM. Setup the position by selling short of the Jun 32 Put.
Position: Short June 32 Put
Credit received: 0.62
Target: 50% of the premium (0.32).


GM: Rejoining the long side here, graduallyI like $GM here for a bottom against the yearly mode support. It also coincides with a strong support from the uptrend off the 2015 low, which makes me think it won't go any lower than this, despite possibly ranging sideways for a while longer before shooting up with force.
In the long term, $GM's valuation down here will let you sleep well at night, while waiting for the breakout in the quarterly timeframe. Target for it is over $57, so it will be worth it as a hold.
Yield is excellent for a company this size, I'm fairly confident that it will gain traction soon.
Cheers,
Ivan Labrie.


General Motors is a shortBig volumes are associated to long black candles. Expected weakness in the following days.


A POSITIVE MOVING AVERAGE CROSS FOR GMOn March 24, 2017 the General Motors Company (GM), crossed above its 150 day moving average. Historically this has occurred 20 times since 2010. When this happens, the stock gains a minimum of 0.475%, has a median gain of 5.466% and maximum gain of 16.159% over the next 24 trading days. On March 23, 2017, the stock broke below the 150 moving average and broke above the moving average on the following day. This has occurred three times since August 2016 and the stock gained 6.686%, 5.674% and 16.159%.
Current General Motors chart from TradingView
When we take a look at other technical indicators, the relative strength index (RSI) is at 32.6033. RSI tends to determine overbought and oversold levels. I personally use anything above 75 as overbought and anything under 25 as oversold. The current reading declares the stock just flirted with the oversold mark and may begin to move upward.
The true strength index (TSI) is currently -5.3793. The TSI determines overbought/oversold levels and/or current trend. I solely use this as an indicator of trend as overbought and oversold levels vary. The TSI is double smoothed in its calculation and is a great indicator of upward and downward movement. The current reading declares the stock is trending downward which could be skewed due to the market drop on March 21. Even though it is pointing downward four of the last five times it was near this level, the stock reversed upward.
The negative vortex indicator (VI) is currently 1.3790. The VI determines current trend and direction. When the positive level is higher than 1 and higher than the negative indicator, the overall price action is moving upward. When the negative level is higher than 1 and higher than the positive indicator, the overall price action is moving downward. The current reading declares the stock is trending downward, but it is near the reverse point where the stock normally goes up big.
Considering the moving average crossover, RSI, TSI, and VI levels, the overall near-term stock direction appears to be trending upward. Based on historical movement compared to current levels, the stock could gain at least another 7.86% over the next four weeks.
DISCLOSURE: I currently do not have positions in the stock mentioned above. I most likely will not enter a position within the next 72 hours. Historical movements and technical indicators should never be the sole basis for entering positions involving risk. Make sure appropriate research is conducted prior to taking any risk in a marketplace.


