$GM - Mini Wyckoff bout to drop.Wyckoff accumulation about to be completed. The last leg should be 1 big fast drop down to maybe $35 as a start by the 9'th or 16'th in Dec and then some more accumulation around that area before there's a final drop to $33 ish by EOM Dec.
That's all.
GM trade ideas

$GM with a Bullish outlook following its earnings #Stocks The PEAD projected a Bullish outlook for $GM after a Positive Under reaction following its earnings release placing the stock in drift A with an expected accuracy of 50%.

$GM: Interesting weekly uptrendI like the setup in $GM, which I think can move fast here if EV names gain traction. I'm already long $F from lower in my long term account, but want to add a short/mid term position in $GM here.
Valuation is not as interesting and I don't particularly love Mary Barra's execution or her being prone to corrupt political shenanigans with Unions and Biden backing her, but well, the setup is good and likely will produce good returns within 8 weeks. The company is highly leveraged, and revenue growth is low, but seems to have bottomed out. Price to sales suggests it's cheap, same as earnings yield which sits at 14% ish. They have been burning cash though, but perhaps their cheap EVs and the Silverado truck do well going forward. I'm not likely to participate for longer than short and mid term technical setups suggest we should remain involved with the stock though.
Best of luck!
Ivan Labrie.

GM UpdateFlipped my calls and called it a day trade since it went up over $2 for the day, but looks to me like it wants to double top.
I'm always weary when the market pumps bad news though.

GM $GM Upcoming Week Analysis LONG?GM Analysis:
RSI 1HR 52 4HR 69
STO 1HR 64 4 HR 60
Findings: there is a gap @ $52 that needs to be closed.
Action: Since the RSI and Stochastics are pretty high on 1hr and 4hr we will see a price correction towards $36 BEFORE closing the gap at $52.
WATCH the price correction at $36 before going long closing the gap at $52

GM UpdateLike I mentioned a while back, it's back to pre-COVID levels and bouncing.
Daily MFI is overbought, though RSI is not there yet.... much like PCAR
$GM ER Implied Move Range - Sitting BearishI can't imagine many people are buying new and used cars headed into a recession. Guidance will be pretty key, and I think GM's going to start looking bearish.

GM Weekly Fork-WaveNYSE:GM
GM Weekly Fork-Waves
It looks like GM is about to enter Wave 3 of a larger-degree Wave 3.
This goes against the current market sentiment.
This is valid as long as the July low at $30 holds.
Fat_Fat


Breakout on GMNYSE:GM
Lower High has been formed and the Lower Low has been breakout!
Minimize the risk by using Trailing Stop every time the Lower High been formed, according to the fractals.

Where to place your stop loss-a close above theThe big question in every trader mind, where to place my STP loss. most common trading strategy calls to place the stop loss above a SZ (Supply zone) or Below a DZ (Demand Zone), right that seems easy but its not. ask any trader & he will recount stories of price violating the SZ, & the stop loss is triggered the loss is carried (hopefully small) only to have the price reverse fortune.
This is exactly what occurred in this short trade on NYSE:GM (General Motors); on the left hand side we have the long-term chart (W) & on the right hand side we have the trade chart(D).
The Long-term chart is clearly in downtrend. the price came into the Lower High of the (W) downtrend. a short was opened @39.20 with a stop loss above the LH of the (W) downtrend slightly above @41.00 many odds are in the favour of taking this trade.
What is interesting, on the right hand side, (D) chart, the price violated the LH supply zone & closed above the supply zone (The red circle) ; my trade plan calls to close a trade after a candle stick
* Violates a Supply zone by 10%
* candle stick closes above the SZ
Both conditions were met here, yet I did not close the trade & waited for a confirmation. yes i violated my own trade plan. Trading is fluid & my trade plan is ever changing. I closed the short today @32 mark. No permanent was made to my trade plan. but I took note of a price violating the SZ by over 10% & closing above the SZ but still the SZ held & the Short worked out.

GM UpdateLooks to me like it's headed back to support, will probably try to play the bounce then.
At this point, every GM trader is probably thinking the same thing so it'll probably get there quickly. Not sure when, but I would short any big bounces, no position right now, not gonna chase this big drop

gm 2 scenariosgm 2 scenarios .. 1] buy above the resistance 1 and 50ma .. 2] sell under the support 1 and 200ma ..

GM:Bullish Channel?General Motors Company
Short Term - We look to Buy at 39.04 (stop at 36.14)
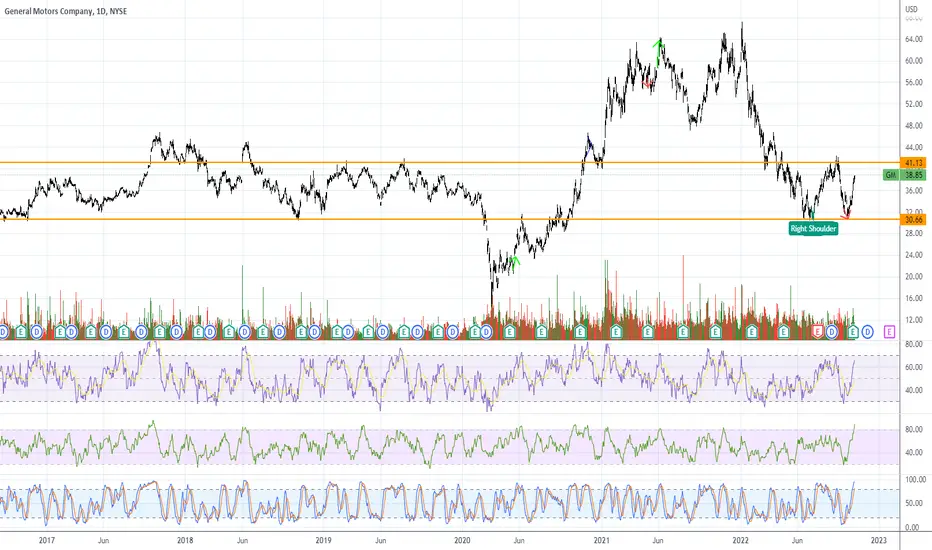
The bullish engulfing candle on the daily chart is positive for sentiment. A bullish reverse Head and Shoulders is forming. This is positive for sentiment and the uptrend has potential to return. Dip buying offers good risk/reward. Further upside is expected.
Our profit targets will be 46.31 and 48.00
Resistance: 46.00 / 50.00 / 65.00
Support: 39.00 / 30.50 / 14.50
Please be advised that the information presented on TradingView is provided to Vantage (‘Vantage Global Limited’, ‘we’) by a third-party provider (‘Signal Centre’). Please be reminded that you are solely responsible for the trading decisions on your account. There is a very high degree of risk involved in trading. Any information and/or content is intended entirely for research, educational and informational purposes only and does not constitute investment or consultation advice or investment strategy. The information is not tailored to the investment needs of any specific person and therefore does not involve a consideration of any of the investment objectives, financial situation or needs of any viewer that may receive it. Kindly also note that past performance is not a reliable indicator of future results. Actual results may differ materially from those anticipated in forward-looking or past performance statements. We assume no liability as to the accuracy or completeness of any of the information and/or content provided herein and the Company cannot be held responsible for any omission, mistake nor for any loss or damage including without limitation to any loss of profit which may arise from reliance on any information supplied by Signal Centre.

GM posts BUY signalPrice action confirmed a breakout to the upside.
Price is above the 50 day, the target is below the 200 day.
RSI is bullish, volume is green.
I've identified the ideal entry, stop and target.


$GM with a Bullish outlook following its earnings #Stocks The PEAD projected a Bullish outlook for $GM after a Negative over reaction following its earnings release placing the stock in drift C.

$GMLast week (previous candle), we have located a potential market anomaly. A shooting star candle with above average buy volume. I feel like bulls that missed out or still attempting to squeeze juice from the July 11th rally may get some tough days ahead. Price could continue to rise a small bit. However, we are waiting on distribution which should take us to the 2nd wave. We don't know how long this will take. The RSI K/D is starting to cross down from an over bought stance. We are looking for price to reach $35 to $37 at some point. We just completed an ABC expanded flat on the weekly and will be patient to see if a new impulsive wave is coming down the line. At this point, we will be looking to trade each wave so I will update as we go.
What do you think?

GM LongGeneral Motors have been recently getting very good news this past few weeks and I feel as if they are going in for a good upward spike. Their revenue is very consistent annually and is mostly on the positive side. Their publicly traded debt is over $100bn but their bond rate has been kept pretty consistent lately. This could take a few weeks, even months, but I can see a small continuous downward position, then a switchback.

GMGeneral Motors (GM) poised to continue its rally if it breaks above $40.28. If that happens, there is a possibility of a trend continuation either towards $43.24 or $46.74. In contrasts, a daily close above $37.29 may provide short selling opportunities with a potential retest of $34.31 support. A subsequent daily close below the first support could open the door towards the year to date low of $30.33.


