GMENYSE:GME
4 inside day candle/bull flag on the daily chart.
Current position: 20C 5/17/24 1.14
Small Position
.........................
GME trade ideas

GME's rally takes it to the 76 resistance. Parabolic rally recently in GME. Gained a lot of attention but, as of yet, it's not broken out of the simple downtrend structure.
In setups like this there's always a 1:3 - 1:5 RR trade fading the rally into the 76 resistance (Caveat of gap risk in stocks).
If the downtrend is to continue, this should be about the end of the rally.

GME, Potential Bull MarketGME is getting a double bottom on the higher timeframes,
Similarly to the previous bull run that lead to a 4,500%+ run.
I have the measure move slightly below the last ATH.
with a Gold Pocket around $78-$81
Things to consider
With the recent pump of 78% since it's recent local bottom,
it may or may not be a good idea to enter,
It's at a really strong resistance,
Volume is lower that previous candles these sizes.
It may pull back 15%-40% before continuing, if continuing.
Thank you.

$GME 🚀 It's Moon Time! PT:$11.56 & $14.37Hello everyone,
I know you all have been waiting for a big update. Here is the tea:
First PT coming in at the daily at $11.56. Break above the daily and the next PT is at the weekly $14.37. These two will act as very hard resistance and if both are to break then we will head to the monthly at $21.10, but we will analyze that part when we cross that bridge.
RSI indicates that GME is in the bull zone right now. The MACD is slowly curling up and if the lines cross above the 0 line, then that would indicate a very very bullish signal.
If GME rejects the daily, then price will trend lower and will test the hourly at around $10.62ish.
Anyways, there is room to run here folks! Strap in because this is just the beginning. $9.94 was the low and it won't be returning there anytime soon.
Not financial or sexual advice.

GameStop Corporation Technical Analysis.As of the latest market data, GameStop Corporation (NYSE: GME) exhibits a complex technical landscape that warrants an intricate analysis for potential investors or traders looking to navigate the volatility inherent in this stock. We will dissect the available data, which includes ownership structure, valuation, growth and profitability metrics, revenue streams, dividend history, technical indicators, and a one-year forecast, to provide a nuanced understanding and predictive outlook.
Ownership and Valuation Metrics:
The ownership structure shows a predominant free float with 87.18% of shares, suggesting a relatively high degree of liquidity which can both present opportunities for high volume trading but also contribute to potential volatility.
With a market capitalization of $3.40B juxtaposed against a substantial price to earnings ratio of 515.57x, the stock presents a speculative stance, indicative of investor sentiment heavily pricing in future growth expectations.
The price to sales ratio at 0.63x appears more grounded, providing a silver lining that the company's stock price may not be overly inflated relative to sales.
Growth Trajectory and Profitability:
The annual net margin trajectory suggests an improvement, with the margin turning positive in 2023. This reversal from previous years' losses is a bullish signal, reflecting an effective management strategy and potential operational efficiency gains.
Revenue breakdown indicates a diversified portfolio with significant contributions from hardware and accessories, software, and collectibles, denoting a balanced approach that could mitigate sector-specific risks.
Dividend History:
GameStop has ceased dividend payouts, evidenced by a dividend yield TTM of 0.00%. This can be viewed as a strategy to reinvest in the company's growth or a reflection of the need to conserve cash, given the competitive retail landscape.
Technical Indicators and Price Prediction:
Oscillators like the RSI at 34.35 signal neither overbought nor oversold conditions, leaning towards neutral sentiment.
The Stochastic %K and MACD indicators present a conflicting view with a neutral to bearish bias, suggesting that short-term momentum may not be in the bulls' favor.
Moving averages paint a bearish picture, with significant selling recommendations across multiple time frames, pointing to a potential downtrend.
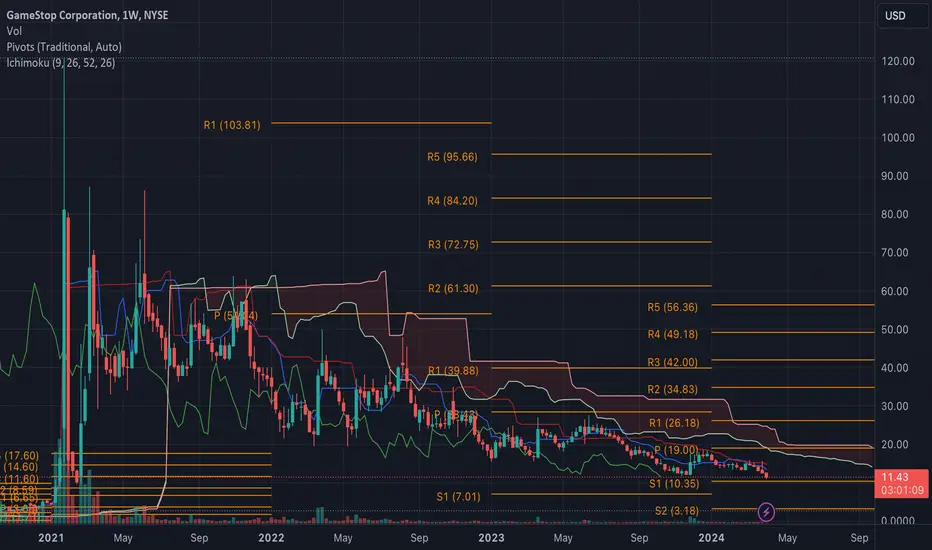
The Ichimoku Cloud on the weekly chart is bearish as prices trade below the cloud. The conversion line (blue) below the baseline (red) further indicates downward pressure.
Price Targets and Trade Strategy:
Based on the technical forecast and pivot points, one could speculate that should the price action stabilize above the pivot point at $19.00, it may open the door to test resistance levels at $26.18 (R1) and $34.83 (R2).
Conversely, a break below the classic S1 pivot at $10.35 could see the stock testing lower supports at $3.18 (S2), a level that would present a highly oversold state and potential buy opportunity for risk-tolerant traders.
Based on the one-year forecast, the stock has a potential upside of +40.14%, averaging at -18.02% with a downside risk to -49.37%. A speculative target price could be set at $15.50, denoting a 40% potential increase from the current levels. However, this should be taken with due diligence and monitored closely for adherence to one's risk management protocols.
Conclusion and Actionable Insights:
Investors could consider accumulating positions if the stock shows resilience above the S1 pivot point, with an eye for a mid-term hold aiming for R1 or R2 targets.
Traders might seek short-selling opportunities, provided the moving averages continue to indicate sell signals, particularly if the price remains below key moving averages on higher time frames.
All entry points should consider the MACD and RSI for confirmation, and exits should be predefined to manage risks effectively.
It is vital to monitor upcoming earnings reports and market sentiment shifts, as these could drastically alter the technical forecast presented herein.

$GME #GME GameStop price going upWhy is GameStop price doing what it is doing?
It is clear that the price has nothing to do with Company news, investor sentiment or fundamentals and that the price is controlled within a fixed set of parameters. Main stream media, mostly owned and/or controlled by hedge funds, are used to try and make sense of it all for Joe Public.

$GME massive squeeze incoming as $GME breaks multi-YEAR triangleNYSE:GME A massive amount of May out of the money NYSE:GME calls hitting tape. NYSE:GME attempting to break out of a massive multi-YEAR triangle. #DiamondHands 🍿💎👐

Gme bounced a 9.618Look for more upside as the 9.618 is a powerful level to bounce at. Based on euromotifs genesis fibs

$GME: 🚨Most Important TA Ever Part 2 Heading Back to $14🚀🚀🚀Hi everyone,
Financials
GameStop is in an exciting phase of transformation and financial stabilization, as shown by its latest financial report. The company has successfully turned a significant loss into a net income, indicating not just resilience but strategic navigation through market challenges. A standout is the positive shift in EBITDA to $64.7 million, signifying GameStop's improved operational efficiency and ability to generate profit from its core activities. Despite a dip in net sales, GameStop has showcased excellent cost management and maintained strong liquidity. This, combined with strategic leadership enhancements, positions GameStop well for tapping into the evolving gaming and retail sectors. For investors, the improvement in EBITDA is a positive sign of GameStop's growing ability to fund operations, invest in growth, and potentially offer shareholder value from its main business operations, rather than relying on financial maneuvers or asset sales. This makes GameStop a compelling investment choice for those interested in a turnaround story within the dynamic retail and gaming markets.
Technical Analysis
Every time GameStop has made a double bottom, there has been a significant rebound to the upside.
May '21 + Aug '21 (+80%)
Mar '22 + May '22 (+149%)
Jan '23 + Mar '23 (+79%)
Nov '23 + Apr '24? (+?%)
The indicators continue to show a bearish trend, suggesting a potential further decrease in price. NYSE:GME recently touched the 0.786 Fibonacci retracement level. If positive news or market actions occur, there's a chance for a rebound up to the daily resistance.
Downside PT: $10.68
Upside PT: $14 and $15. (Price needs to stay above $12.78 for this to potentially play out).
Will be updating this as it plays out.
All the best!
Good luck and not financial or sexual advice. :)

GameStop. A Speculative Gaze at Potential Trading Strategies.As we dive into the technical fabric of GameStop Corp's (GME) stock, we are greeted by a tapestry of indicators and patterns that sketch out both caution and speculative opportunities for the discerning trader. Let's unravel the threads of the latest price action and market data to envision a trading strategy that is as informed as it is speculative.
Price Action and Candlestick Analysis:
GameStop has seen a tumultuous journey, marked by substantial volatility. The latest weekly candlestick portrays a somber picture—a close at $10.42, which is a slight recovery from the intraday low. This indicates a struggle between bulls and bears, yet neither claims victory convincingly. The candlesticks preceding this have consistently formed lower highs and lower lows—a classical downtrend signal.
Ichimoku Cloud Analysis:
The stock is currently trading below the Ichimoku Cloud, indicating that the path of least resistance is to the downside. The Conversion Line (blue) at $12.92 is below the Base Line (red) at $14.27, reinforcing the bearish sentiment. The Lagging Span intersecting the price from above suggests that the current trend has momentum, but the proximity to the price also hints at potential consolidation or reversal in the near future.
Fibonacci Retracement Levels:
The Auto Fib Extension tool has anchored the 0.618 retracement level at $8.81, which could potentially serve as a critical support level. Conversely, the 0.236 retracement level at $14.59 is now a resistance that bulls must overcome to regain control.
Volume Analysis:
Volume spikes are noticeable during price declines, indicating that selling pressure has been accompanied by increased trader interest, potentially signaling capitulation stages.
RSI and Stochastics:
The RSI is hovering around 30, which is a threshold for oversold conditions. Meanwhile, the Stochastic indicator is also near oversold levels, suggesting that the stock might be due for a corrective bounce.
MACD:
The MACD remains in bearish territory, with the histogram showing increasing bearish momentum. This could indicate that there may still be some downside before any potential reversal.
Speculative Price Targets:
If the bearish momentum continues and the stock breaches the $10.00 psychological support, the next target could be at the 0.618 Fib level ($8.81). A break below that might open the door towards the 1.618 Fib extension ($7.01), which would be an aggressive bearish target. On the flip side, if the bulls mount a comeback, a push above the $12 level could aim for the 0.236 Fib retracement ($14.59), with a speculative eye on the $18.00 zone, coinciding with the Ichimoku Cloud base.
Potential Buy and Sell Zones:
A conservative buy zone could be approached if the price stabilizes above the $10.42 level with increasing volume and a bullish crossover in MACD. An aggressive trader might consider entering near the $8.81 level, hoping for a bounce from the oversold conditions.
For selling or shorting, one could look for rejection at the $14.59 resistance or a failure to maintain support at $10.42. The strategy would depend on whether one is looking for short-term bounce plays or riding the bearish trend.
In conclusion, GME's technicals paint a picture riddled with bearish undertones but not without speculative opportunities for rebound trades. Traders should monitor key levels and indicators closely, prepared to pivot with the shifting tides of market sentiment. Remember, the markets are fickle, and technical analysis is but one part of a comprehensive trading strategy.

GME 8/23/2022GME
Why hasn’t #Wallstreetbets save their fanboys?
GME Weekly chart analysis
Let’s compare 2021 vs 2022
Pretty clear and straight forward.
2021
Two green weeks mid Jan.’21 sent price flying from 9.75 to high of about 120.65.
Since then, GME has done nothing but make a series of Lower Highs into Support area @ 37.95-45.55.
These Lower highs into support area displayed the weak buyer pressure by bulls. A bearish Descending Triangle was formed.
After 10 months of failing to break a high, in Nov.’21 Bulls did the unexpected and “broke out” of the Triangle looking to continue the previous up-move.
This “Breakout” was short lived as the pressure from the sellers overwhelmed the buyers. Price was shot back down below Triangle breakout point. The “breakout” move was deemed a “False breakout/Price rejection”.
In Dec.’21, the false breakout was followed by price breaking down below Support area @ 37.95-45.55 and the 50 ema. This is the 1st time since Aug.’20 that price falls below and lost Support of 50ema.
All of 2021 was spent by the Bulls/Buyers trying to fight off the Bear/seller pressure and trying to stay above Support area @ 37.95-45.55 and the 50 ema.
They were systematically broken down and eventually overwhelmed and conquer by the Bears/Sellers.
2022
After breaking down from Support area @ 37.95-45.55 and the 50 ema, by end of Jan.’22 price made a Lower Low and found new Support @ 22.20.
From Support @ 22.20, price bounced are looked to break back above Support area @ 37.95-45.55 and the 50 ema.
Price failed to stay above previous Support and was rejected back down to 22.20. Support area @ 37.95-45.55 and the 50 ema were turned into Resistance area/level.
Price bounced one move time from Support @ 22.20 to Support turned Resistance area @ 37.95-45.55. We have a Price rejection pattern here. This is cue to enter trade short.
The Bulls/Buyers have spent all of 2022 moving sideways between new Lower Low/Support level @ 22.20 and previous Support turned Resistance area @ 37.95-45.55 and the 50ema.
After a hot 2 weeks in Jan.’21 that saw price fly from 9.75 to 120.65, GME has now spent 81weeks moving side-ways with the Bears/sellers systematically breaking down the Bulls/Buyers.
Now with the 2nd price rejection @ Resistance area @ 37.95-45.55 and the 50ema, Bears will look to move price back down to Support @ 22.20 and then breakdown to Support area @ 9.75.
Why hasn’t #Wallstreetbets put their powers together again and save the bleeding out GME bag holding fanboys still talking about “going to the moon”?
Sad to see them let the fanboys over @ AMC get cooked earlier this week.
With extreme bear conditions and price siting at “area of value”, I will be entering trade short.
Short term trade
Entry: 33.53
Stop loss: 22.20(-22.98%)
Target: 22.20, +33.93%, +1.48 RR ratio
Long term trade
Entry: 33.53
Stop loss: 52.50(-56.76%)
Target: 10.00, +70.14%, +1.24 RR ratio

Bearish Continuation for GameStop As of the latest session, GameStop Corporation (GME) is trading at $11.38, witnessing a marginal decrease of 1.30% from the previous close. The stock is experiencing a prolonged downtrend as evidenced by the weekly chart indicators and moving averages.
Ichimoku Cloud Analysis:
The Ichimoku Cloud, a comprehensive indicator, shows a bearish trend as the price action is below the cloud. The conversion line (blue) remains below the baseline (red), suggesting that bearish momentum persists. The lagging span is also below the price and the cloud, indicating that the current trend has the backing of historical price action.
Pivot Point Analysis:
The traditional pivot points reveal significant resistance levels with R1 at $26.18, suggesting a potential short-term ceiling. However, the distance between the current price and the first resistance highlights the lack of bullish momentum in the near term. Support levels are identified with S1 at $10.35, which could act as a possible floor if bearish pressure continues.
Volume Analysis:
Volume trends are pivotal for confirming price movements. The recent trading sessions have observed a volume of 27.229M, which is below the average volume of 4.96M (30D). This reduction in volume may indicate a lack of conviction in the current price decrease, suggesting that a reversal or sideways movement could be imminent.
Moving Averages:
GME’s price action is below both short and long-term moving averages, reinforcing the bearish outlook. The crossover of shorter moving averages below longer ones in recent periods further confirms this downtrend.
Conclusion:
GameStop Corporation's technical analysis indicates a sustained bearish trend, with the Ichimoku Cloud, pivot points, and moving averages signaling downward momentum. However, the decreased volume suggests that the current trend might lack strong conviction among traders. Investors and traders should monitor key support and resistance levels, as these will likely play a pivotal role in determining GME’s price action in upcoming sessions. It is advisable for traders to seek confirmation through additional indicators and keep an eye on broader market trends and news that may impact investor sentiment and consequently, GME’s stock performance.
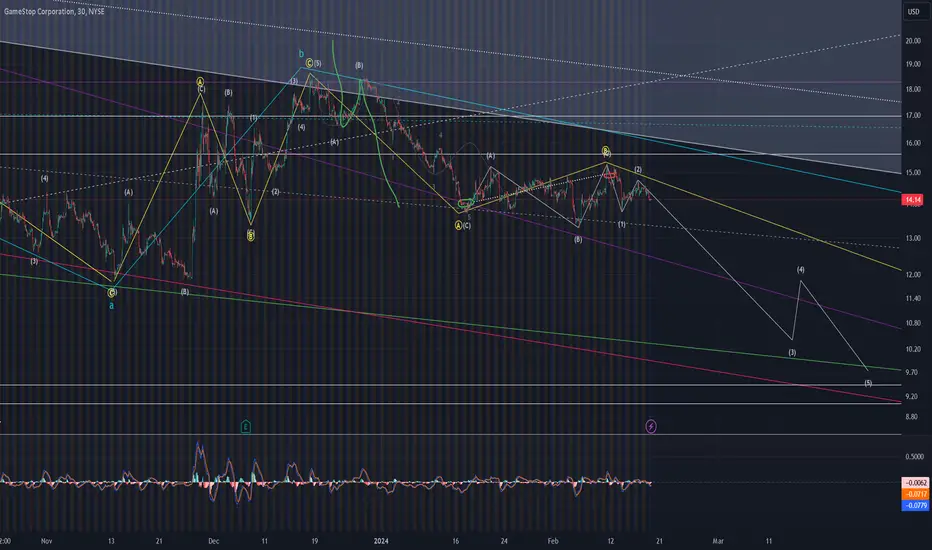
Looking for sustained downward pressureSolely based on pattern, and my assumption we are in a wave 2, before the big push, higher, I look for GME to get pounded, down into the single digits, targeting sub 10 before either taking off, or further subdividing in Ending Diagonal Fashion, before eventually reaching 6-7 bucks, in May.
$GME: Return to $15? 🚀🚀🚀Hi everyone,
In my previous analyses, I anticipated a potential price drop that could form a double bottom pattern if GameStop earnings weren't great. Recently, GameStop's stock failed to surpass a crucial weekly indicator, leading to a sharp decline. Moving forward, if the stock rebounds, I'll be monitoring its response to the first resistance level; breaching that could signal a push towards significant resistance on the daily and weekly charts.
Will update here if something exciting happens. Maybe insider buying in the next 2 weeks?

$GME: 🚨 Most Important TA Ever. $21 and beyond 🚀💎🙌Hi Everyone,
In my previous posts, I explained that NYSE:GME needs to remain above crucial levels to ascend, predicting a bounce between $13-$16 before earnings. Here we are, and according to my indicators, $15.44 needs to be surpassed and maintained tomorrow for a climb to $21 . Currently, during Robinhood's extended scam hours, it's at $15.68, peaking at $15.78.
What happens after reaching $21?
If GameStop reports profits exceeding Wall Street's expectations, we could see a breakthrough above this significant resistance level, potentially igniting a meteoric rally to $32 and then $41. At $41—where I'd consider taking profits—some resistance is anticipated. Beyond that, $56 and $298 are the next targets. However, a surge to $21 before the market closes could see a retest of this level, with real momentum expected if it breaks during regular trading hours.
And if we gap down?
A gap down could occur if GameStop's earnings beat expectations but with unimpressive profit margins, potentially leading to a double bottom pattern before a subsequent rally in after-hours trading or the days following.
Conclusion
Get pumped! Envision this: Ryan Cohen and team doubling down post-profit, pushing the price to test $41 and ultimately reaching new highs, with potential buybacks on the horizon. As always, this is not financial or investment advice. Trade cautiously tomorrow, folks! I'll try to post an update tomorrow. If you found this insightful, please leave a like or follow. 🚀

Gamestop market psychology during bubble in 2021.Very interesting take on GME. You need a sustainable higher highs for an uptrend, or most of these are perfect bull traps. Way to measure is also due to public sentiment, euphoria. Potentially easy money phase.

GME potential buy setupReasons for bullish bias:
- Basic DOW theory
- Entry at HH breakout
- Bullish divergence
- Earnings post market today
Entry Level(Buy Stop): 16.16
Stop Loss Level: 12.81
Take Profit Level 1: 19.51
Take Profit Level 2: 22.86
Take Profit Level 3: Open

$GME and the weekly resistanceIt has tested and failed this strong resistance 4 times over the last 9 months. If it can break through it with this week's earnings release, then I expect it to become a strong support.

GameStop Balanced Financial Struggles with Bullish BreakoutAmidst a turbulent period marked by declining stock prices and revenue woes, GameStop Corporation ( NYSE:GME ) finds itself at a crossroads in the gaming industry. Despite facing significant setbacks, including a staggering decline in stock price and revenue, the company maintains a robust balance sheet and strategic initiatives that hint at a potential turnaround.
As GameStop ( NYSE:GME ) grapples with its financial challenges, investors closely scrutinize its recent decision to invest excess cash into other ventures rather than pursuing stock buybacks. This move has sparked debate among stakeholders, raising questions about the company's long-term strategy and allocation of resources.
With the anticipation of the company's upcoming financial results, scheduled to be unveiled on Tuesday, analysts and investors alike eagerly await insights into GameStop's ( NYSE:GME ) performance amidst a slowing gaming industry. Despite recent revenue declines, the company's ability to narrow losses through cost-cutting measures offers a glimmer of hope for a potential rebound.
Technical analysts point to a compelling bullish breakout potential, as GameStop ( NYSE:GME ) forms a falling wedge pattern nearing its confluence zone. This bullish signal, coupled with an upcoming earnings announcement, underscores the pivotal moment for the company's trajectory, with $15 emerging as a key milestone to watch.
In the face of adversity, GameStop ( NYSE:GME ) retains its resilience, bolstered by a strong balance sheet boasting substantial cash reserves and minimal debt. While challenges persist, the convergence of financial stability and bullish technical indicators presents an intriguing investment opportunity for discerning investors seeking to capitalize on potential upside momentum.
As GameStop ( NYSE:GME ) navigates these uncertain waters, the company's ability to strike a balance between addressing financial struggles and leveraging breakout opportunities will ultimately determine its path forward in the ever-evolving gaming landscape.

$GME - The week before earnings releaseIt's the week before earnings release and looking at the previous earnings release, it seems a dangerous time to buy puts or sell covered calls.
Not advice, only my opinion. You must do your own DD and what is best for you and nobody else.

$GME - Probably tomorrowHi all,
Since i'm not participating in this run, you can have it.
imgur.com
Data indicates it may occur tomorrow. Good luck.

GME break looks like it's made Strong down from the last posting saying we were into important supports.
Targets on one of the first postings of GME short here hit in the last swing down, but these levels did not hold as support - which may spell out much more downside.

$GME: 🚨 $21 next target 🎯Hello everyone,
Hope everyone is excited as I am for this next move up. If NYSE:GME is able to break above $15.81 and hold it there with a 4hr or daily close, then price should move up towards $21. Conversely, if NYSE:GME fails to break above and hold above those levels, then NYSE:GME will fall down to the $12.40 area with a hopeful bounce at $13.50.
Overall, I'm still bullish on NYSE:GME because the indicators suggest it is still in a bullish configuration. Since my last post where I forecasted a pop to $15.76, NYSE:GME may retest $15.05 before bulls take over and break above $15.81 to make the move to $21.
Good luck, everyone! As always, not financial or sexual advice. 🚀 I will try my best to update this post once we see some action on either side.
